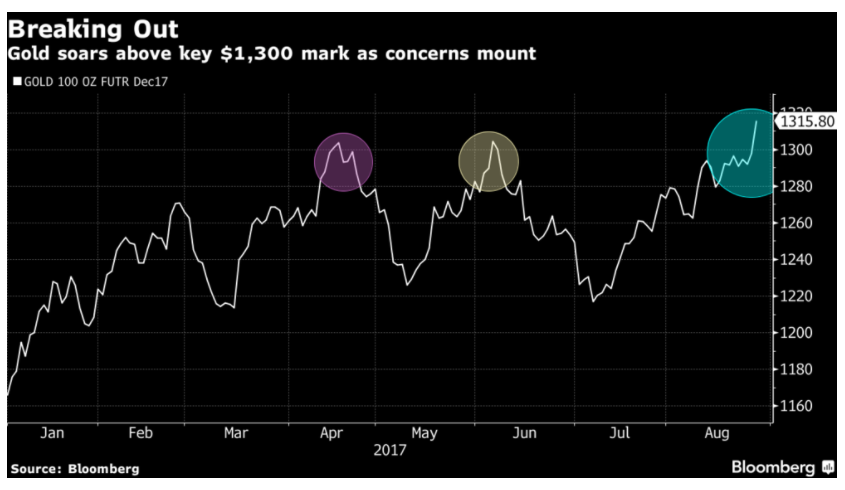
Gold has tested $1300 level 3 times since April and it finally broke above the level on Monday and rose to the highest level this year. The trigger of the break seems to be the North Korea firing a ballistic missile over Japan, which boosts the safe haven demand. The yellow metal then extended the rally to 11 month high after North Korea nuke test. Gold’s strength, however, can not be attributed to just one event, but rather over a series of concerns which start to build a wall of worry among investors.
A few weeks ago, White House chief economic adviser Gary Cohn came close to resigning after president Trump’s response of blaming “both sides” in the deadly violence at Charlottesville, Virginia. Mr. Cohn is the main architect of President Trump’s tax reform agenda, and thus when news of his possible departure started to circulate around Aug 17, markets were spooked. Then there are also concerns of government shutdown if the debt ceiling is not raised. If this happens, it will trigger technical default on U.S debt.
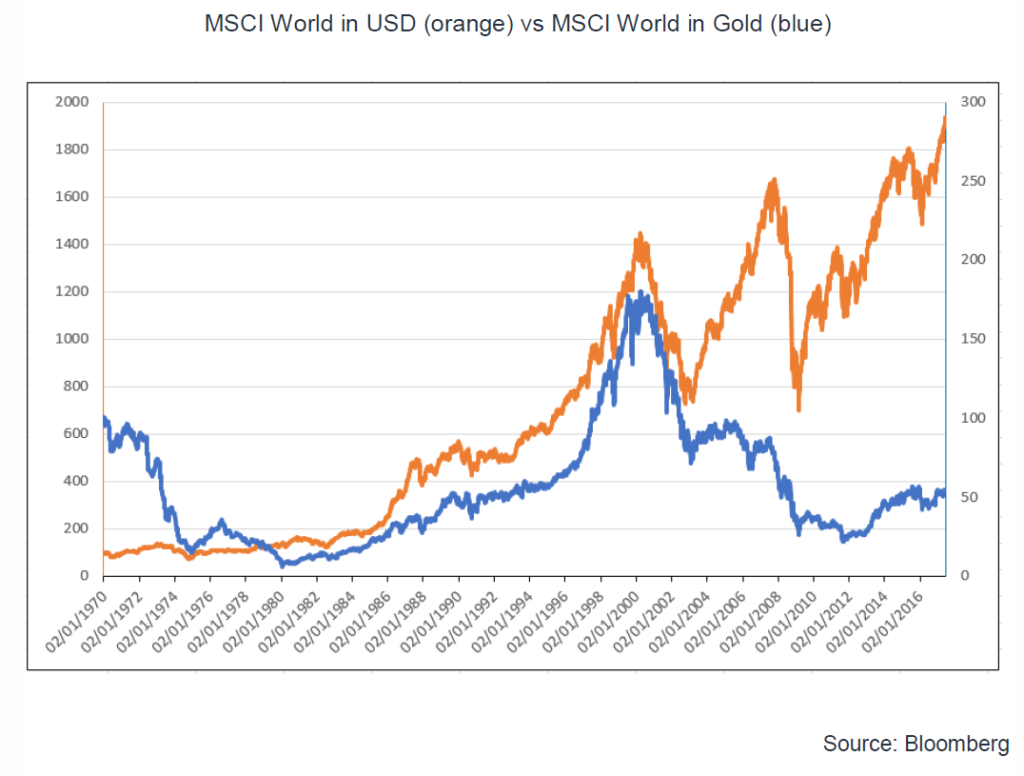
Apart from the argument of safe haven demand, Gold for some people is considered as the best form of sound money. Unlike fiat money which can be printed ex nihilo, Gold has limited quantities. It has survived thousands of years as a form of money, longer than any other alternative forms of payment. The chart below compares Gold’s role as store value vs the fiat:
The chart above shows that while equity markets are hitting all-time highs in USD term, it peaked against Gold in 2000 and remain 70% below the peak.
We believe Gold’s dual role as sound money and safe haven demand will become more prominent in the next coming months as the massive Quantitative Easing experiment by central banks around the world start to reveal the true costs. This month, we shall also see the market reaction to the U.S. Fed’s plans to normalize their balance sheet and taper bonds reinvestment. On paper, this is the same as money tightening and thus could have the opposite effect of money printing.
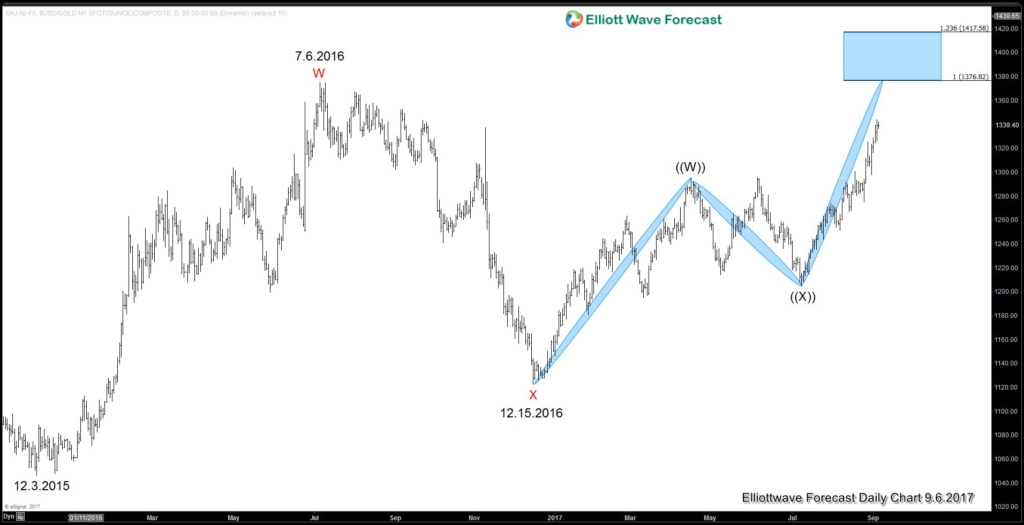
Gold Daily Elliottwave Sequence Chart
The Daily Chart of Gold shows the sequence from 12.15.2016 is bullish and favors more upside towards 1376.8 – 1417.6. When Gold reaches this area, it will also break above 7.6.2016 peak at 1375.15 which opens another larger bullish sequence from 12.3.2015 low. Thus, we don’t like selling Gold in any pullback and prefer to buy dips in 3, 7, or 11 swing.
Keep up with the most up-to-date analysis of Gold and trade together with us at Live Trading Room. Successful traders need to have a good trading system and also strict risk management with rules that define entry, stop loss, and take profit levels with high accuracy to allow traders to get into a risk free position in your trade as quickly as possible. To learn more about our services, register and try EWF 14 days.
Back


