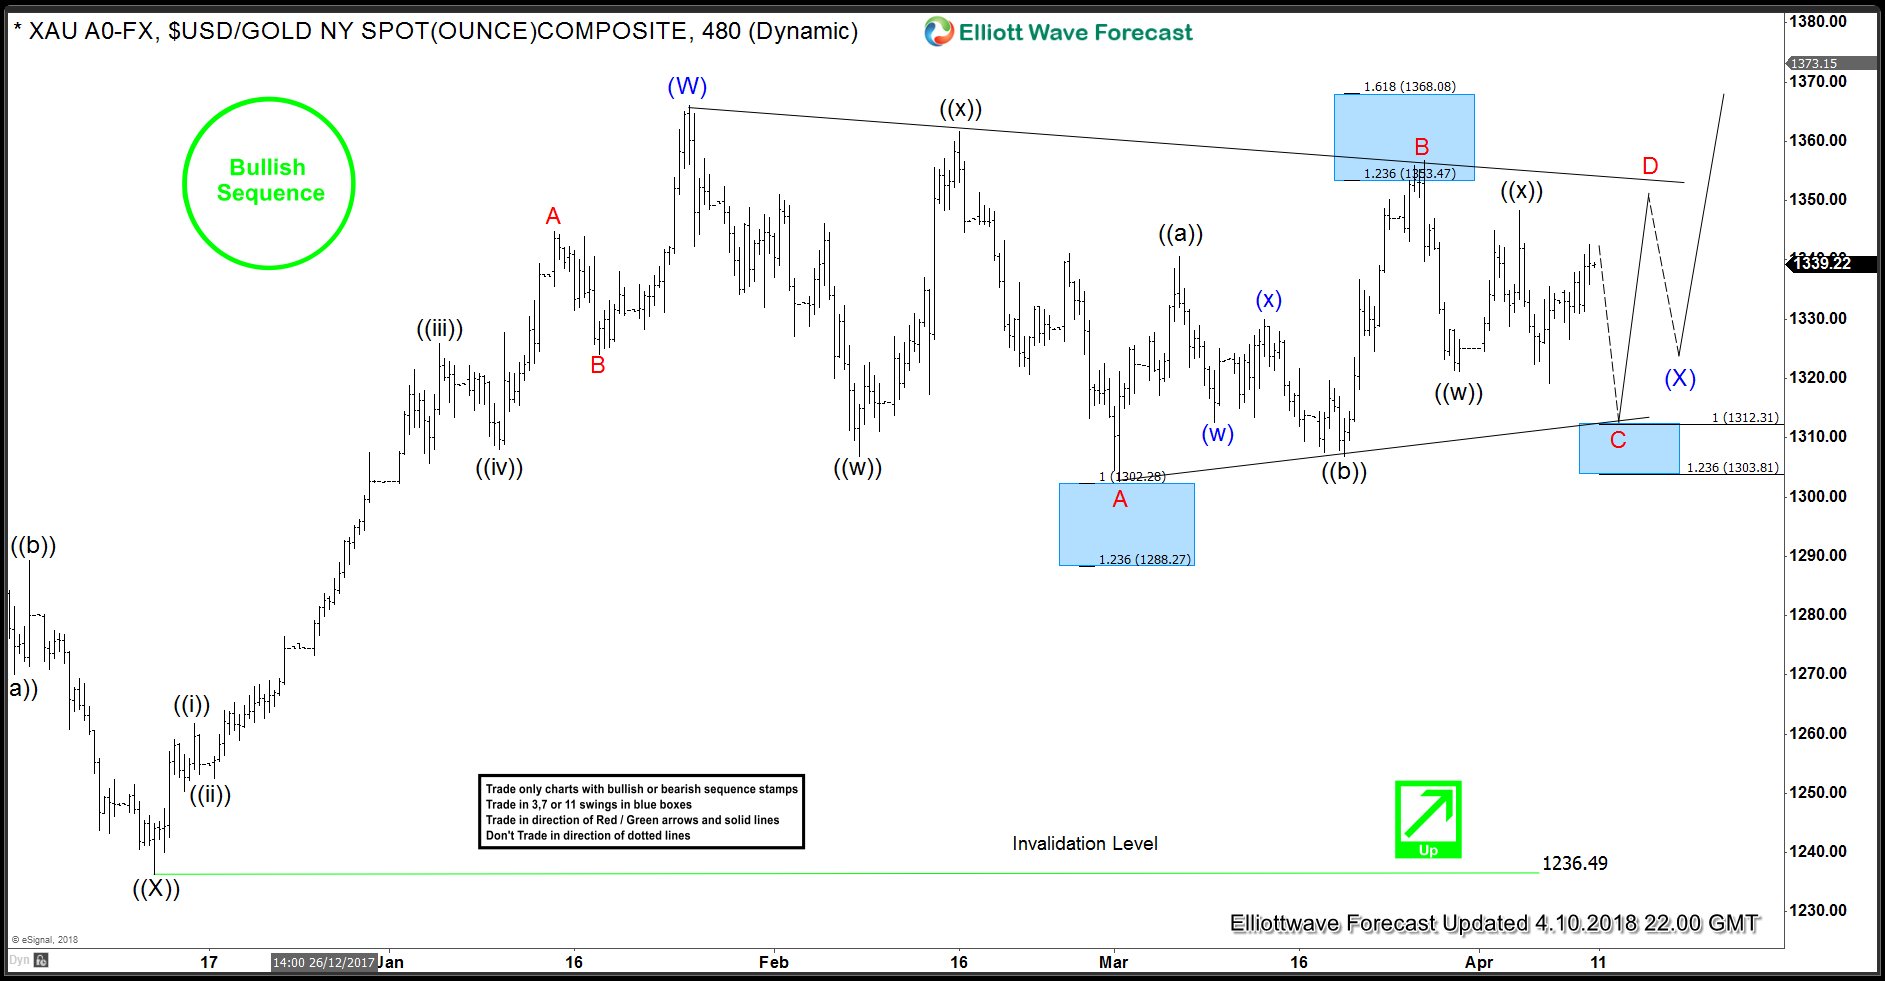
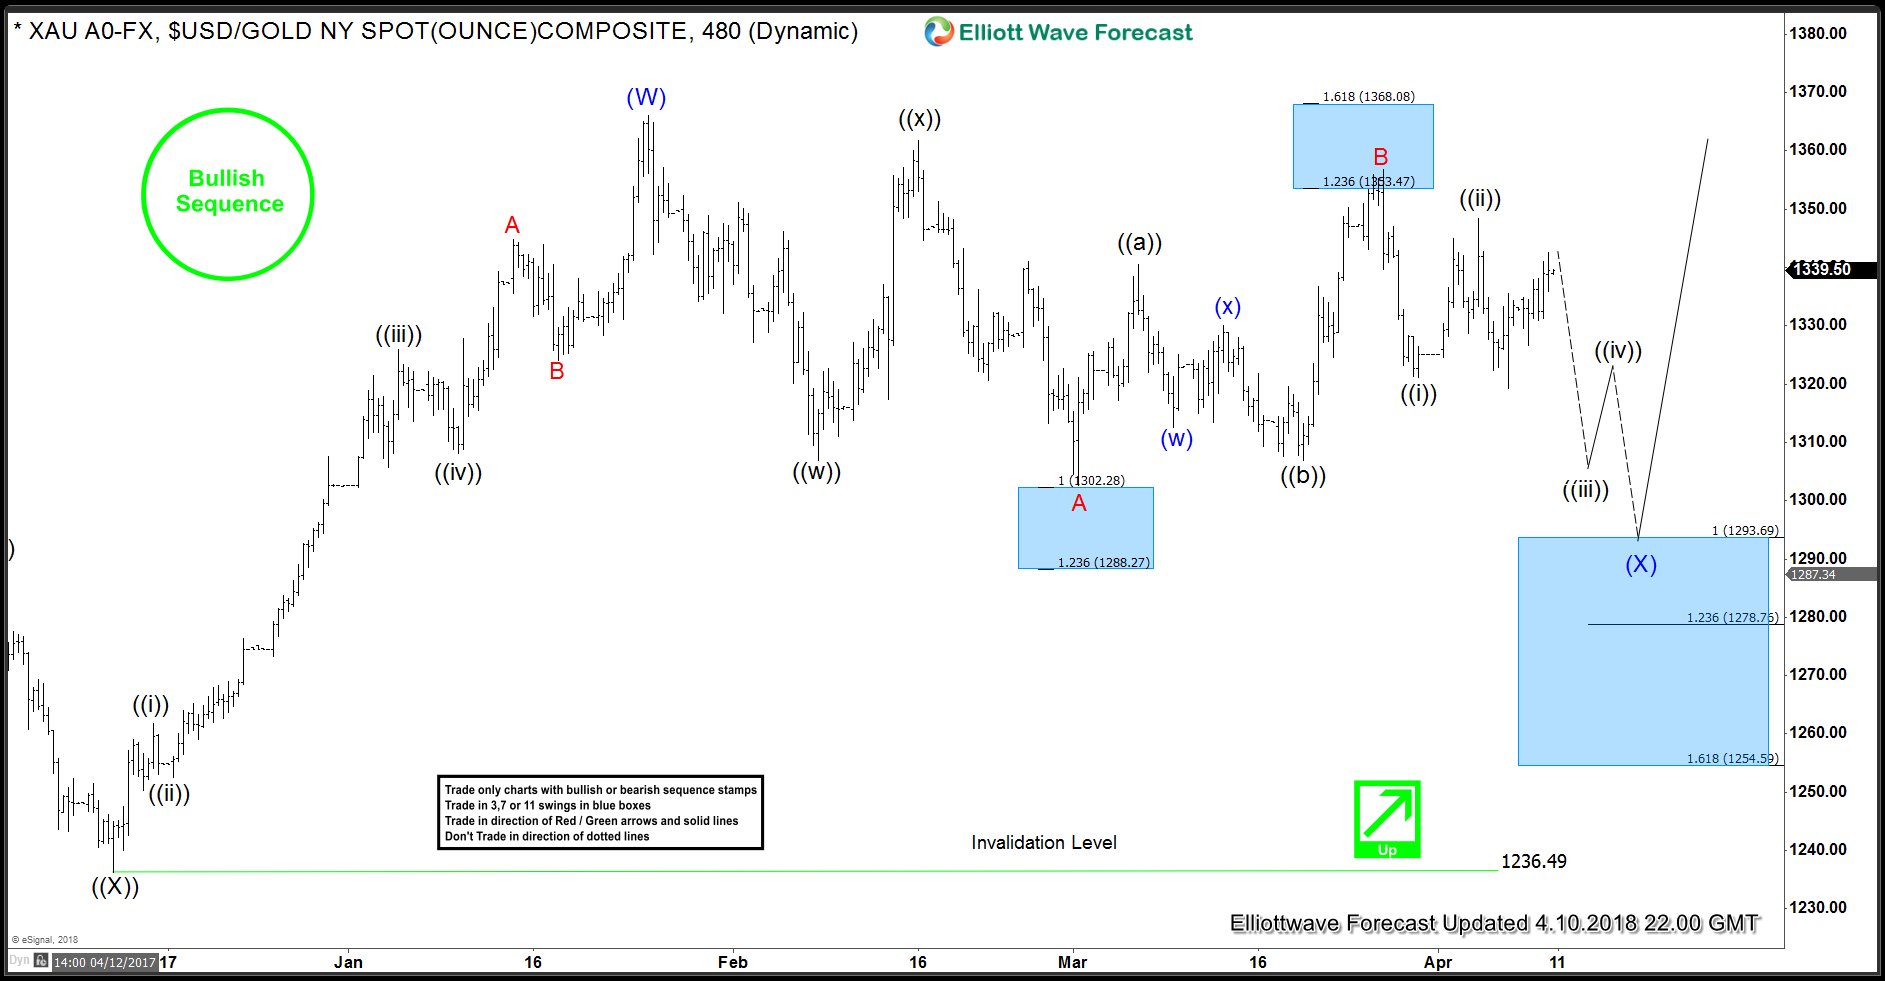
Gold has been trading in a sideways range between $1366 and $1302 for nearly 3 months now and has not yet managed to break the consolidation on either side. This consolidation is increasingly looking like a Bullish Triangle Consolidation and once completed, should result in a thrust out of the triangle. We will also present an alternative view in case the consolidation breaks to the downside. Our members and regular followers of our blogs know that we have been bullish the yellow metal and have been looking to buy the dips at extreme areas in 3-7-11 swings. Gold presented one such buying opportunity at the beginning of March when it dropped to $1303 area in a double three Elliott wave structure down from 1/25 peak. We are currently long and Risk free from $1303 area and waiting for the consolidation to end and the next leg higher to start.
Gold Bullish Triangle Consolidation
Chart above shows the sideways price action in the yellow metal since the peak at 1/25 ($1366). Decline from $1366 to $1302 took the form of a double three Elliott Wave structure and completed wave A, bounce $1302 to $1356 was a 3-3-5 FLAT structure and completed wave B. Down from there, so far the yellow metal is showing 5 swings lower which means the sequence from $1356 peak is incomplete and while below 4/4 ($1348) peak, there is scope for another push lower to complete 7 swings down from $1356 peak which should complete wave C of the proposed bullish Elliott wave triangle. Wave C could reach as low as $1312.31 – $1303.81 area and as it holds above $1302 low, we should expect another bounce in 3 waves in wave D followed by a pull back in wave E to complete (X) wave triangle. Then, break above B-D trend line would confirm that triangle thrust higher has started which could take us as high as $1450 target area that we have previously explained in this video blog. If $1302 low breaks, that would negate the Bullish Triangle consolidation and would expose $1294 – $1279 area in a larger double three correction. A possible structure could then be an Elliott Wave FLAT from 1/25 peak but even then we should see buyers in $1294 – $1279 area as the sequence from 12/2016 low remains bullish and incomplete to the upside.


