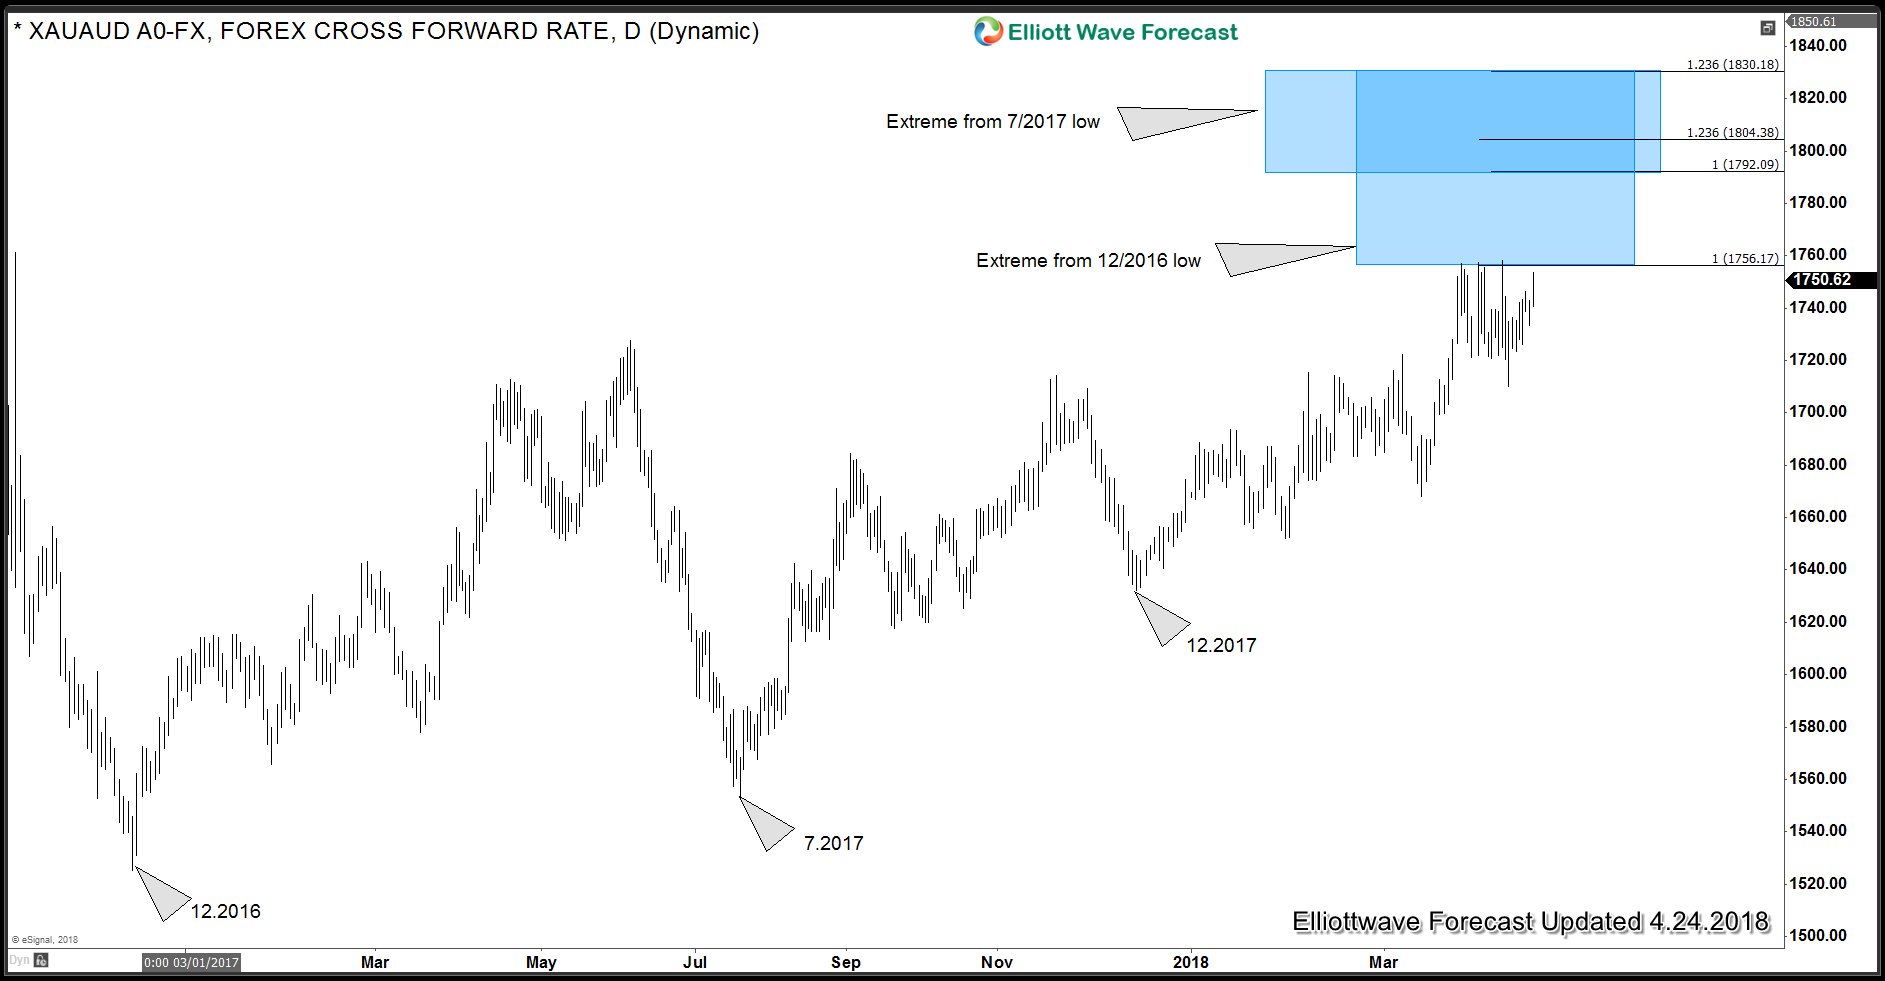
In this blog, we will take a look at Gold charts against US Dollar, AUD and GBP. Back in June 2017, we mentioned that XAUAUD should hold the low at December 2016 and turn higher. It did hold December 2016 lows and turned higher as expected. It has now reached the initial target at 1755 but cycle from July 2017 low appears to be incomplete still so we would take a look at two different cycles in XAUAUD and also take a look at a possibly extreme buying opportunity in Gold against GBP.
Gold versus Australian Dollar – Two Cycles and Two Extremes
In the above chart we can see 1756 – 1804 represents the extreme area from 12.2016 related to 7.2017 low. XAUAUD has already reached 1756 which meets the minimum target in the cycle from 12.2016 low. However, we can see another extreme area on the chart between 1792 – 1830 and this represents the extreme area from 7.2017 related to 12.2017 low. As far as 12.2017 (1632) low remains in place, we can expect further rally in XAUAUD towards 1792 – 1830 area where it should end cycle from 7.2017 low at least or could correct the entire cycle from 12.2016 low.
XAUAUD Weekly Elliott Wave Analysis
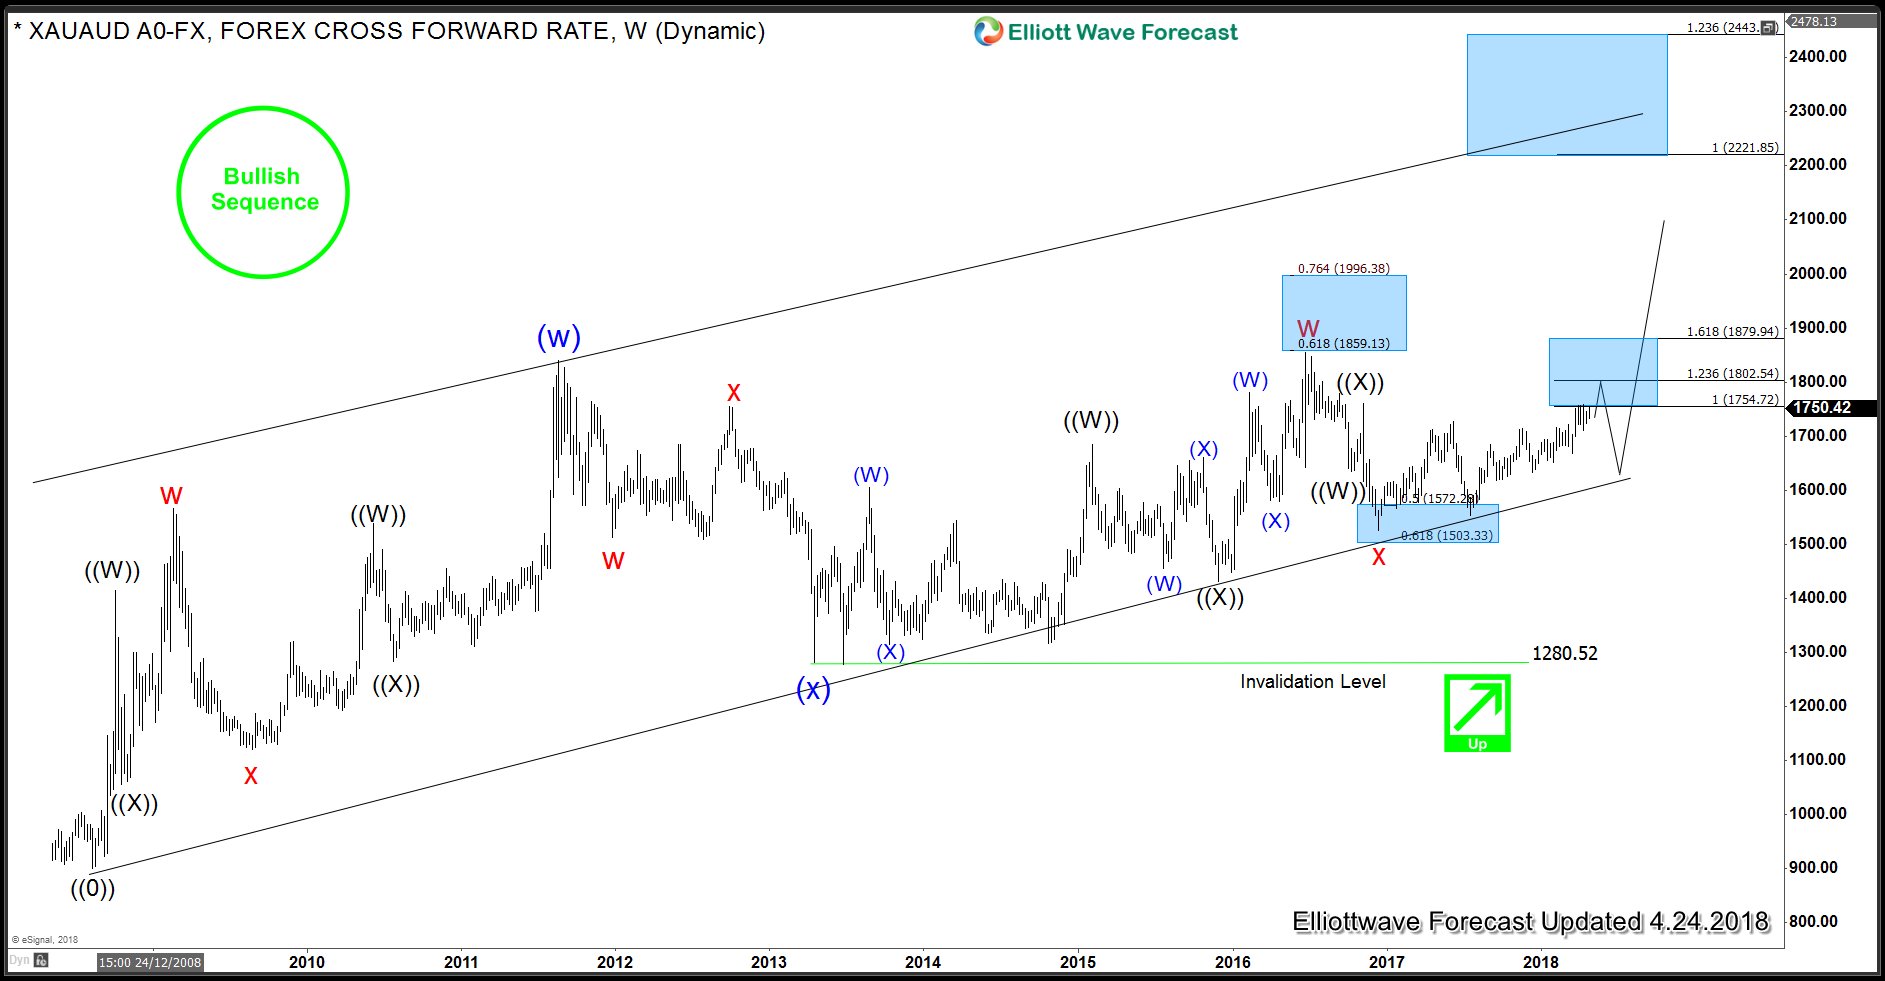
XAUAUD Weekly chart showing 5 swings up from 8.2008 low which is an incomplete bullish sequence and as dips hold above 12.2016 low (red x), we should see rally extending to new highs towards 2221 – 2443 area. As the chart shows, currently we are at an extreme area from 12.2016 low so we don’t like the idea of initiating new longs here or selling the instrument. Once current cycle is over, we would expect buyers to appear again in the dips in the sequence of 3, 7 or 11 swings.
Gold versus British Pound – Elliott Wave Analysis
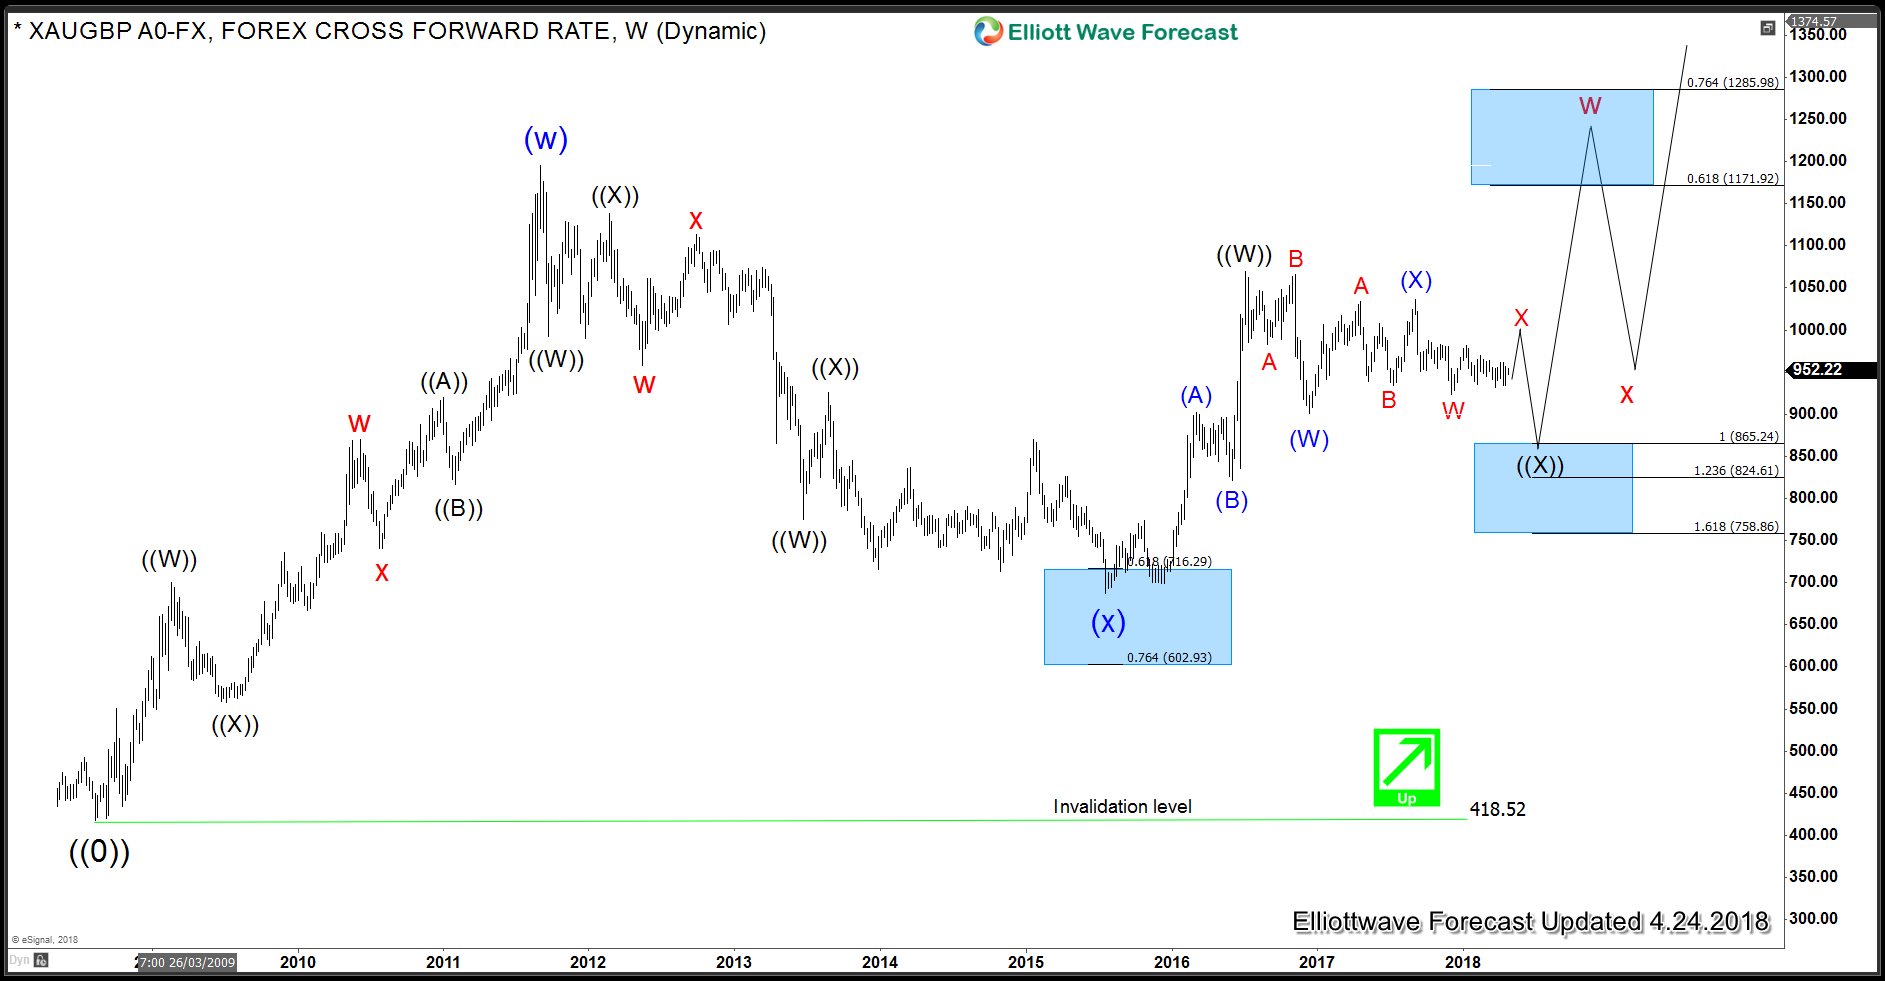
XAUGBP ended cycle from 7.2015 low and is still correcting that cycle. It did 3 waves lower to 12.2016 (901) and since then it has been trading sideways, as bounces fail below 9.2017 (1035), there is scope for another push lower towards 865 – 824 area. We don’t like selling and if above area is reached, it should end 7 swings from 6.2016 peak and should offer a buying opportunity which could take it to new highs towards 1171 – 1285 area or produce a larger 3 waves bounce at least to correct the cycle from 6.2016 peak at minimum. Failure to break below 12.2016 (901) low could make the case for a bullish triangle before a thrust higher.
Back


