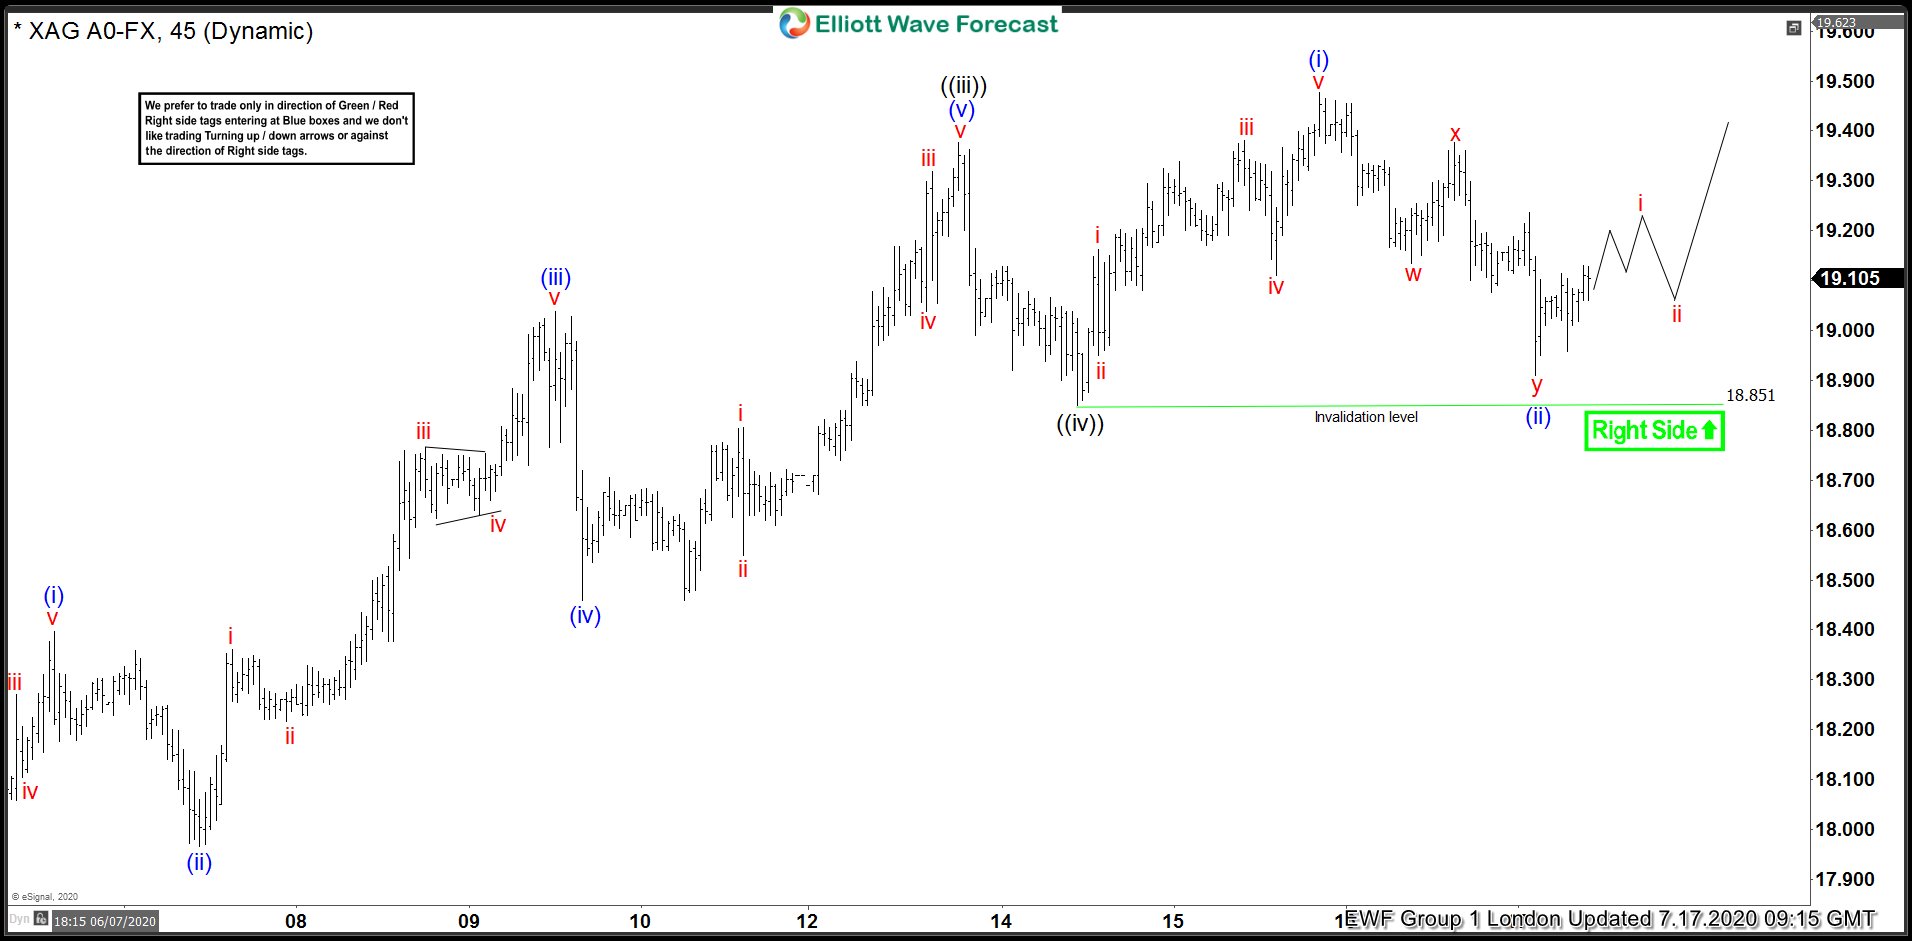
In this blog, we are going to take a look at the Elliott Wave chart of Silver (XAGUSD). The 45 minutes London chart update from July 17 shows that the metal has ended cycle from July 2 low. The rally in wave ((iii)) ended at 19.37 high. The sub-waves of the rally unfolded as 5 waves impulsive structure. Elliott Wave theory dictates that 3 waves pullback should happen afterwards before the rally continues. The metal then decline lower in wave ((iv)) and ended the pullback at 18.85 low.
Silver (XAGUSD) 7.17.2020 45 Minutes London Elliott Wave Update
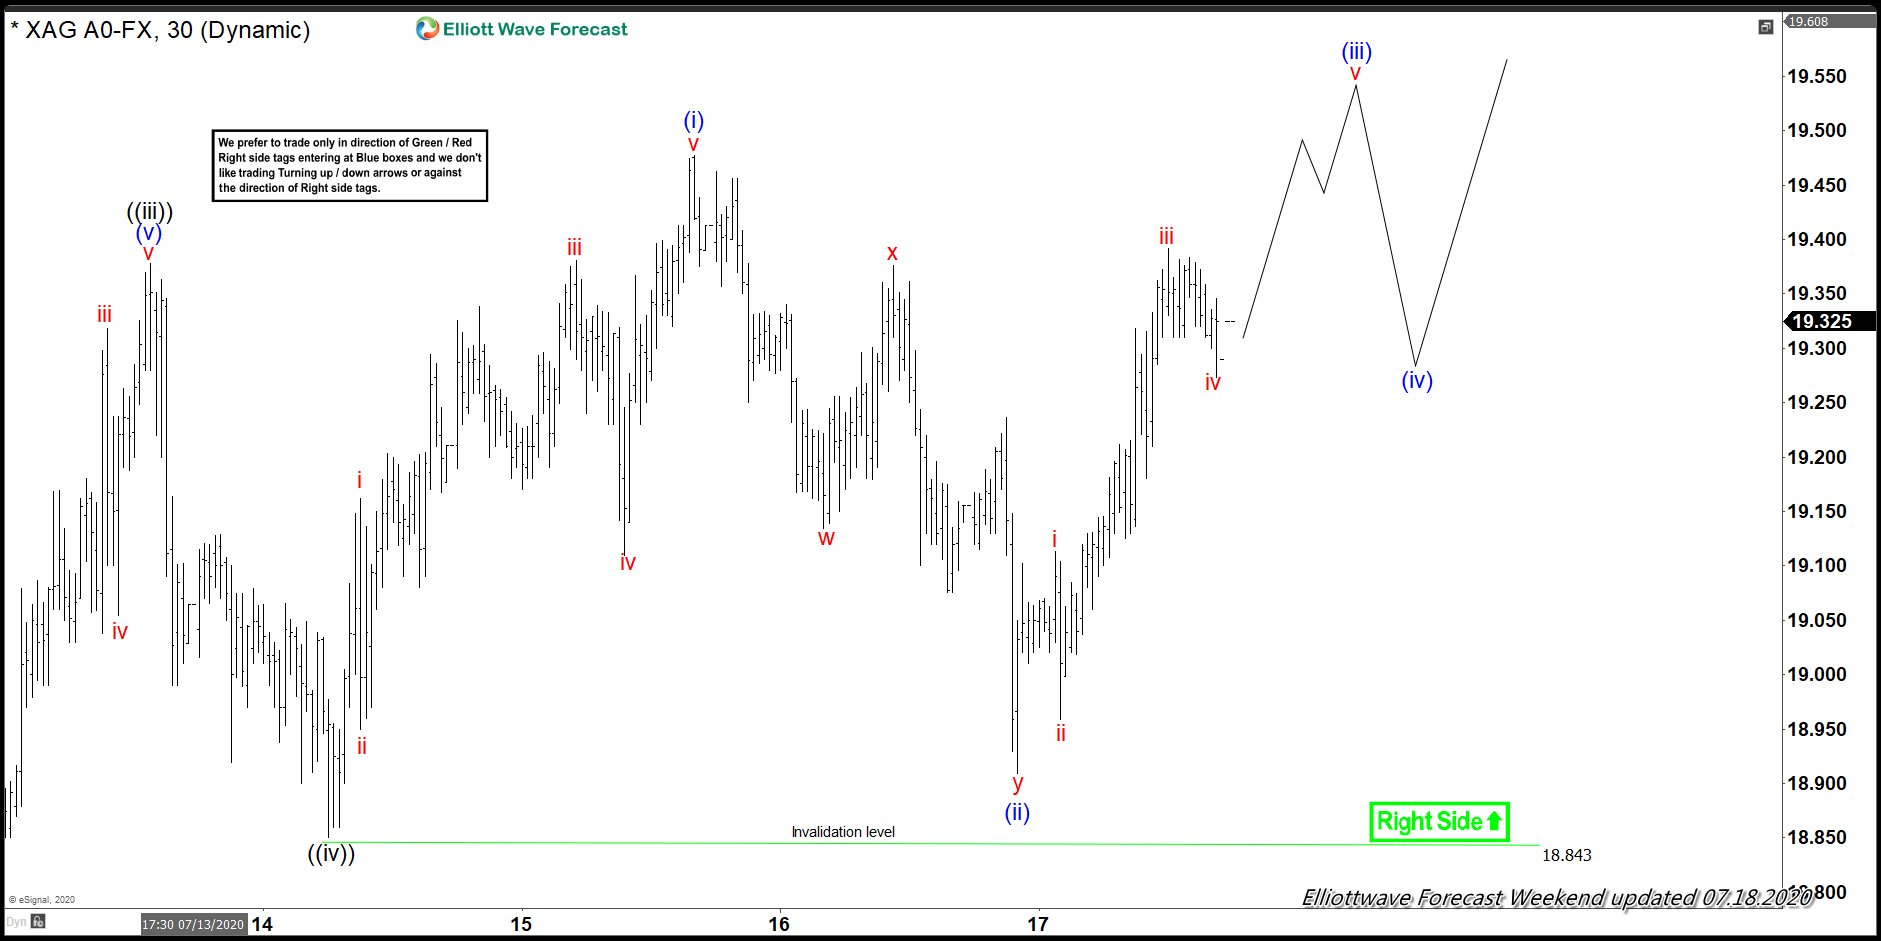
The 30 minutes weekend chart update from July 18 shows that up from wave ((iv)) low, the metal continued to rally higher in wave (i), which ended at 19.47 high. That rally broke above the previous wave ((iii)) high. This confirms that wave ((iv)) is already in place and the next leg higher in wave ((v)) is already in progress. As long as the low at 18.85 low stays intact, dips in 3,7, or 11 swings is still expected to find support for more upside later. Afterwards, wave (ii) pullback unfolded as a double three Elliott Wave Structure and ended at 18.91 low.
Silver (XAGUSD) 7.18.2020 30 Minutes Weekend Elliott Wave Update
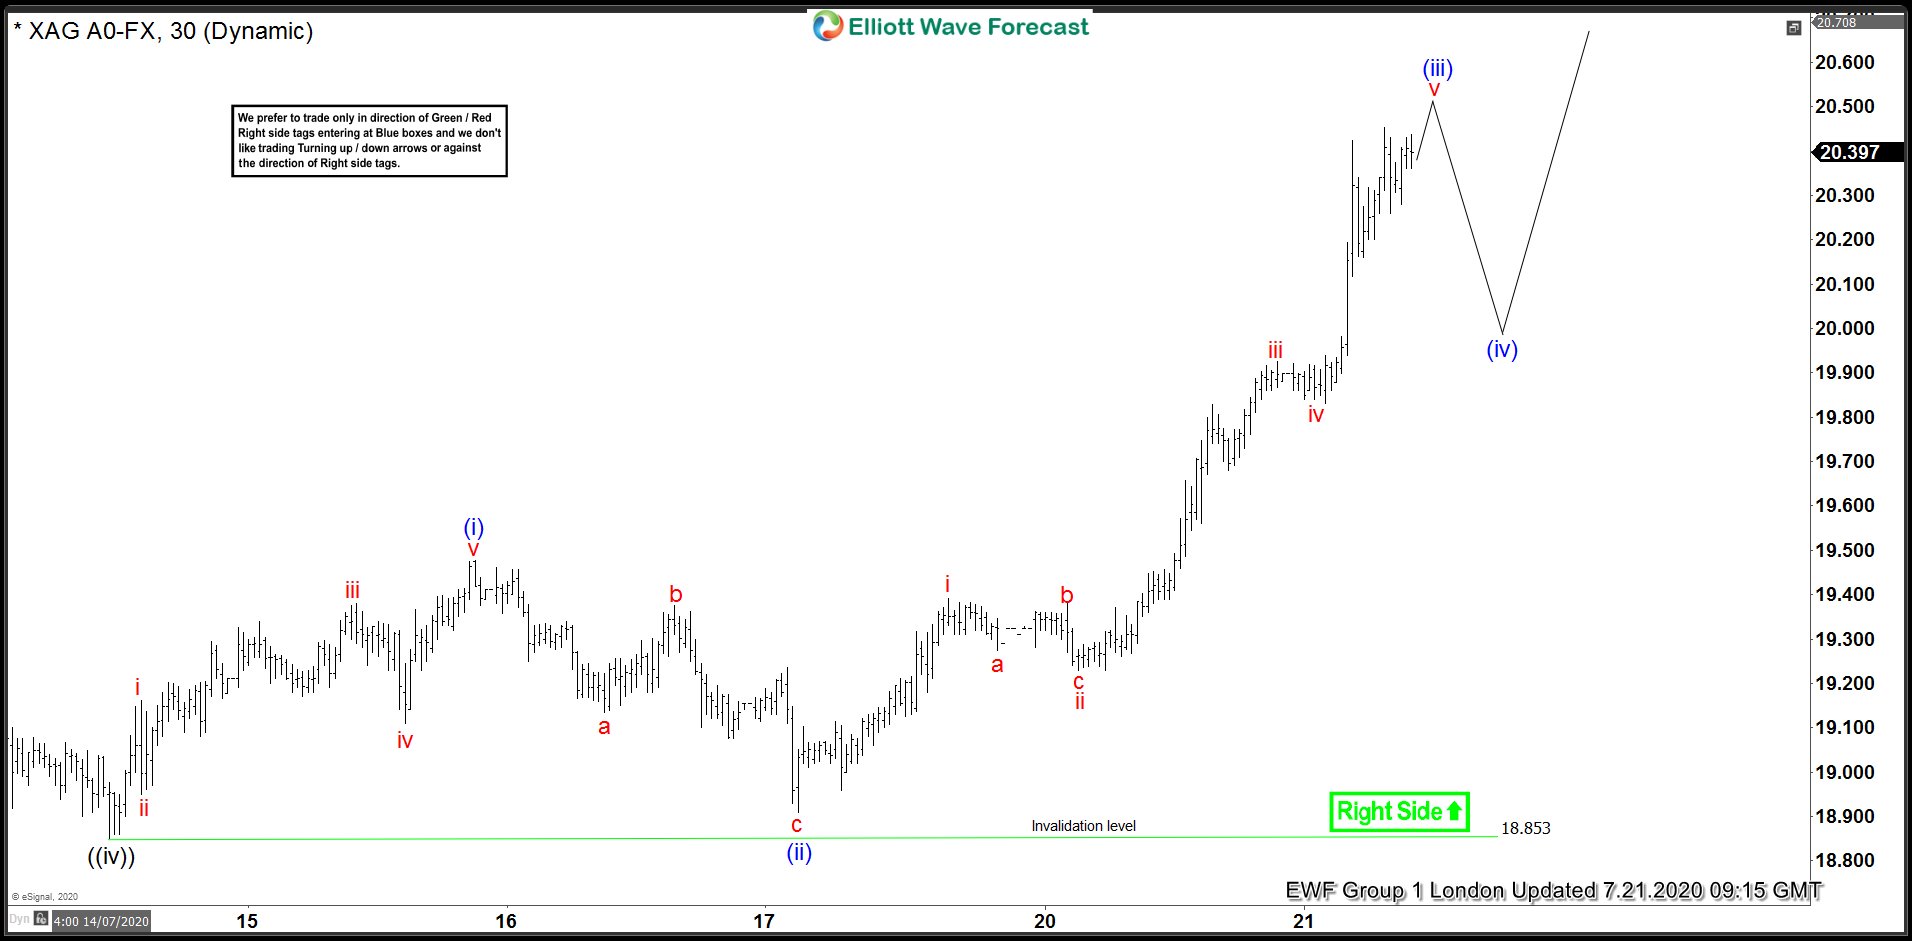
Up from wave (ii) low, silver extended the rally higher as expected. The 30 minutes London chart update from July 21 shows that the move higher also broke above wave (i) high. The metal can still see another high before ending wave (iii). After a pullback in wave (iv) later, the metal is expected to do another leg higher before ending wave ((v)).
Silver (XAGUSD) 7.21.2020 30 Minutes London Elliott Wave Update
Try our service with 14 days FREE Trial to see more chart updates and learn how to trade blue boxes using 3,7, or 11 swing sequence. We cover 78 instruments in 4 different time frames. Sign up now to get live session, daily technical video, 24 hour chat room, live trading room, and more.
Back


