Here, we will look at past short-term Elliott Wave charts of Palladium’s (PA) price action presented to our members.
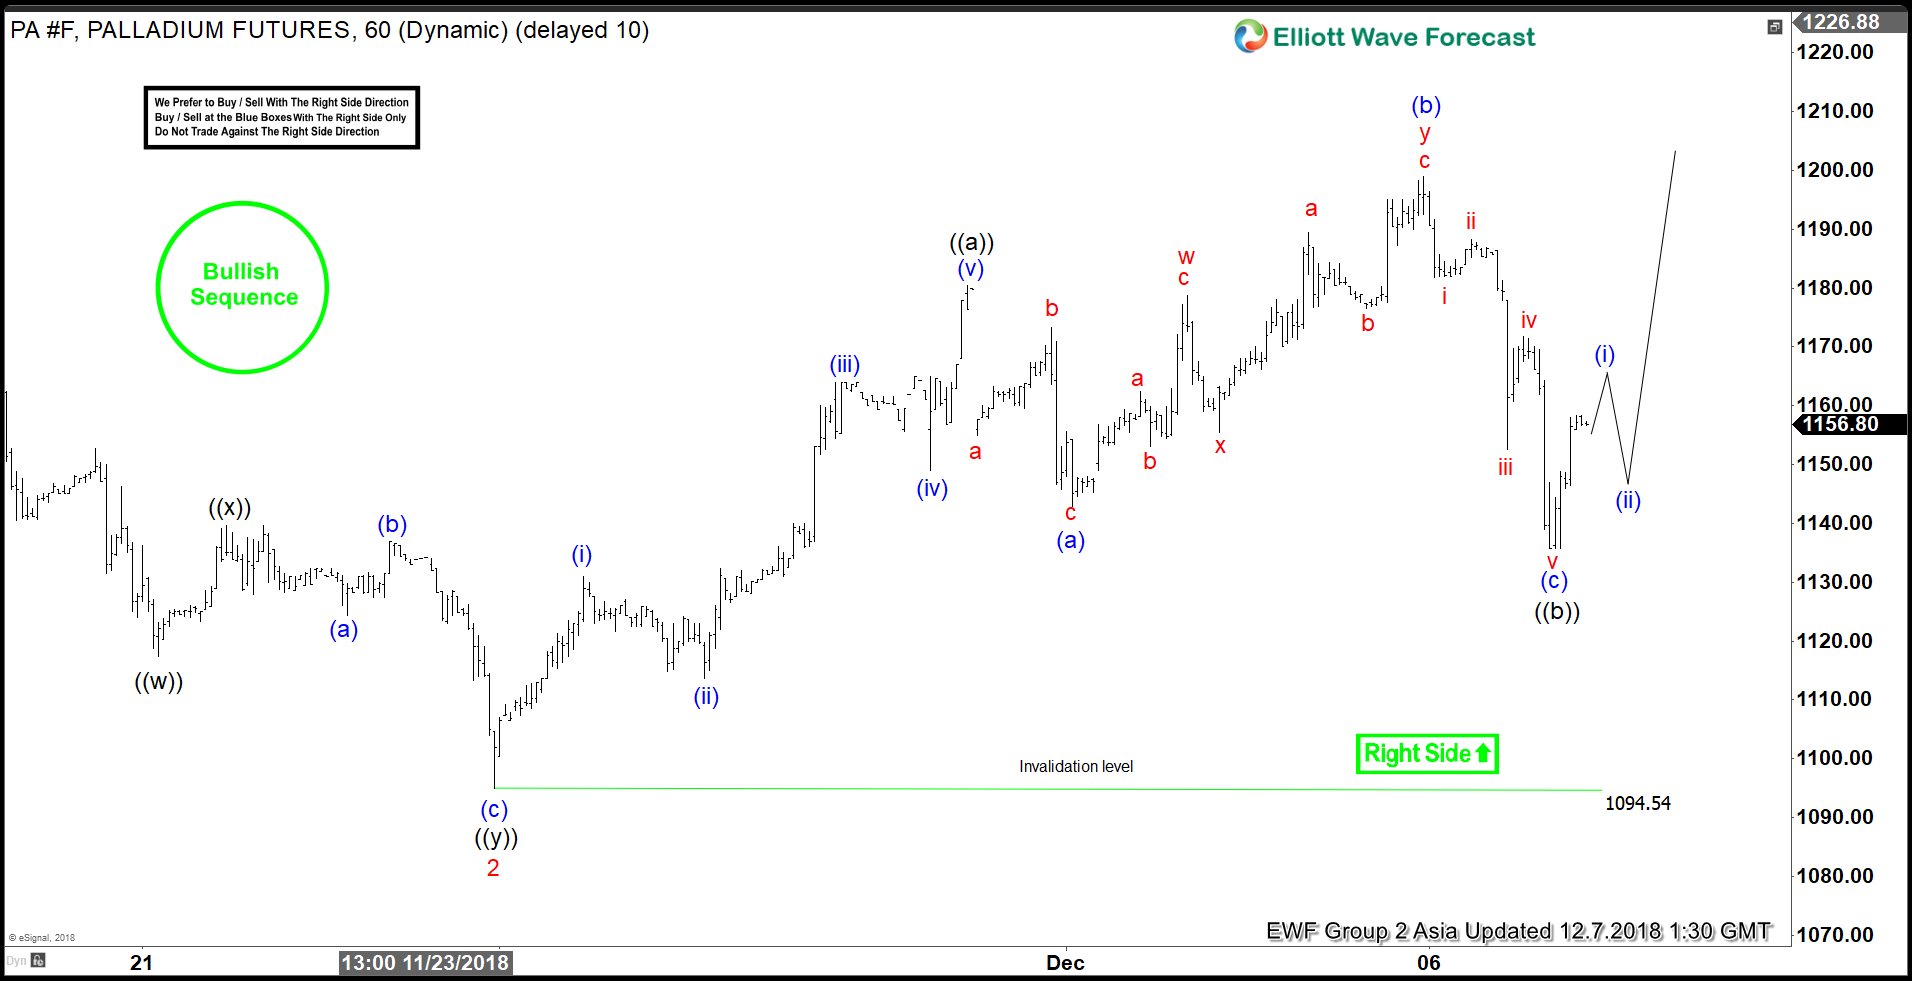
Below, you can see the 1-hour updated chart posted on the 12/07/18 with our Elliot count perspective at the time. We expected prices to extend higher due to the 11/16 high broken on 11/29, hence our bullish sequence stamp. Under our method, we encourage our members to trade with the right side of the market after a 3,7, or 11 swing dip. Usually, said dip, corrects the latest completed bullish cycle. With this in mind, after a FLAT correction (a 3 swing dip) of the cycle from 11/23 to wave ((a)), we expected a bullish reaction. As long as the invalidation level (1094.54) was kept intact, and the dip reached anywhere within the 1-1.618 Fibonacci extension area of blue (a) & (b), we expected buyers for further upside.
Palladium 12.07.2018 1 Hour Chart Elliott Wave Analysis
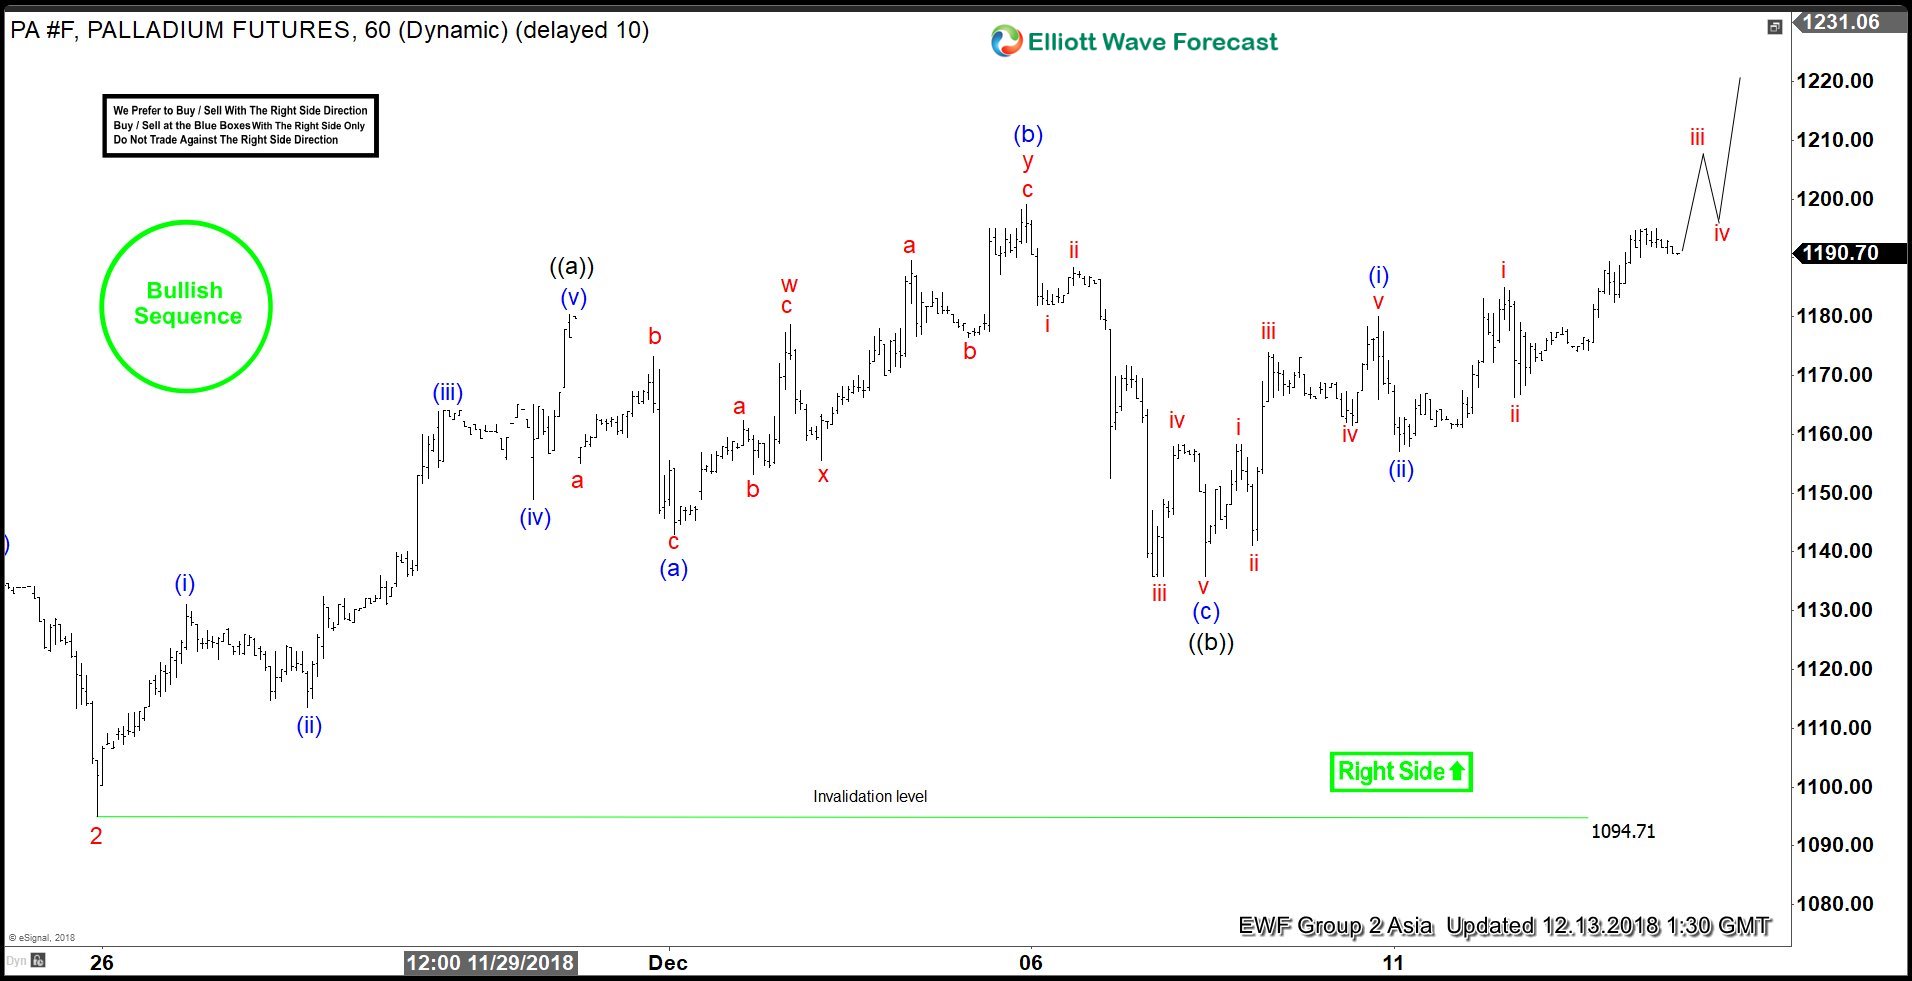
Notice what happens when the metal reaches the expected reaction area of (1150-1120). Palladium makes a great bounce and starts extending higher. A 5 wave impulse wave move towards new highs as long as the 1094.71 pivot holds.
Palladium 12.13.2018 1 Hour Chart Elliott Wave Analysis
*Note : Keep in mind the market is dynamic and the presented view might have changed after the post was published.
If you liked what you read or if you are interested on the Elliott Wave methodology and how it can work consistently with our bullish/bearish sequence method, become a member and join our community today. As always, new comers can always try us out for 14 days with our Trial Plan. And, for this month only, we are offering a 2 for 1 End of Year promotion.
Trading success is a journey and you will never be perfect at it, but you can always master your reaction to the market.
Back


