Corn Futures have been trade lower for the last couple of months so today we would take a look at how we called the decline in Corn Futures based on the initial decline from June 2019 being in 5 waves and incomplete sequence from October 2019 peak. Let’s take a look at the daily chart from beginning of March.
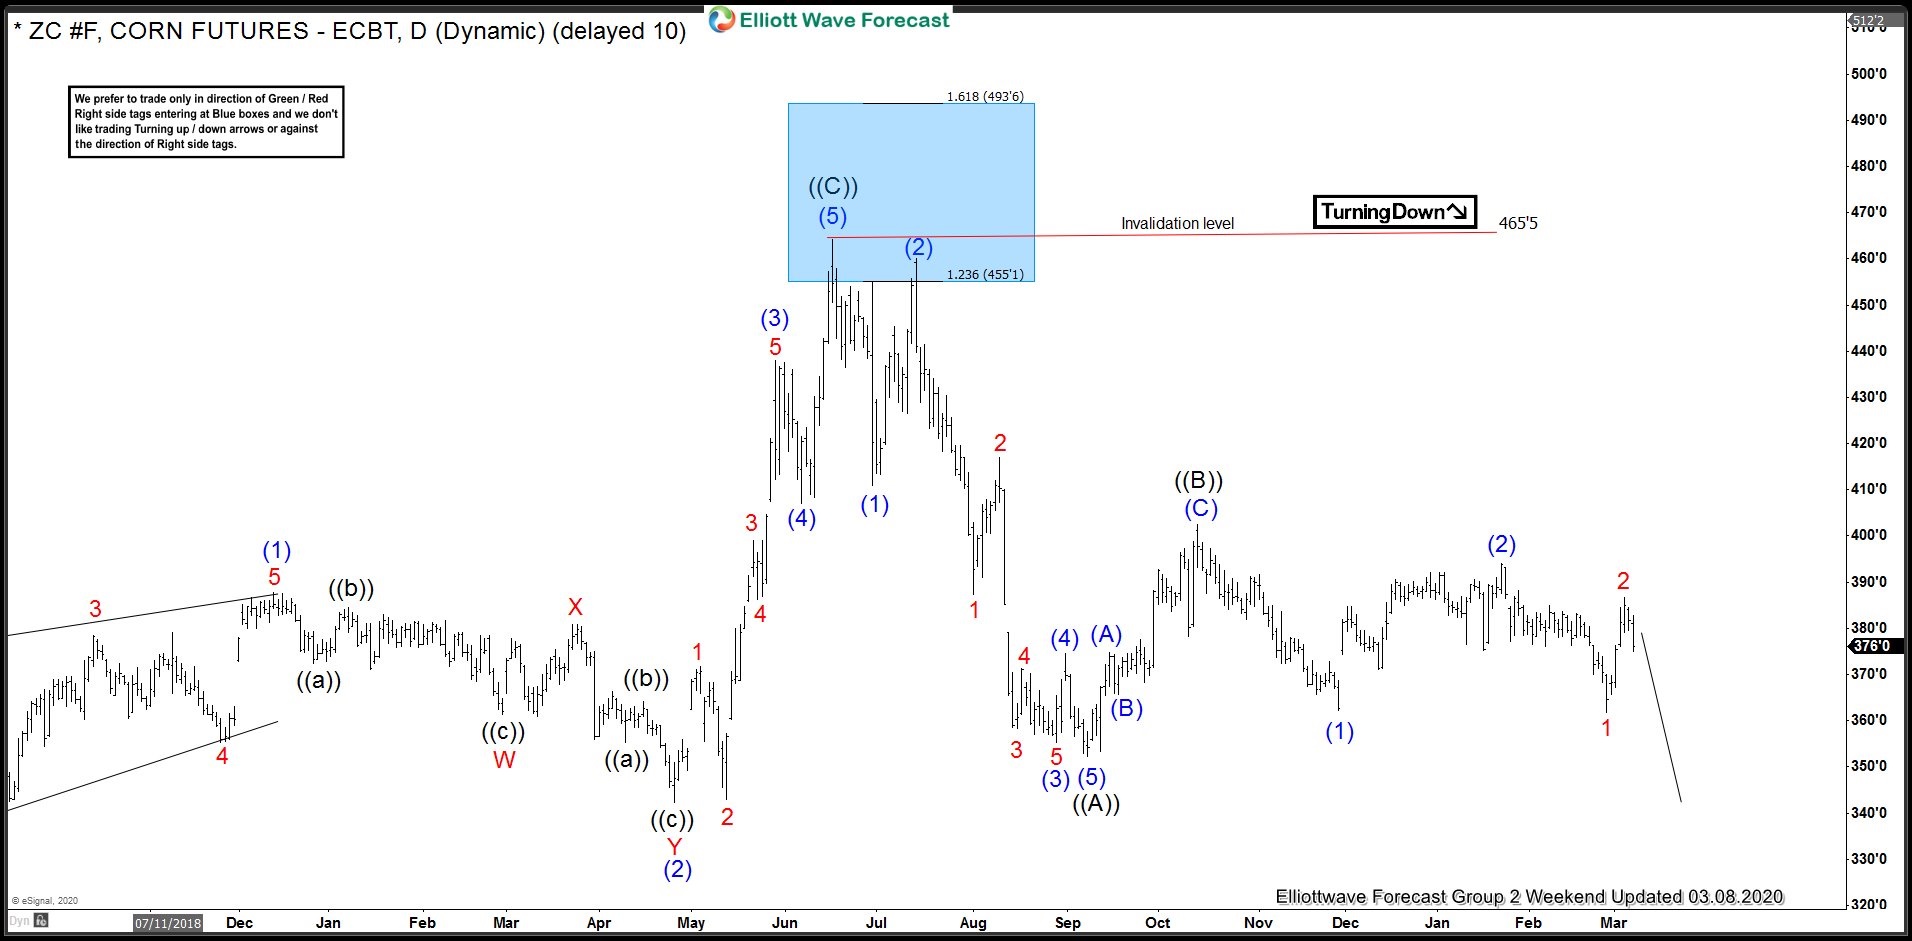
ZC_F (Corn Futures) Daily Elliott Wave Analysis 3.8.2020
Chart below shows initial decline from 465’5 peak was in 5 waves which we labelled as wave ((A)) or could have been wave ((1)) and bounce to 402’4 completed wave ((B)) or could have been wave ((2)). This was followed by a decline to 362’2 that we labelled as wave (1) and bounce to 394’0 was labelled as wave (2). After this, Corn Futures broke below 362’2 low and rallied sharply and though at one stage it did look like they could do a FLAT in wave (2) but the rally from 361’6 was left in 3 waves and moment cycle from 361’6 low ended, we started calling the decline in wave 3 of (3) down from wave ((B)) or ((2)) peak.
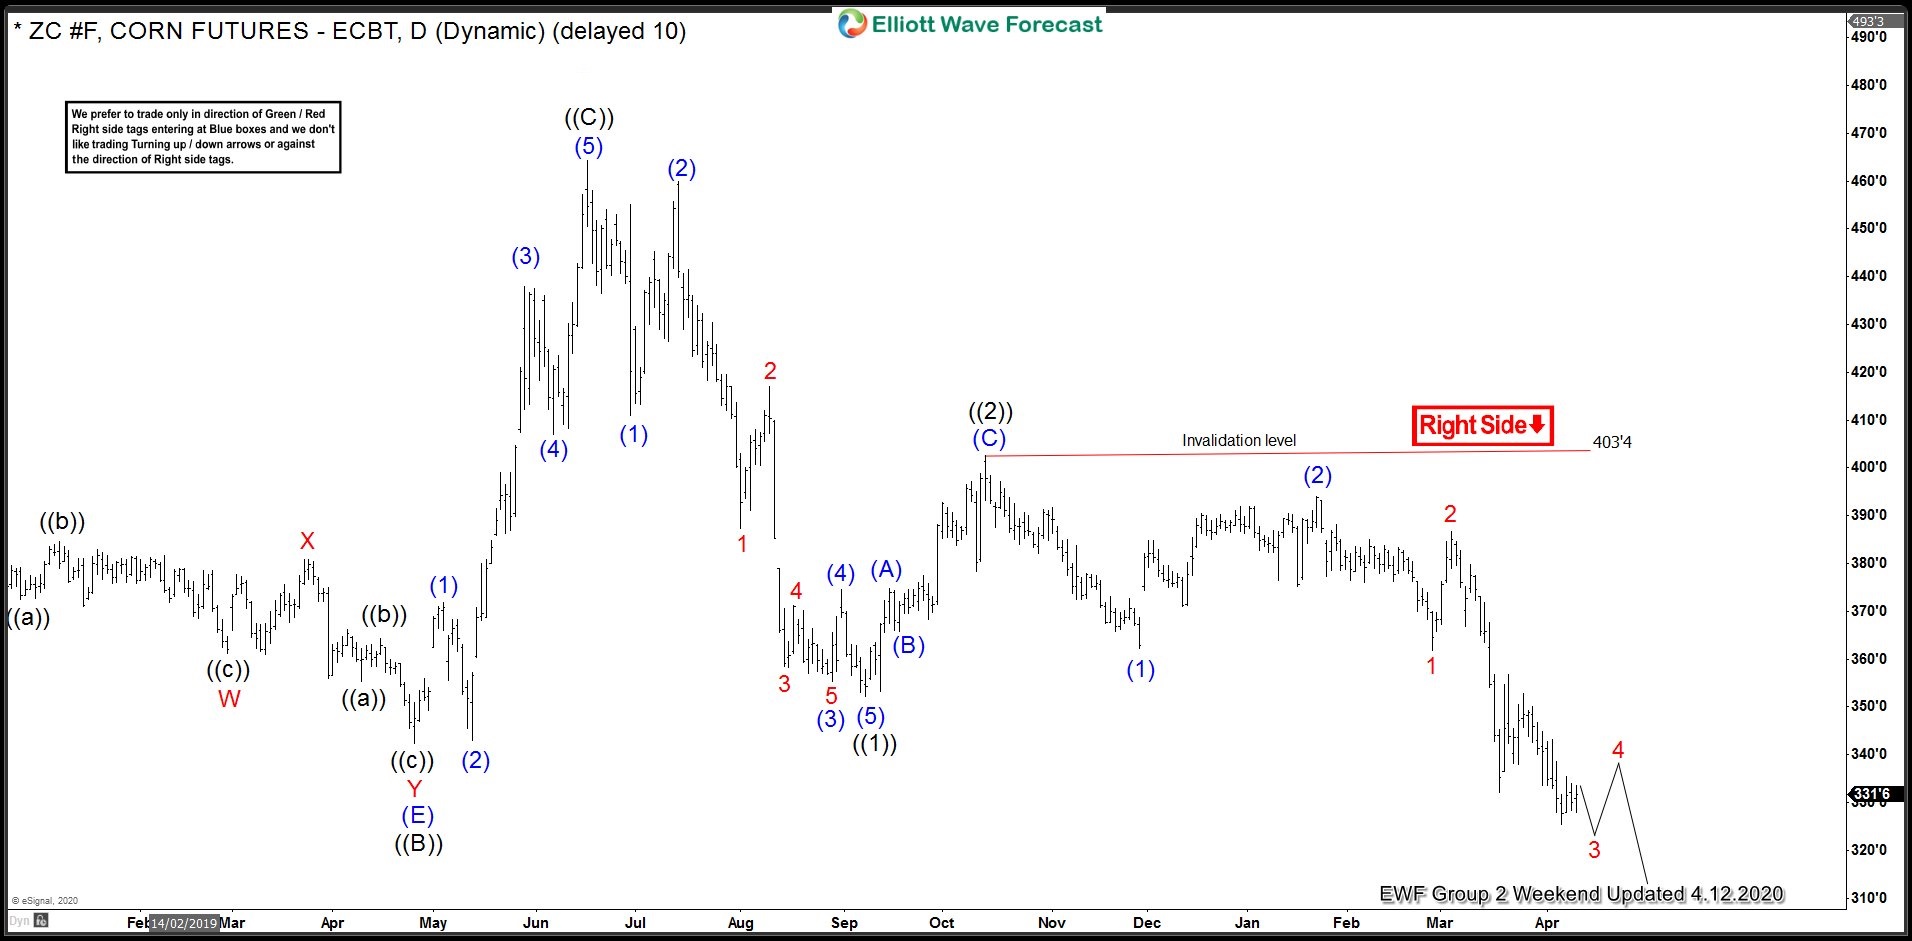
ZC_F (Corn Futures) Daily Elliott Wave Analysis 4.12.2020
Chart below shows, decline extended as expected, we have already seen a break of wave ((1)) low that we were previously labelling as wave ((A)) and we are still within wave 3 of (3) which means cycle from 403’4 peak is incomplete and we should see more downside. Bounces are expected to fail in 3, 7 or 11 swings for extension lower to complete 5 waves decline from 403’4 peak.
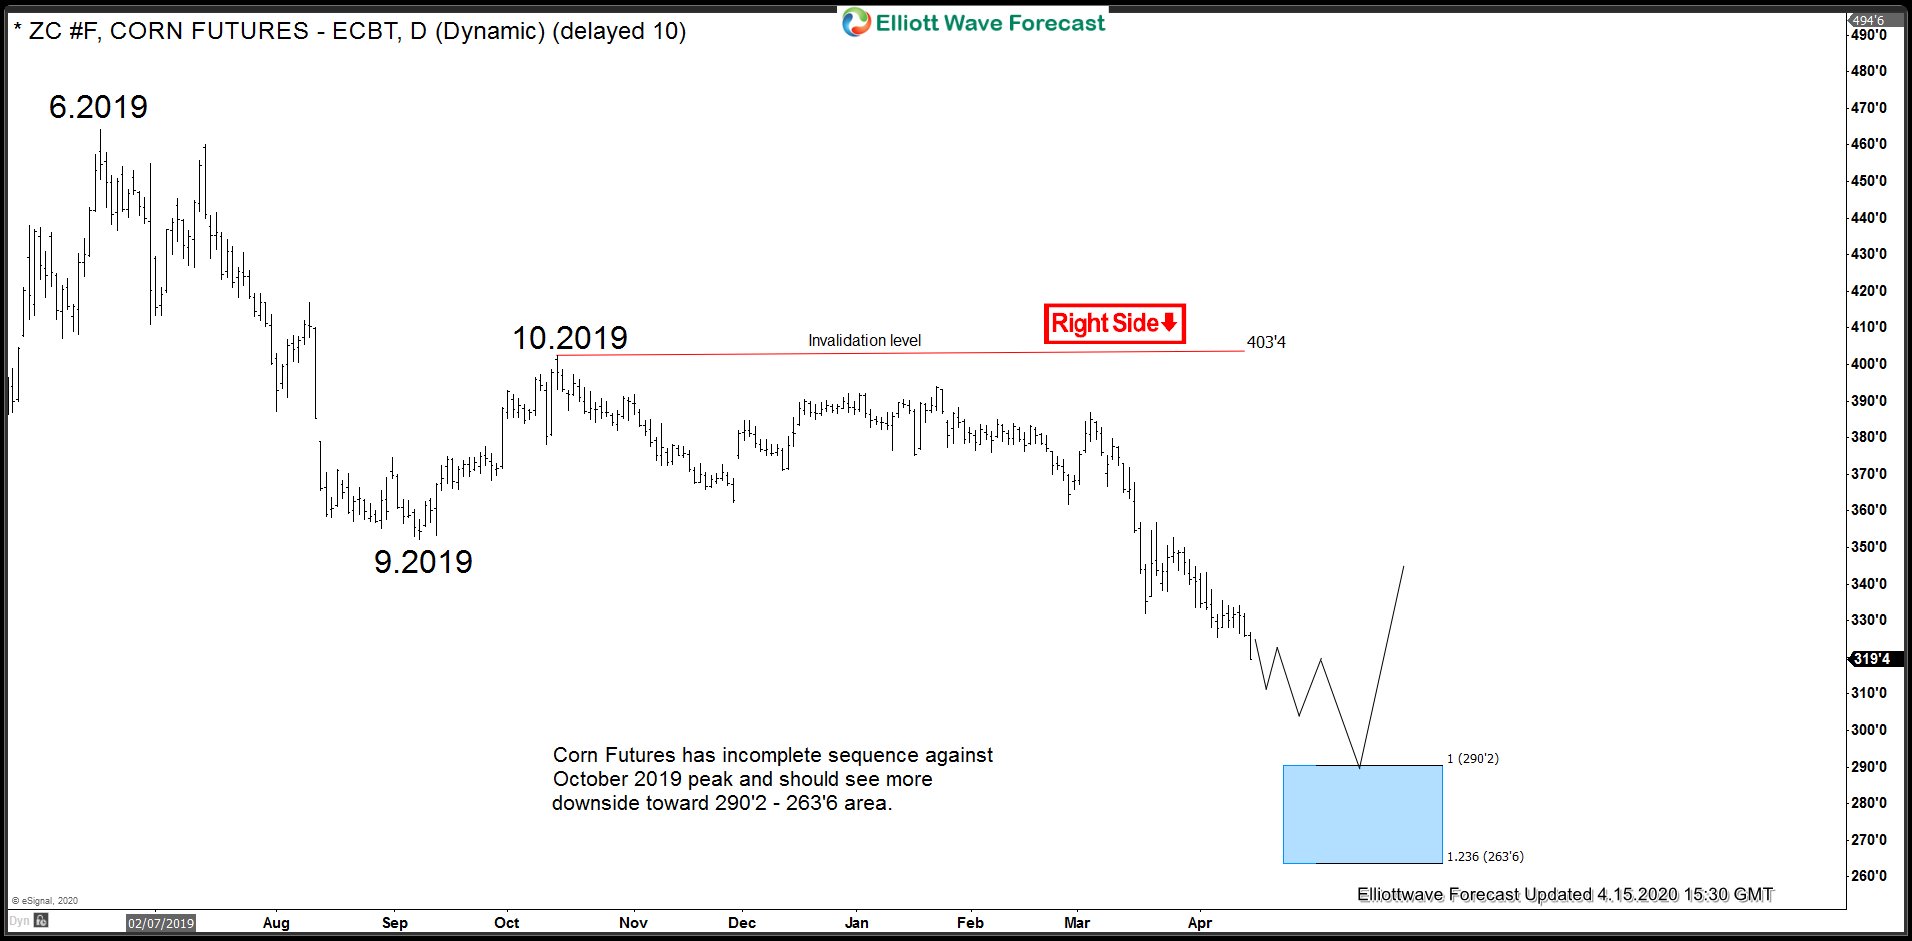
ZC_F (Corn Futures) Incomplete Elliott Wave Sequence from June 2019
Break of September 2019 low creates an incomplete bearish sequence against October 2019 peak and now the bounces are expected to fail in 3, 7 or 11 swings for more downside toward 290’2 – 263’6 area at least where we can expect a cycle from 10.2019 peak to end. If 263’6 level is exceeded, then next level of interest would be 161.8% Fibonacci extension at 220’6. 
Back


