
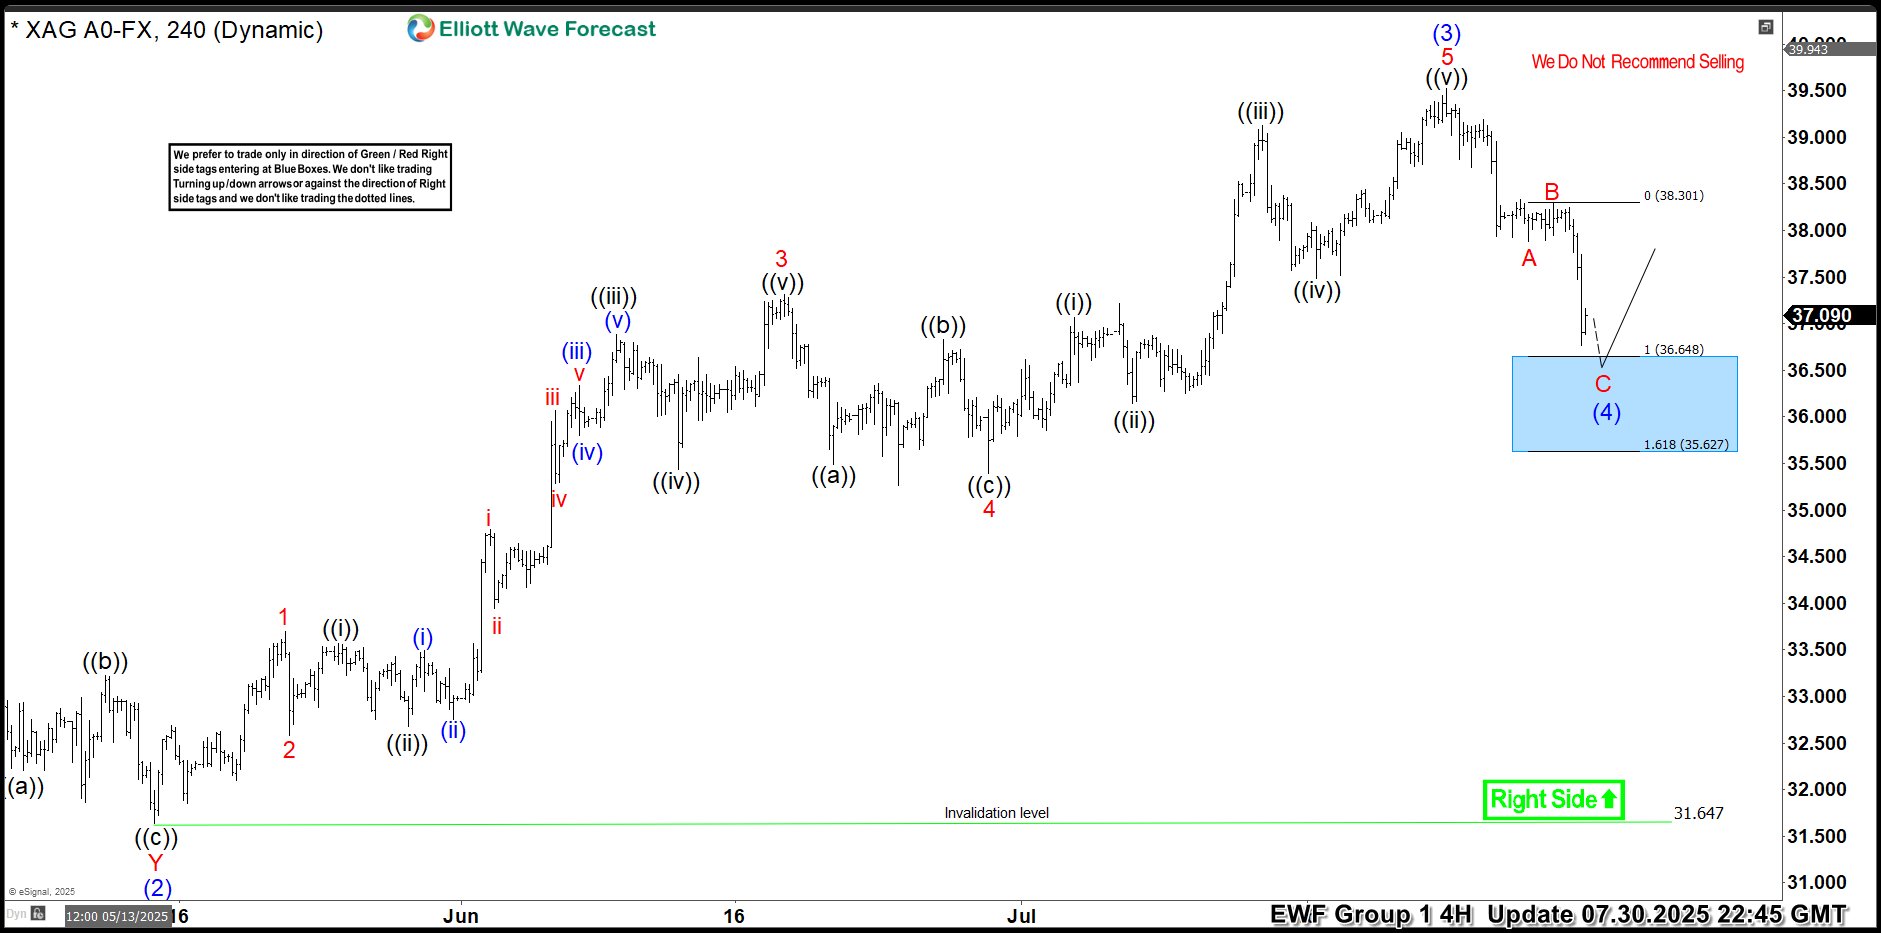
Hello traders. As our members know, we have had many profitable trading setups recently. In this technical article, we are going to talk about another Elliott Wave trading setup we got in Silver (XAGUSD). The commodity has completed its correction exactly at the Equal Legs zone, also known as the Blue Box Area. In this […]
-
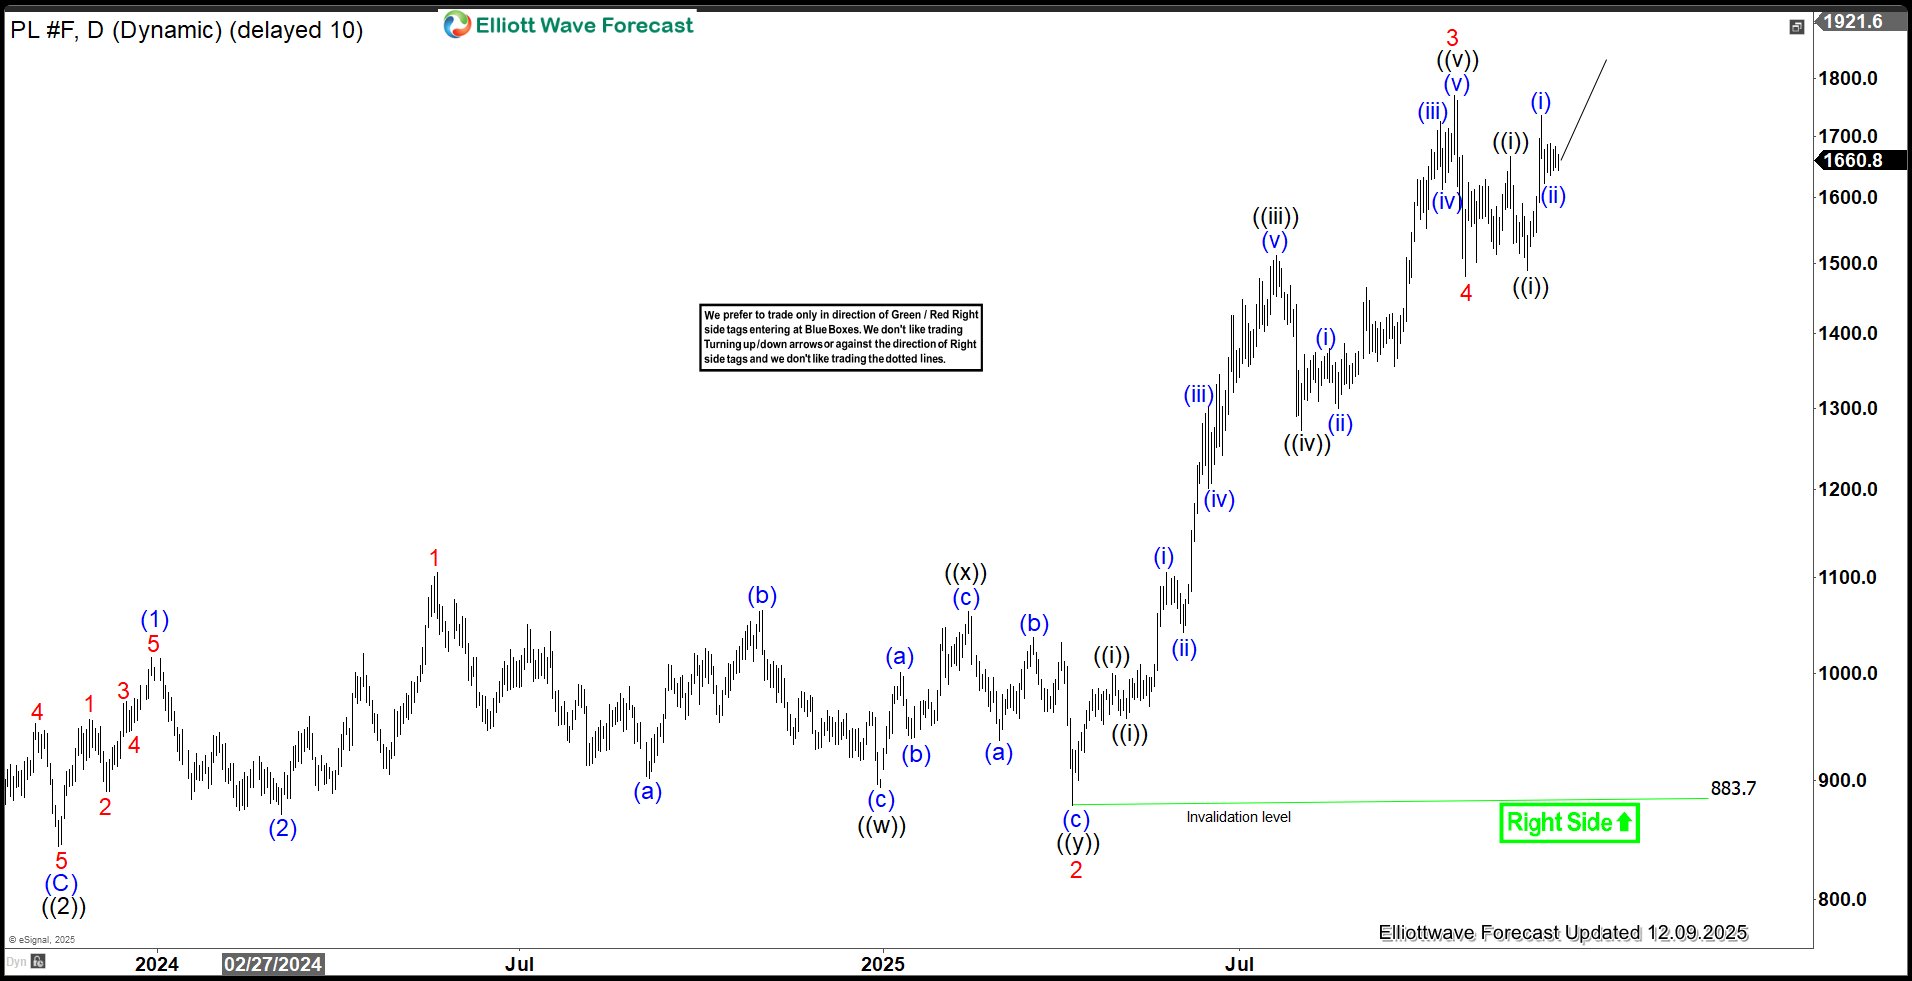
Strong Nesting Impulse Drives Platinum (PL) Higher
Read MorePlatinum (PL) has developed a strong five‑wave nesting impulse from the March 2020 low, reinforcing the view that the right side of the market remains higher. In this article, we present the latest long‑term Elliott Wave outlook. Platinum (PL) Monthly Elliott Wave Chart The monthly Platinum chart highlights a strong nesting impulse that began after […]
-
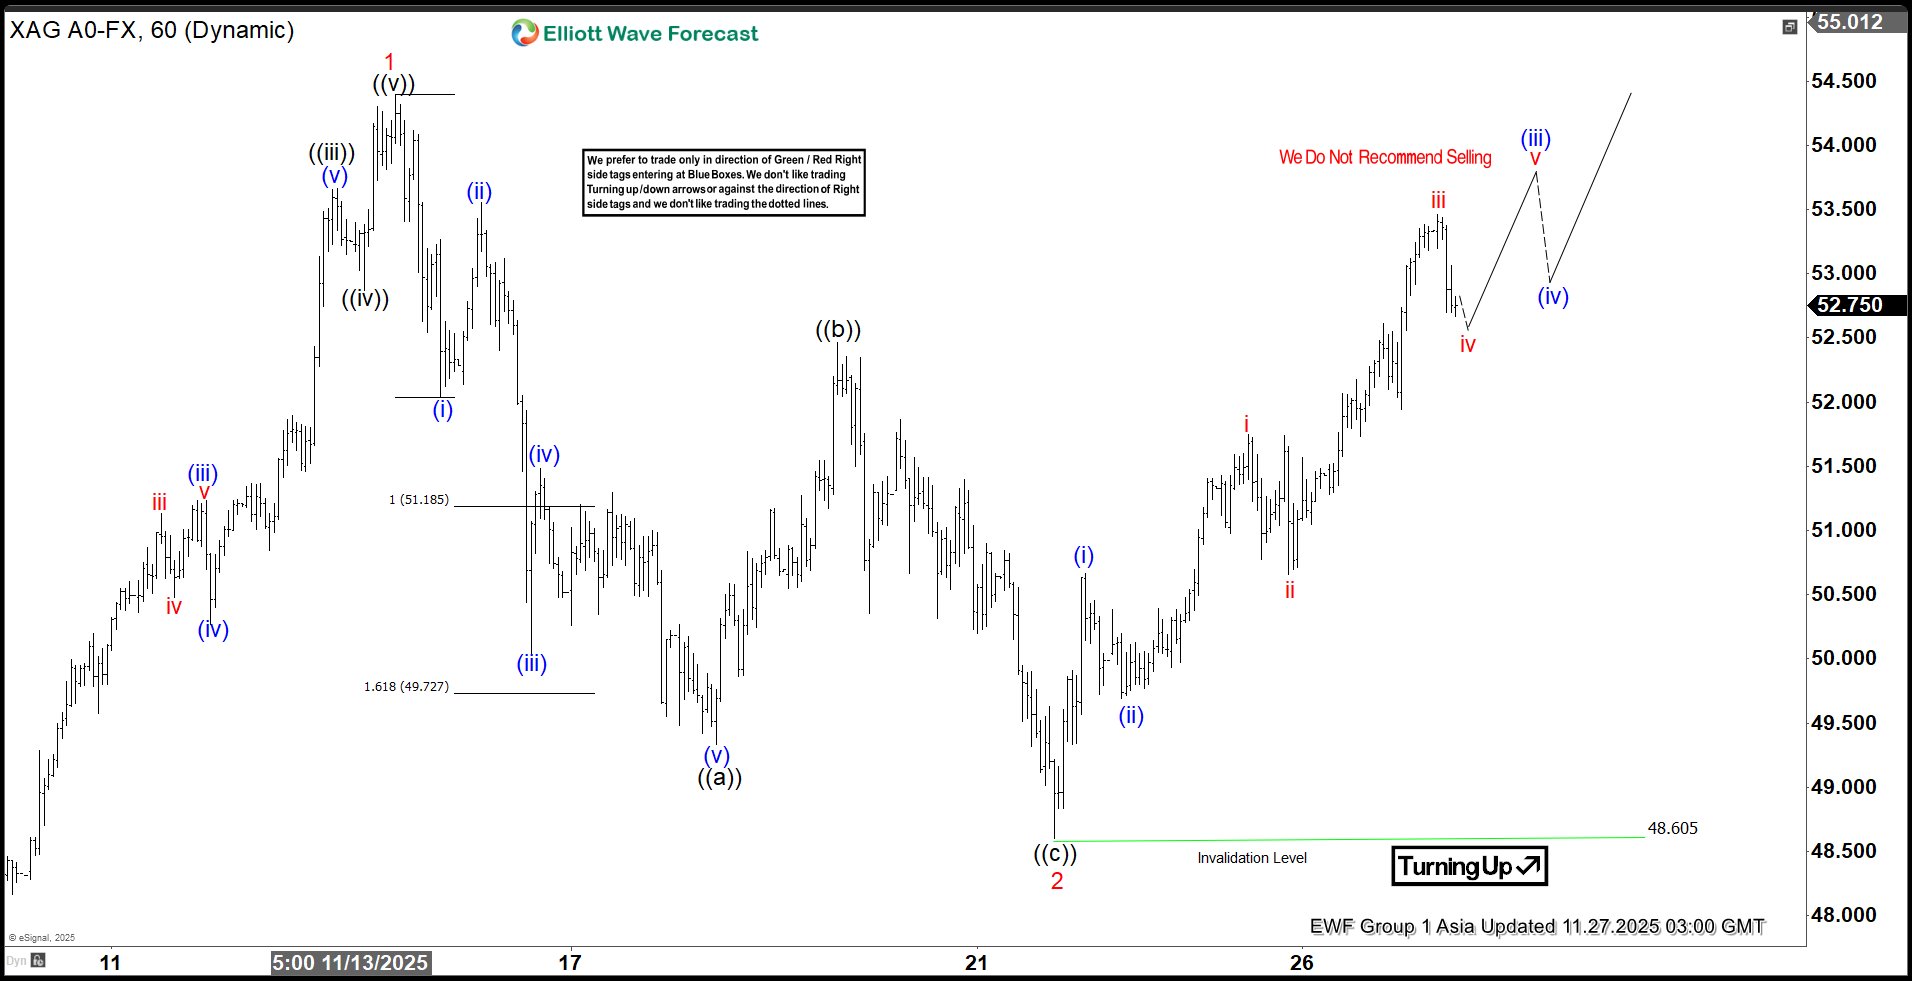
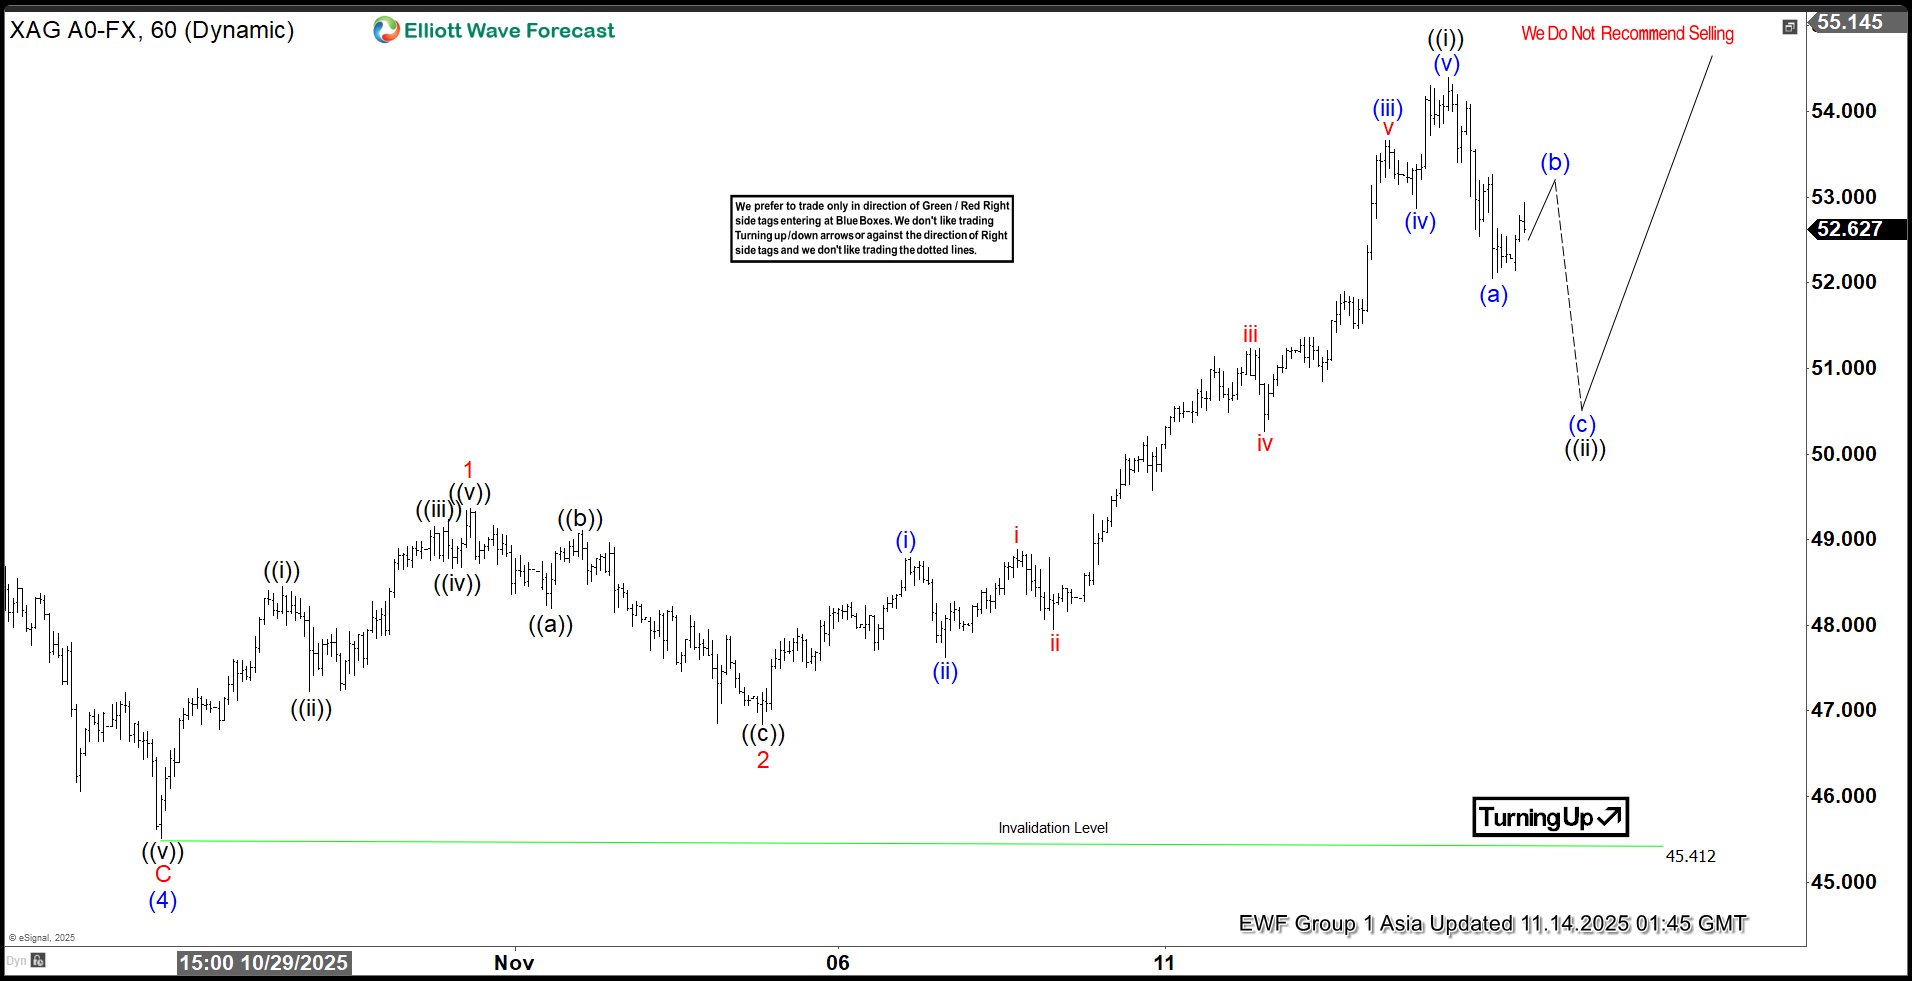
Silver (XAGUSD) Ongoing Impulsive Rally Points Toward Higher Extension
Read MoreThe rally in Silver from the 28 October low continues to unfold as a five‑wave impulse Elliott Wave sequence, though the structure remains incomplete. From that low, wave 1 advanced to 54.39, followed by a corrective pullback in wave 2 that concluded at 48.6. The metal then resumed its upward trajectory in wave 3, which […]
-
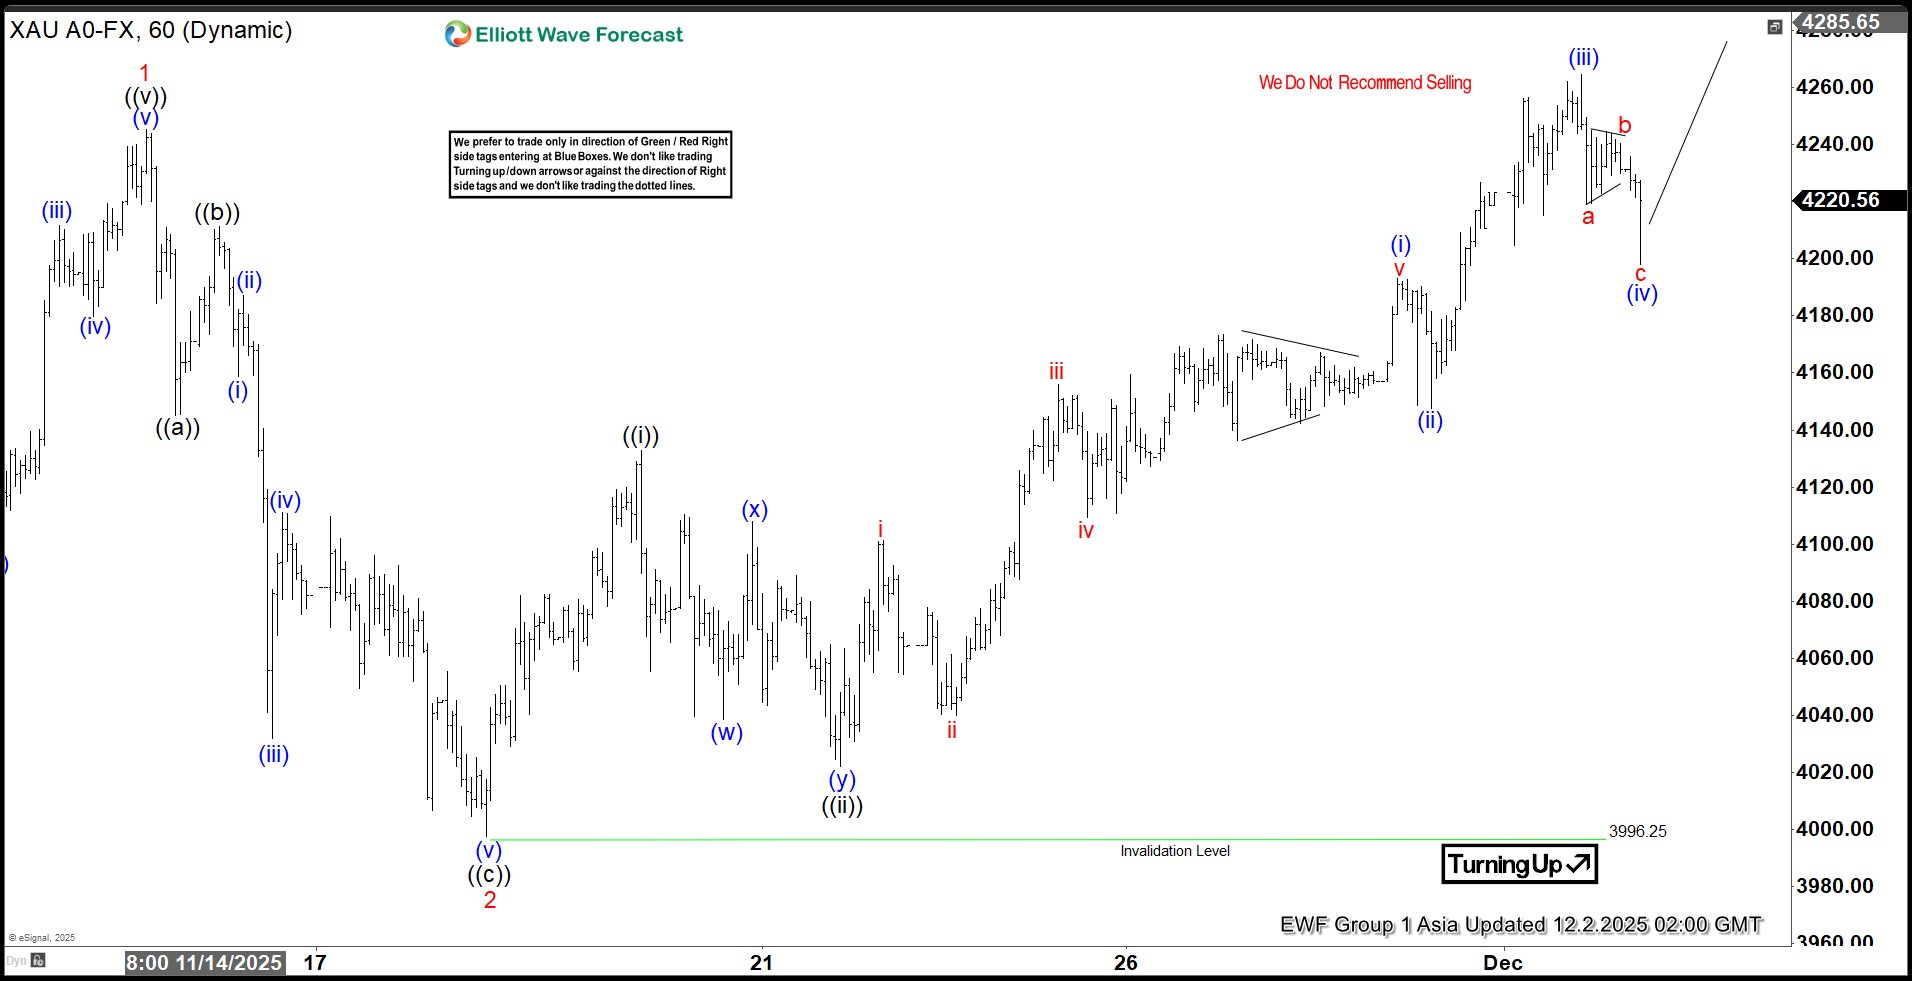
Gold (XAUUSD) Prices Poised to Break Higher, Targeting 4358
Read MoreGold (XAUUSD) is looking to extend higher within wave 3 from Oct 28 low targeting 4358. This article and video look at the Elliott Wave path.
-
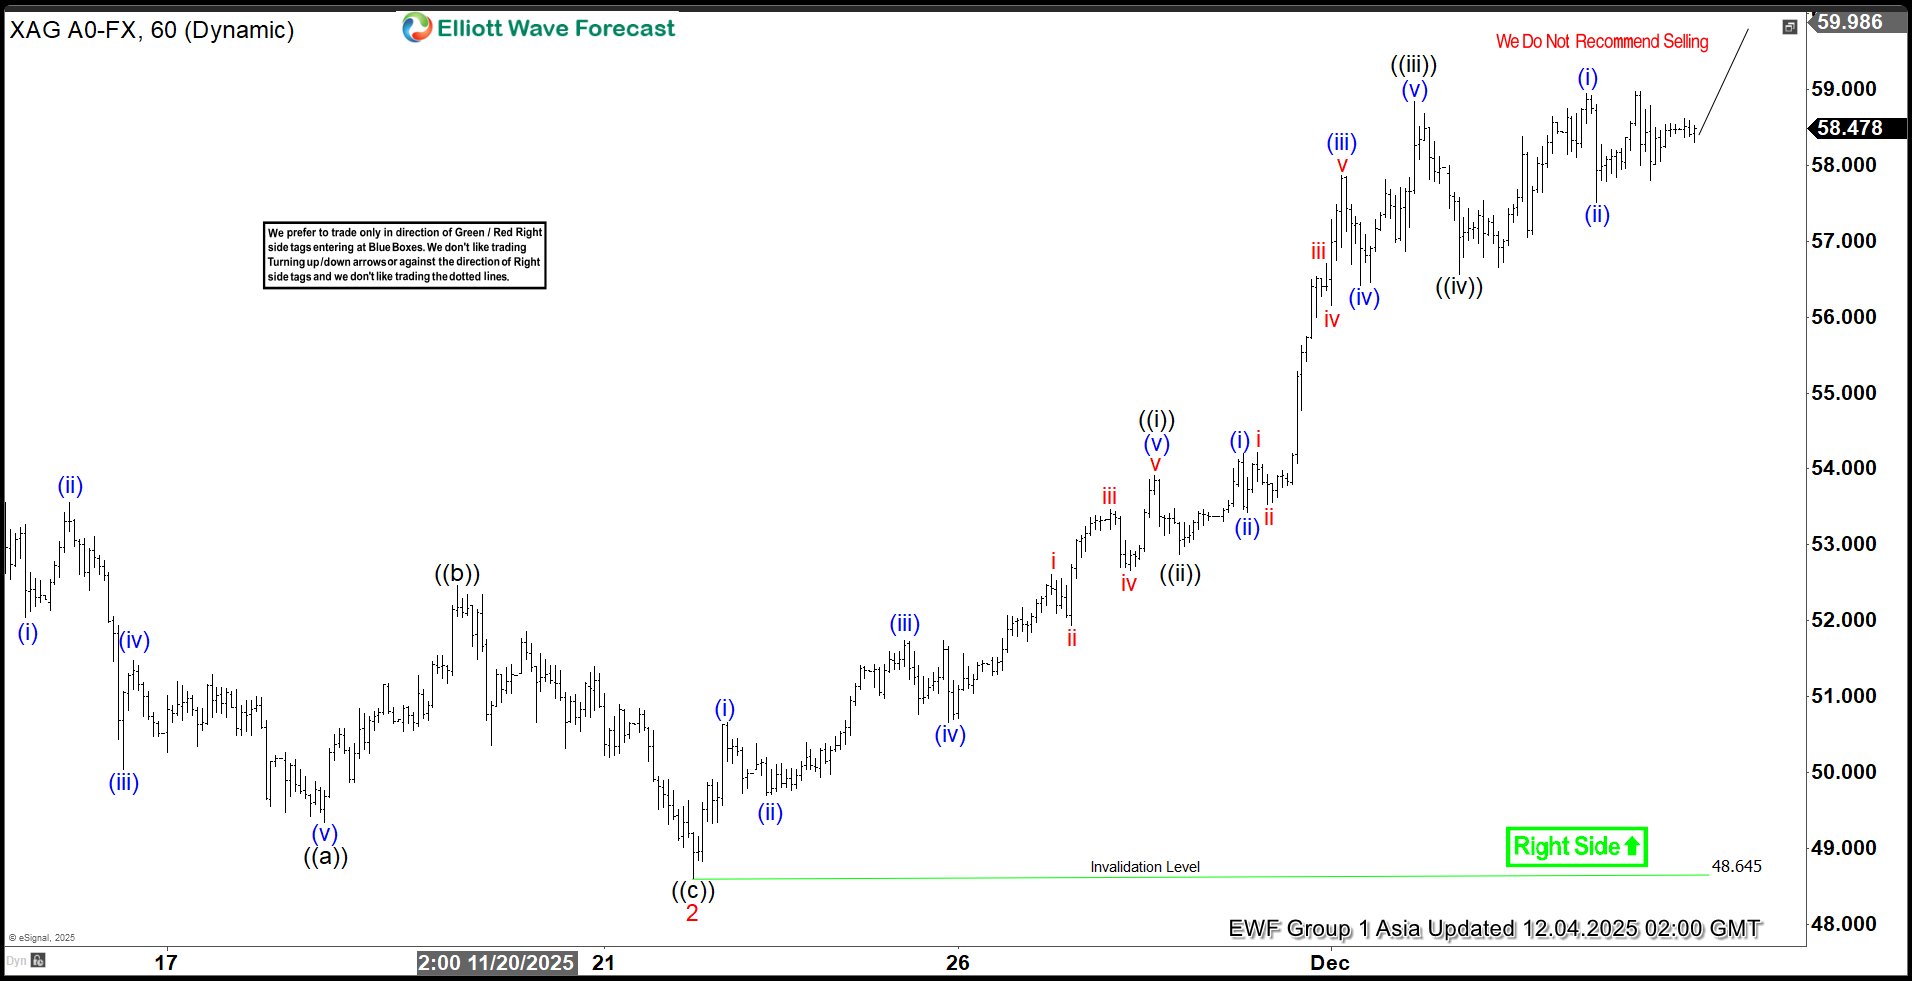
Spot Silver XAGUSD Aiming for All Time High, Targeting $57.4
Read MoreSpot Silver XAGUSD aiming for all time highs targeting $57.4 area higher. This article and video look at the Elliott Wave path.
-
Elliott Wave Analysis: Spot Silver (XAGUSD) Targeting Fresh All-Time Highs
Read MoreSpot Silver (XAGUSD) is looking to rally to fresh all-time high after the sharp selloff. This article and video look at the Elliott Wave path.
-

From Bounce to Barrier: Oil Path to the Next Sell Zone
Read MoreIn this chart of the day: we have looked at the OIL putting up a nice bounce higher & could provide the path to the next selling area.