

The Power of 3-7-11 and the Grand Super Cycle: How We Saw the Bullish Turn in April 2025 Back on April 9, 2025, while World Indices were dropping sharply and global sentiment had turned overwhelmingly bearish, we published an article that challenged the fear-driven narrative. We explained why selling was not the right approach and […]
-
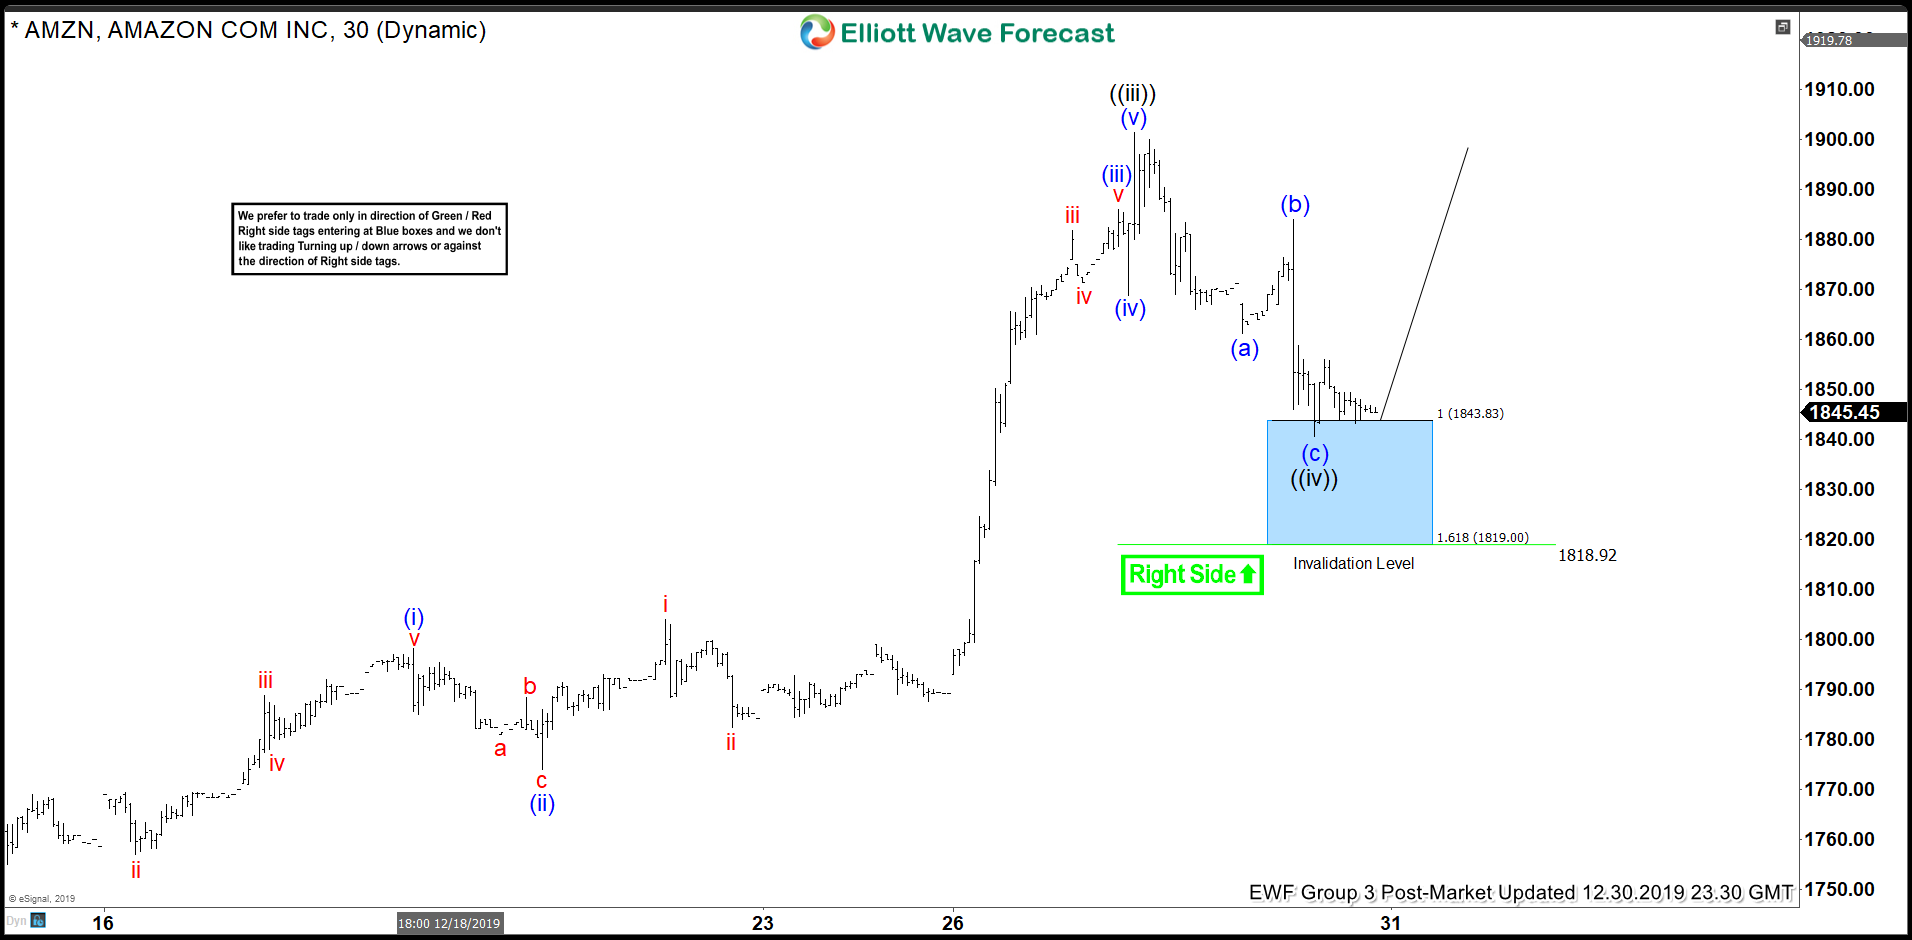
AMAZON ( $AMZN ) Buying The Dips At Blue Box Area
Read MoreHello fellow traders. In this technical blog we’re going to take a quick look at the Elliott Wave charts of AMAZON Stock published in members area of the Elliottwave-Forecast . As our members know, we were calling for further strength in AMAZON within the cycle from the October 25th low. We recommended members to avoid […]
-

Elliott Wave View: Dow Jones Future ($YM_F) Bullish Structure Likely Extends
Read MoreElliott Wave view on Dow Jones Futures ($YM_F) suggests that the rally from October 3, 2019 low is unfolding as an impulse Elliott Wave structure. In the 1 hour chart below, rally to 28893 ended wave (3) and pullback to 28084 ended wave (4). Index has resumed higher within wave (5). Up from 28084 low, wave […]
-
Using Market Correlation to Time The Entries
Read MoreLast year turned out to be great for GBP crosses as they managed to put in strong rallies in favor of GBP since December 2018 lows or highs. In this article, we would concentrate on two of the GBP crosses namely GBPAUD and GBPNZD because the rallies last year in these two instruments managed to […]
-
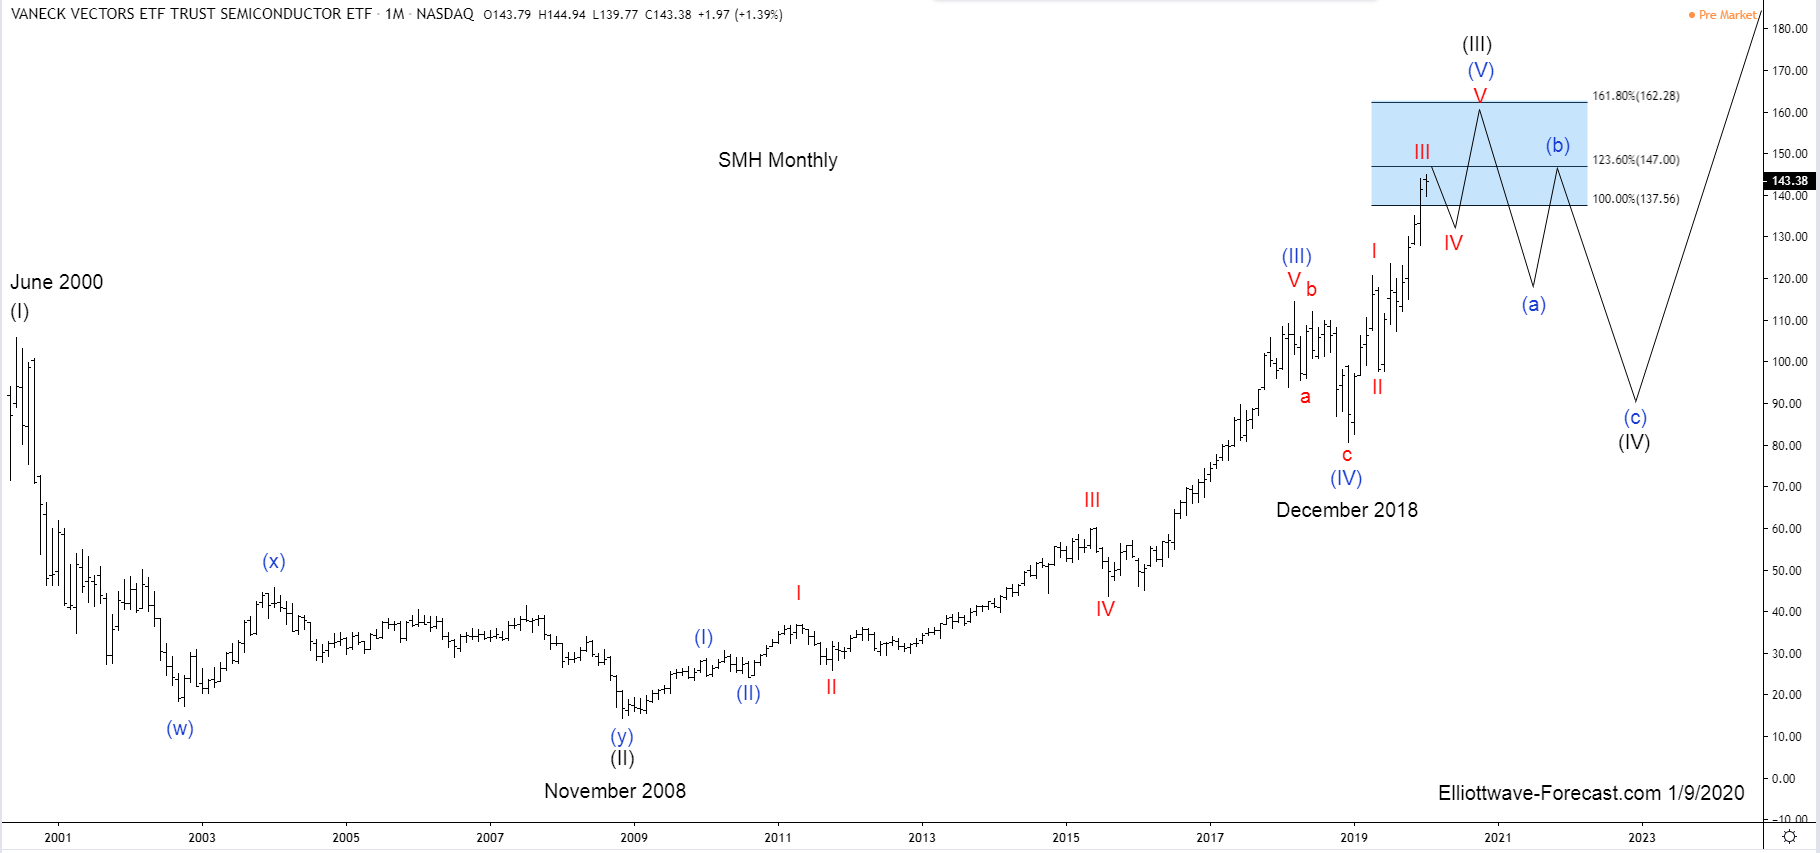
$SMH Elliott Wave and Longer Term Cycles
Read More$SMH Elliott Wave and Longer Term Cycles Firstly as seen on the monthly chart shown below. There is data back to May 2000 in the ETF fund. Data suggests the fund made a low in November 2008. This low has not been taken out in price. The cycles in this instrument tends to reflect the Nasdaq […]