
The Power of 3-7-11 and the Grand Super Cycle: How We Saw the Bullish Turn in April 2025 Back on April 9, 2025, while World Indices were dropping sharply and global sentiment had turned overwhelmingly bearish, we published an article that challenged the fear-driven narrative. We explained why selling was not the right approach and […]
-

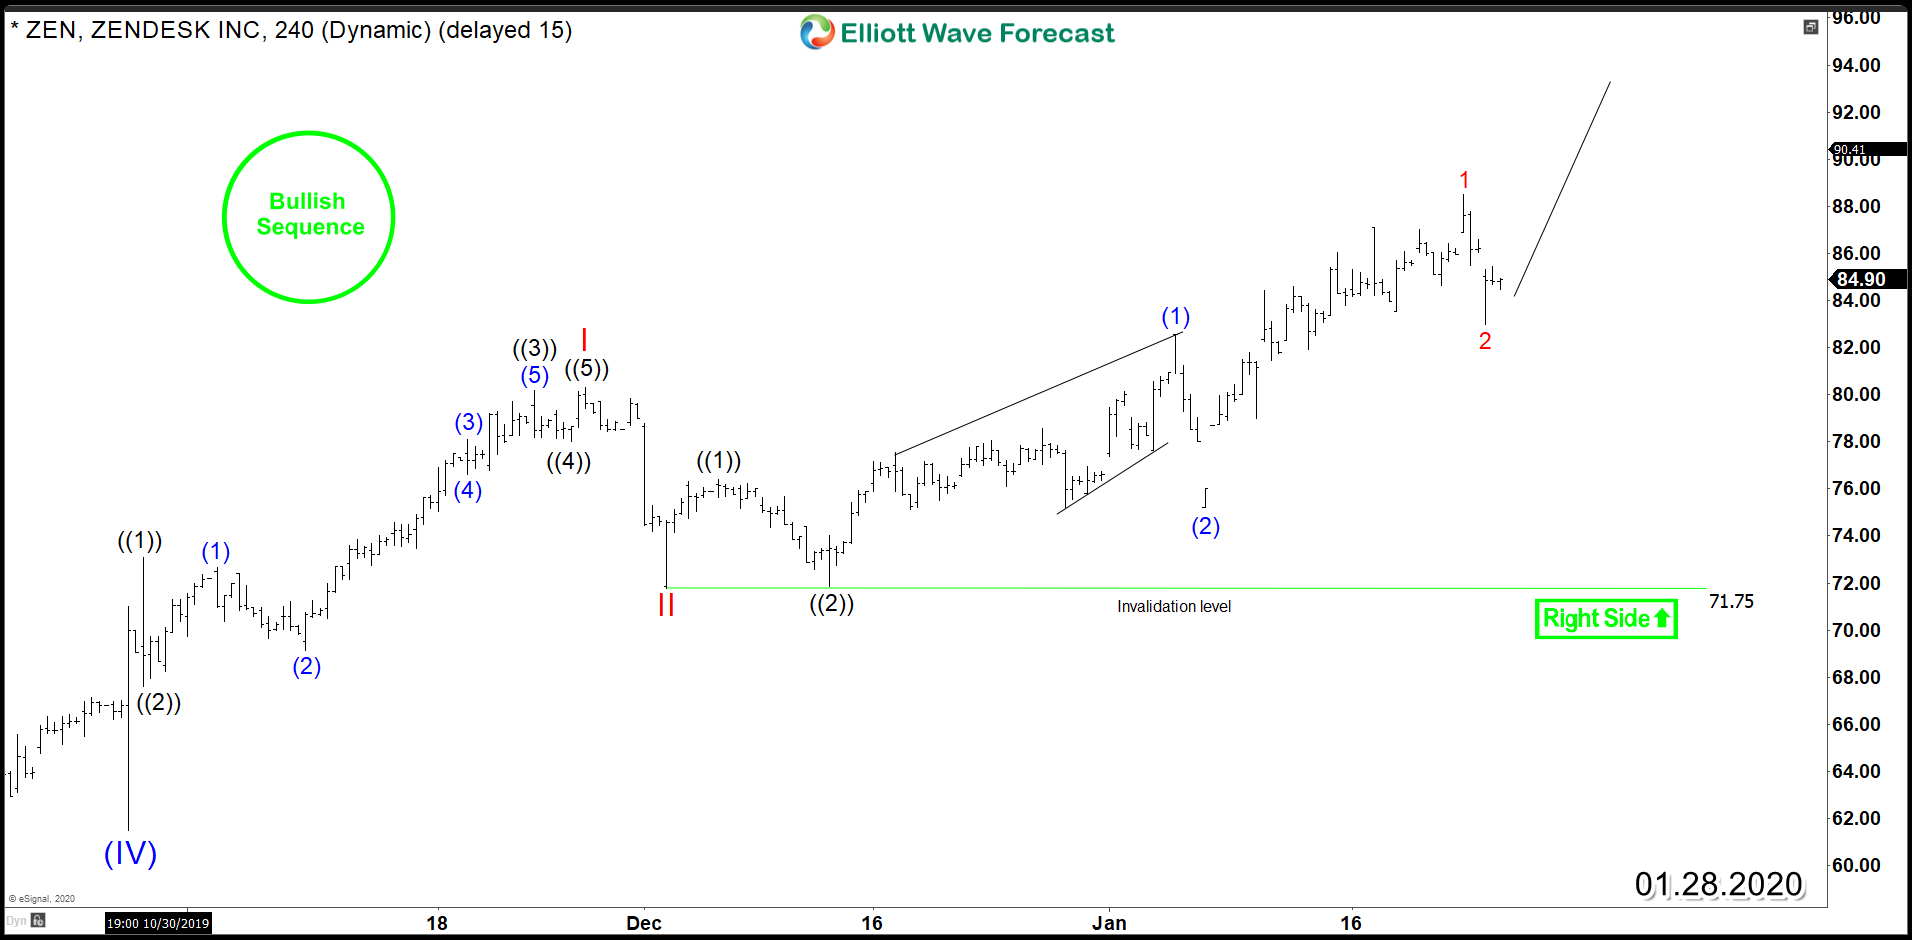
Zendesk (NYSE: ZEN) – Aiming for New All time Highs
Read MoreZendesk (NYSE: ZEN) bullish trend since IPO is still in progress despite the 30% correction which took place last year. The Bulls remained in Control as the stock ended a corrective 3 swing move lower then started a new rally since October 2019. Up from there, Zen is currently showing an incomplete bullish sequence suggesting further […]
-

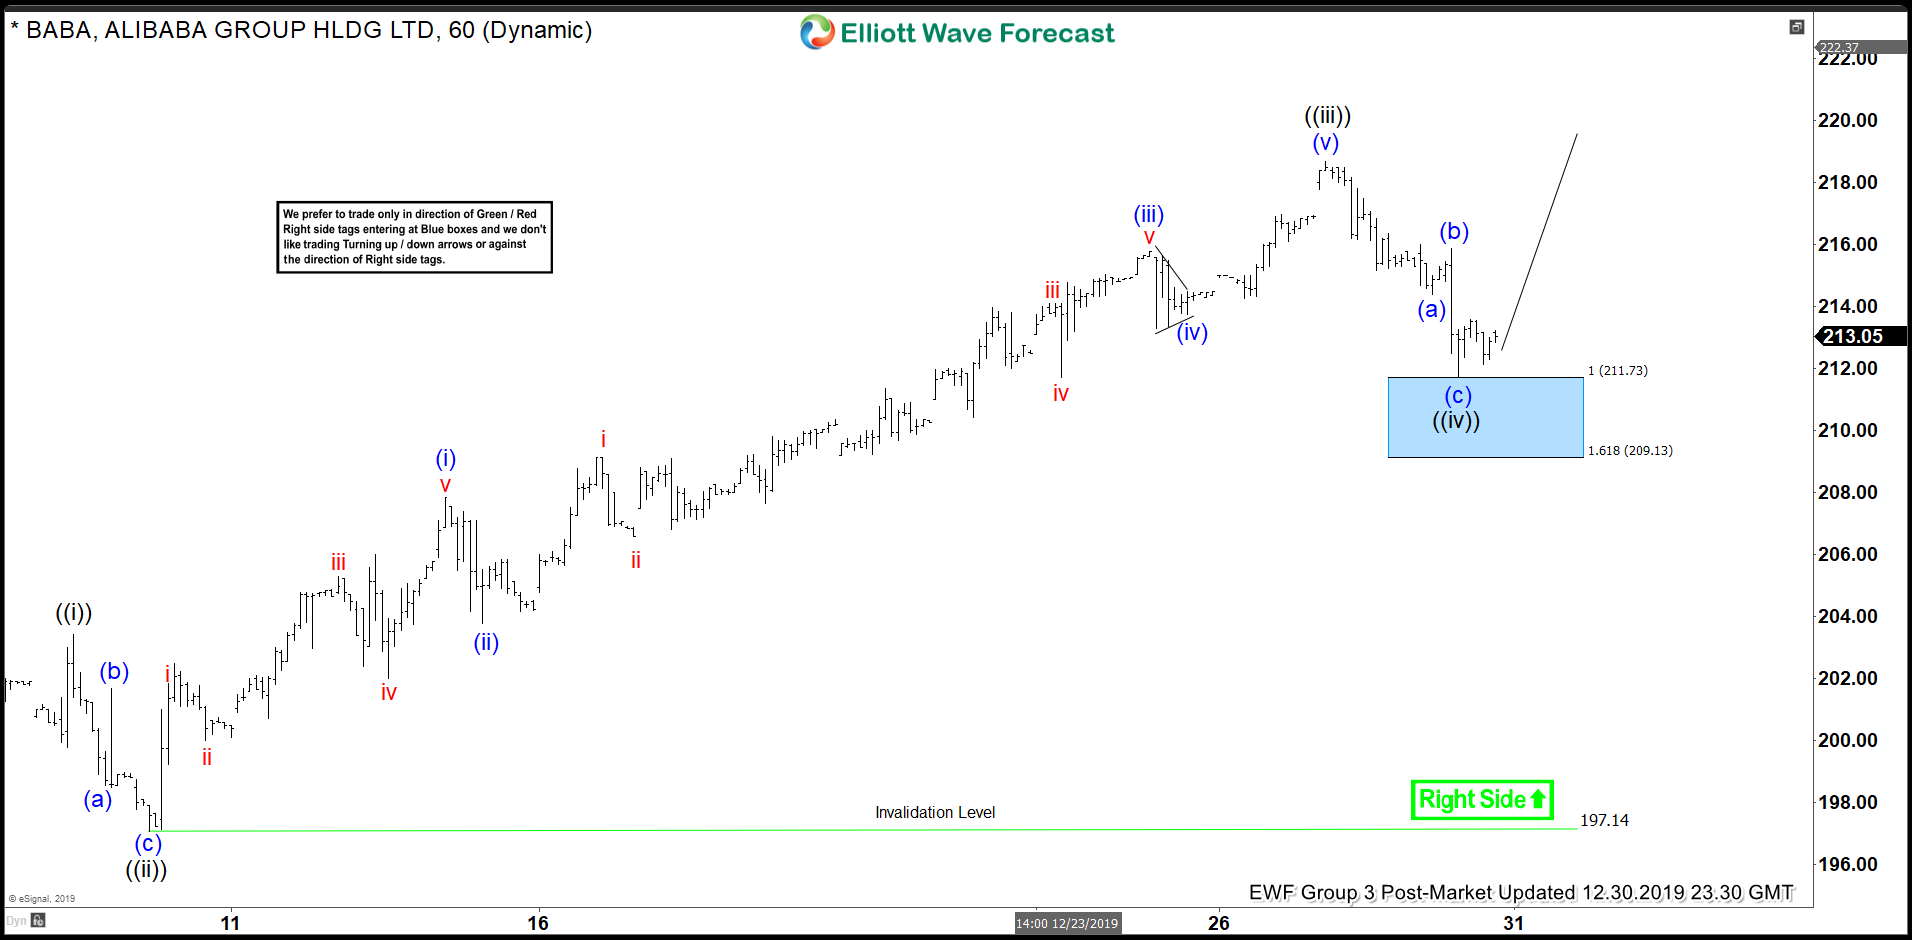
BABA Elliott Wave: Buying The Wave Four Pullback
Read MoreIn this blog, we take a look at the past performance of 1 hour Elliott Wave charts of BABA In which our members took advantage of the blue box areas.
-

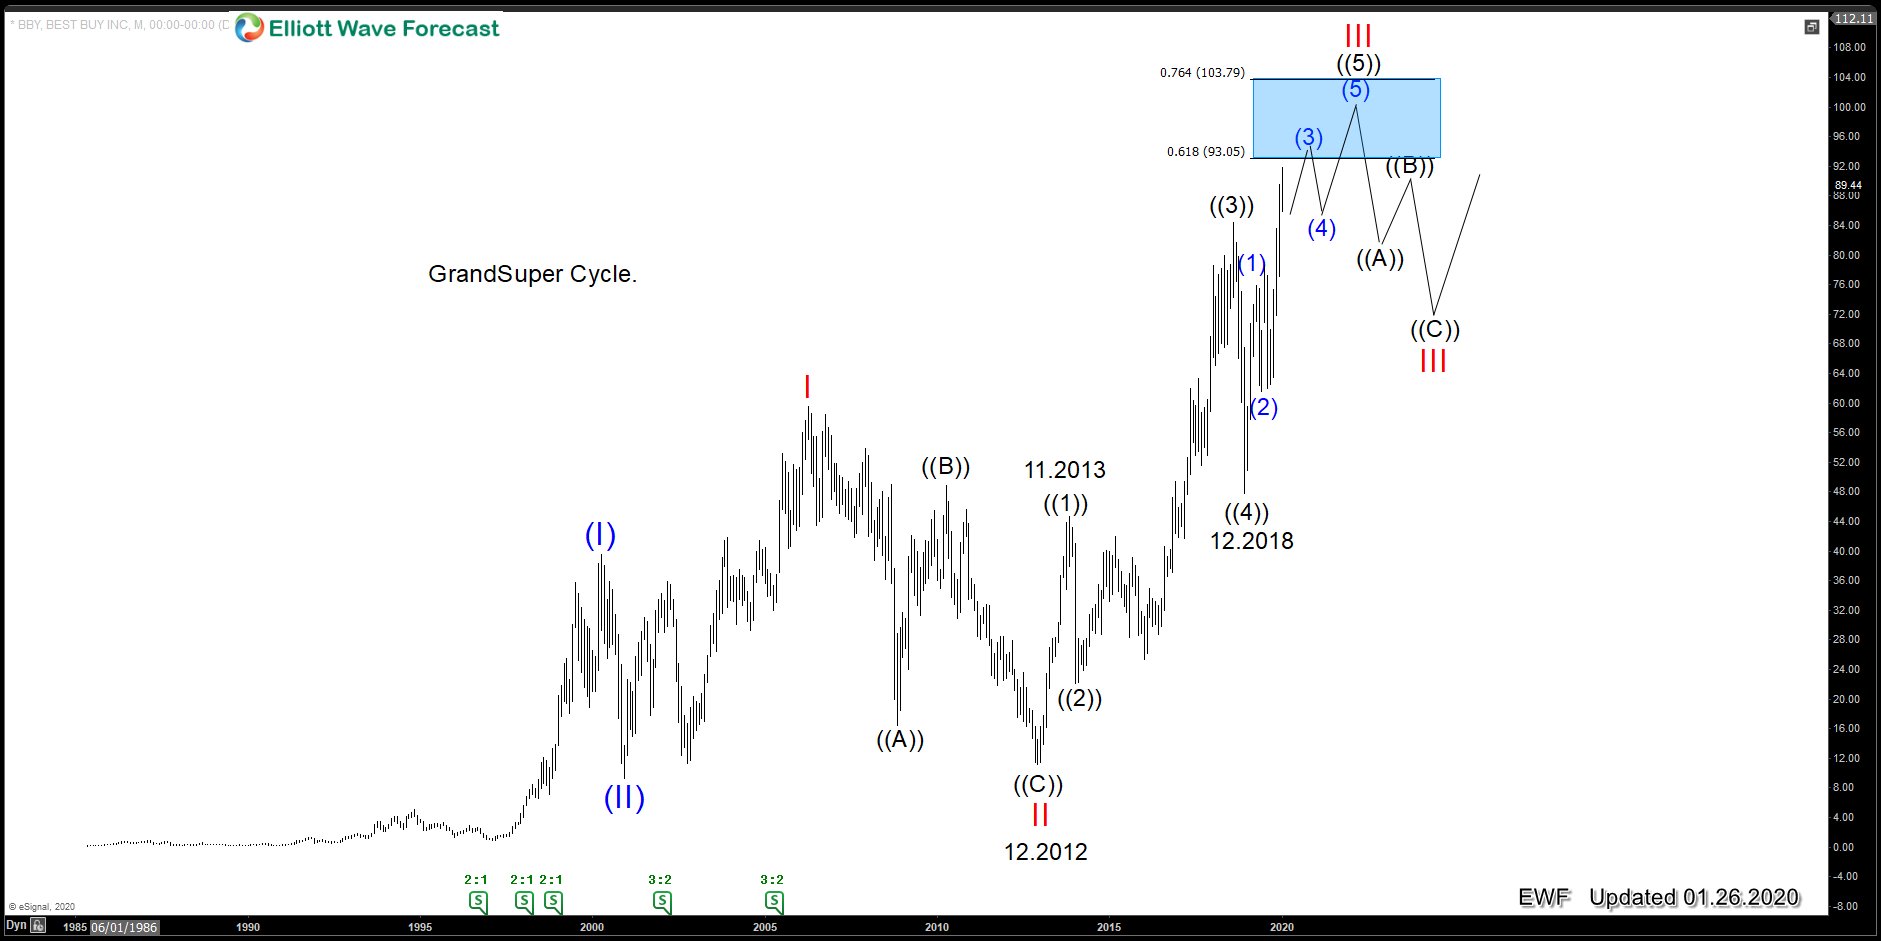
Best Buy (BBY): The Instrument is ending wave III of (III)
Read MoreBest Buy ( $BBY) is showing an incomplete cycle in the Grand Supercycle degree. This article explains the Elliott wave path.
-

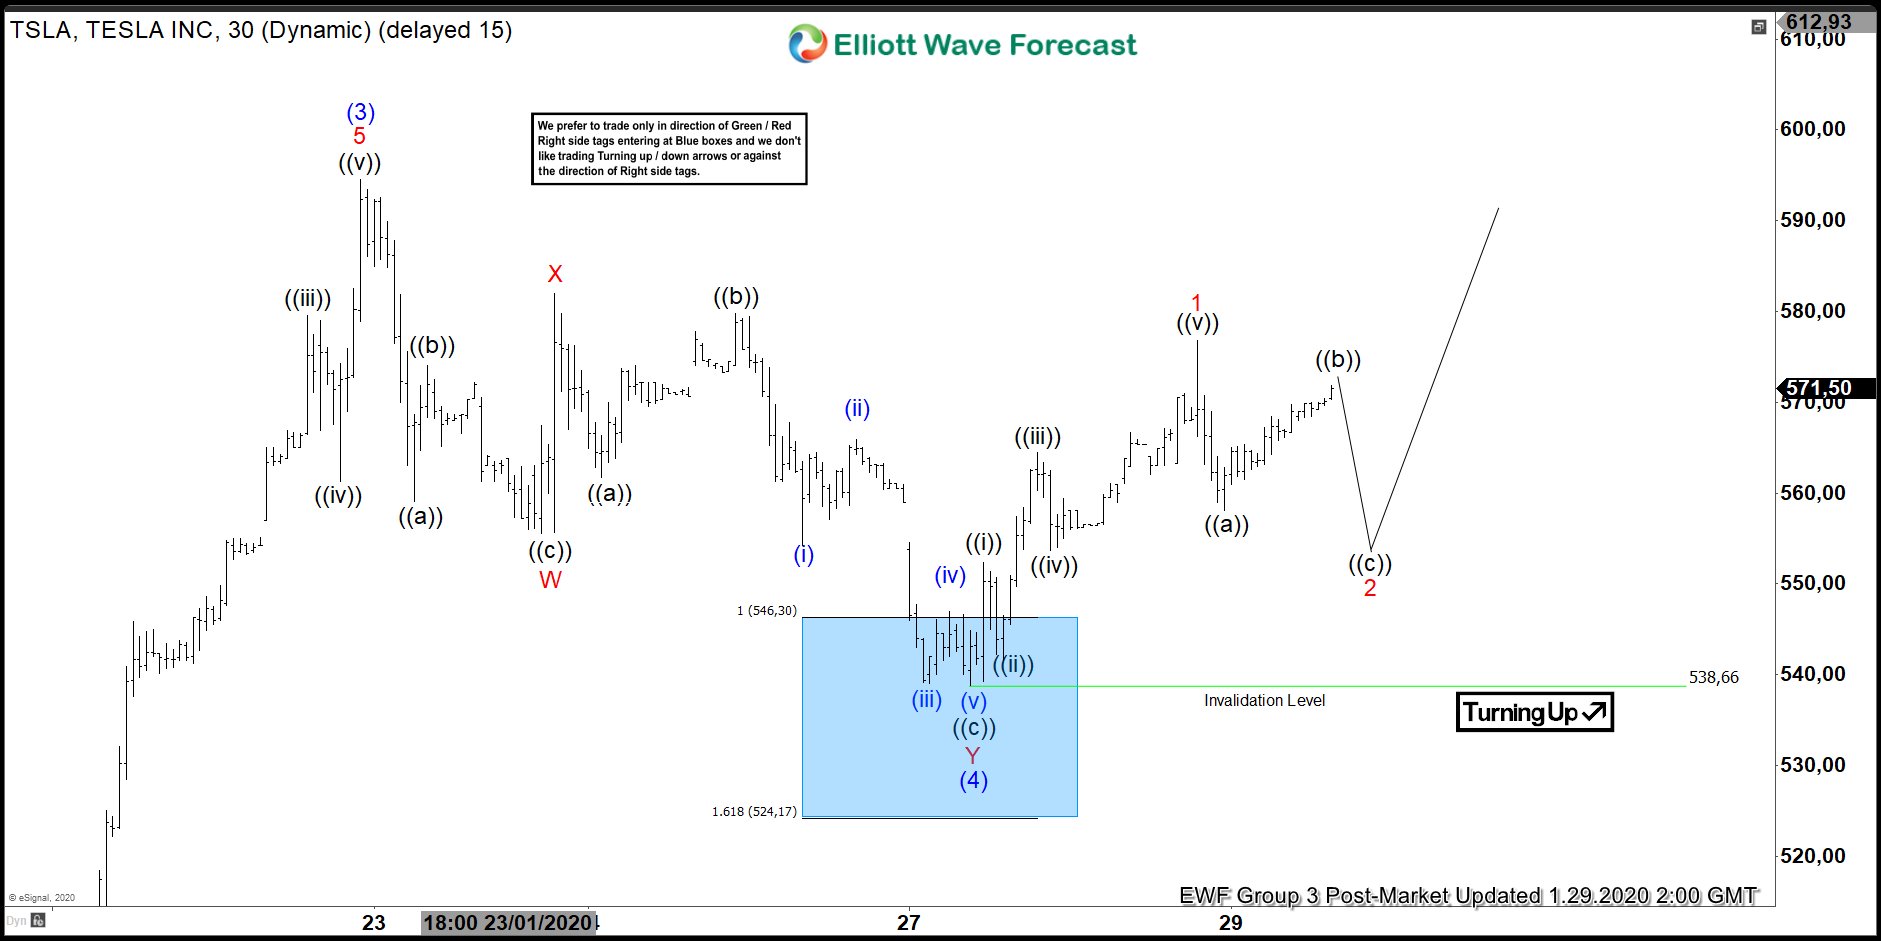
Elliott Wave View: Tesla Ended Short Term Correction
Read MoreTesla (TSLA) has ended the short term correction from Jan 22 high and can resume higher while above Jan 27 low. This video looks at the Elliott Wave path.