
The Power of 3-7-11 and the Grand Super Cycle: How We Saw the Bullish Turn in April 2025 Back on April 9, 2025, while World Indices were dropping sharply and global sentiment had turned overwhelmingly bearish, we published an article that challenged the fear-driven narrative. We explained why selling was not the right approach and […]
-

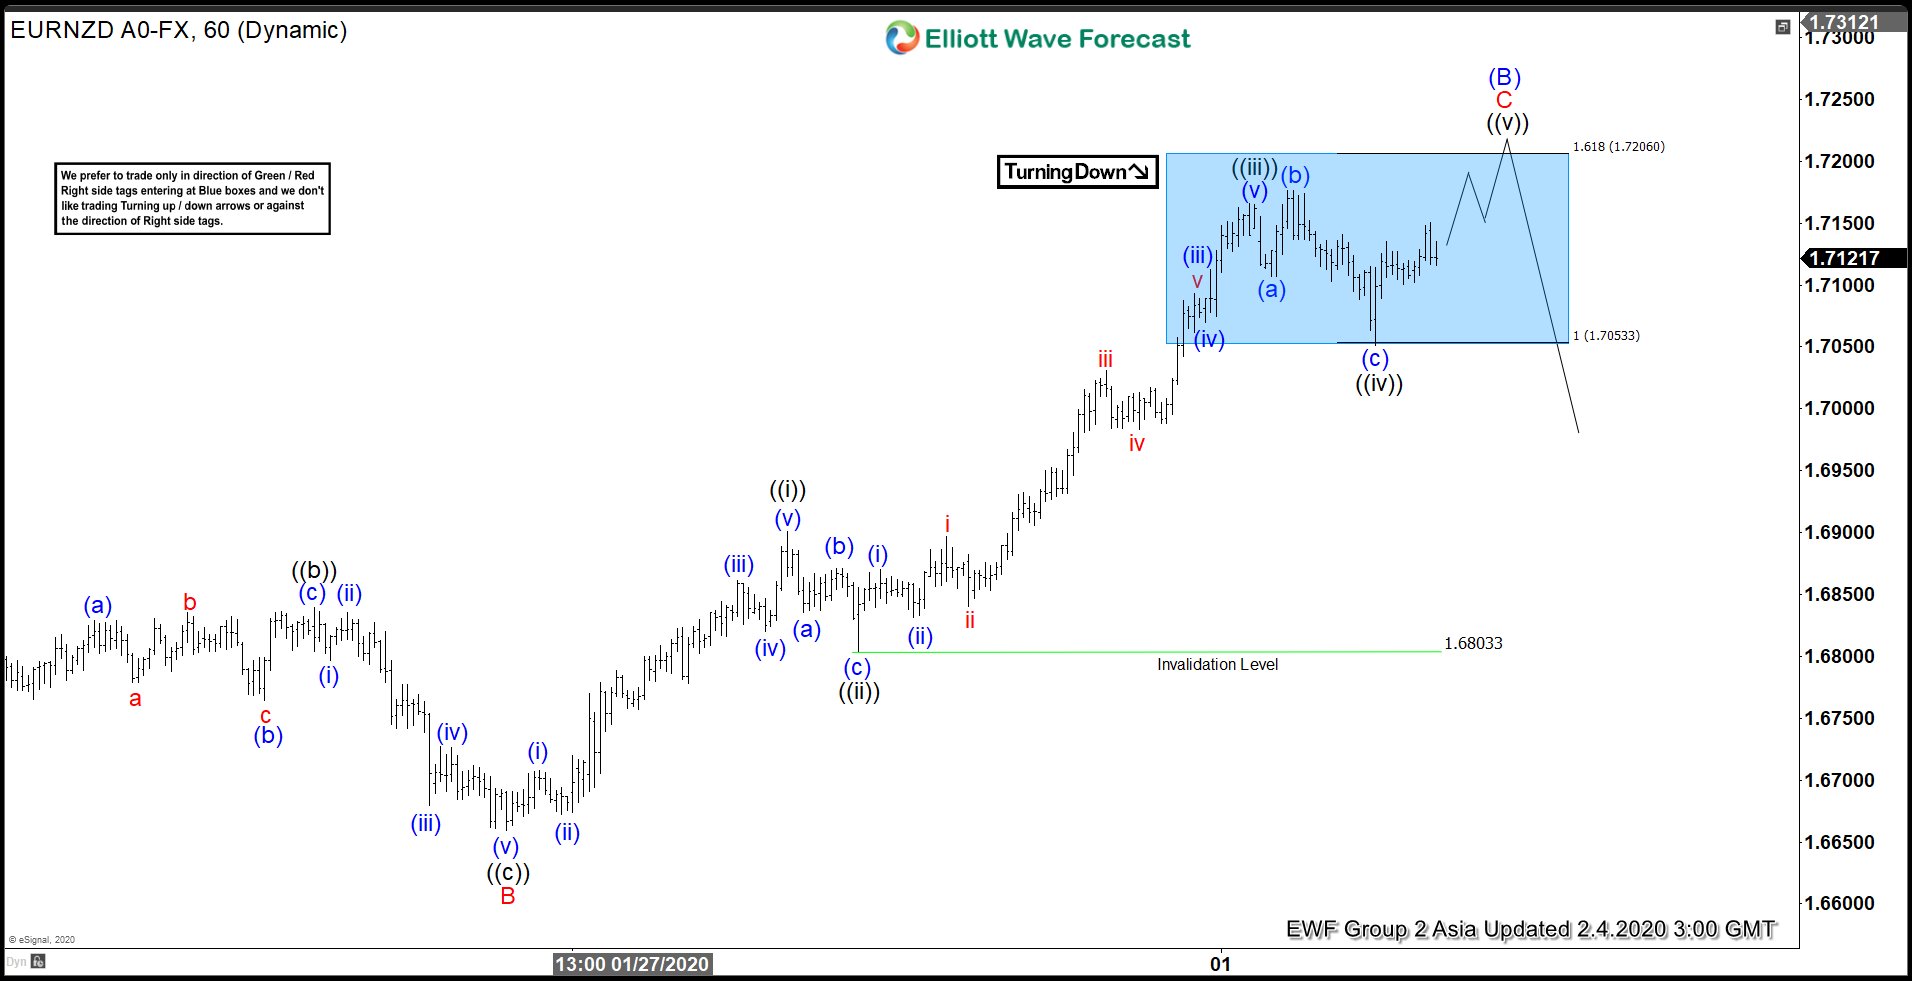
EURNZD Forecasting The Decline Using Elliott Wave Theory
Read MoreIn this blog, we take a look at the past performance of 1 hour Elliott Wave charts of EURNZD, In which our members took advantage of the blue box areas.
-

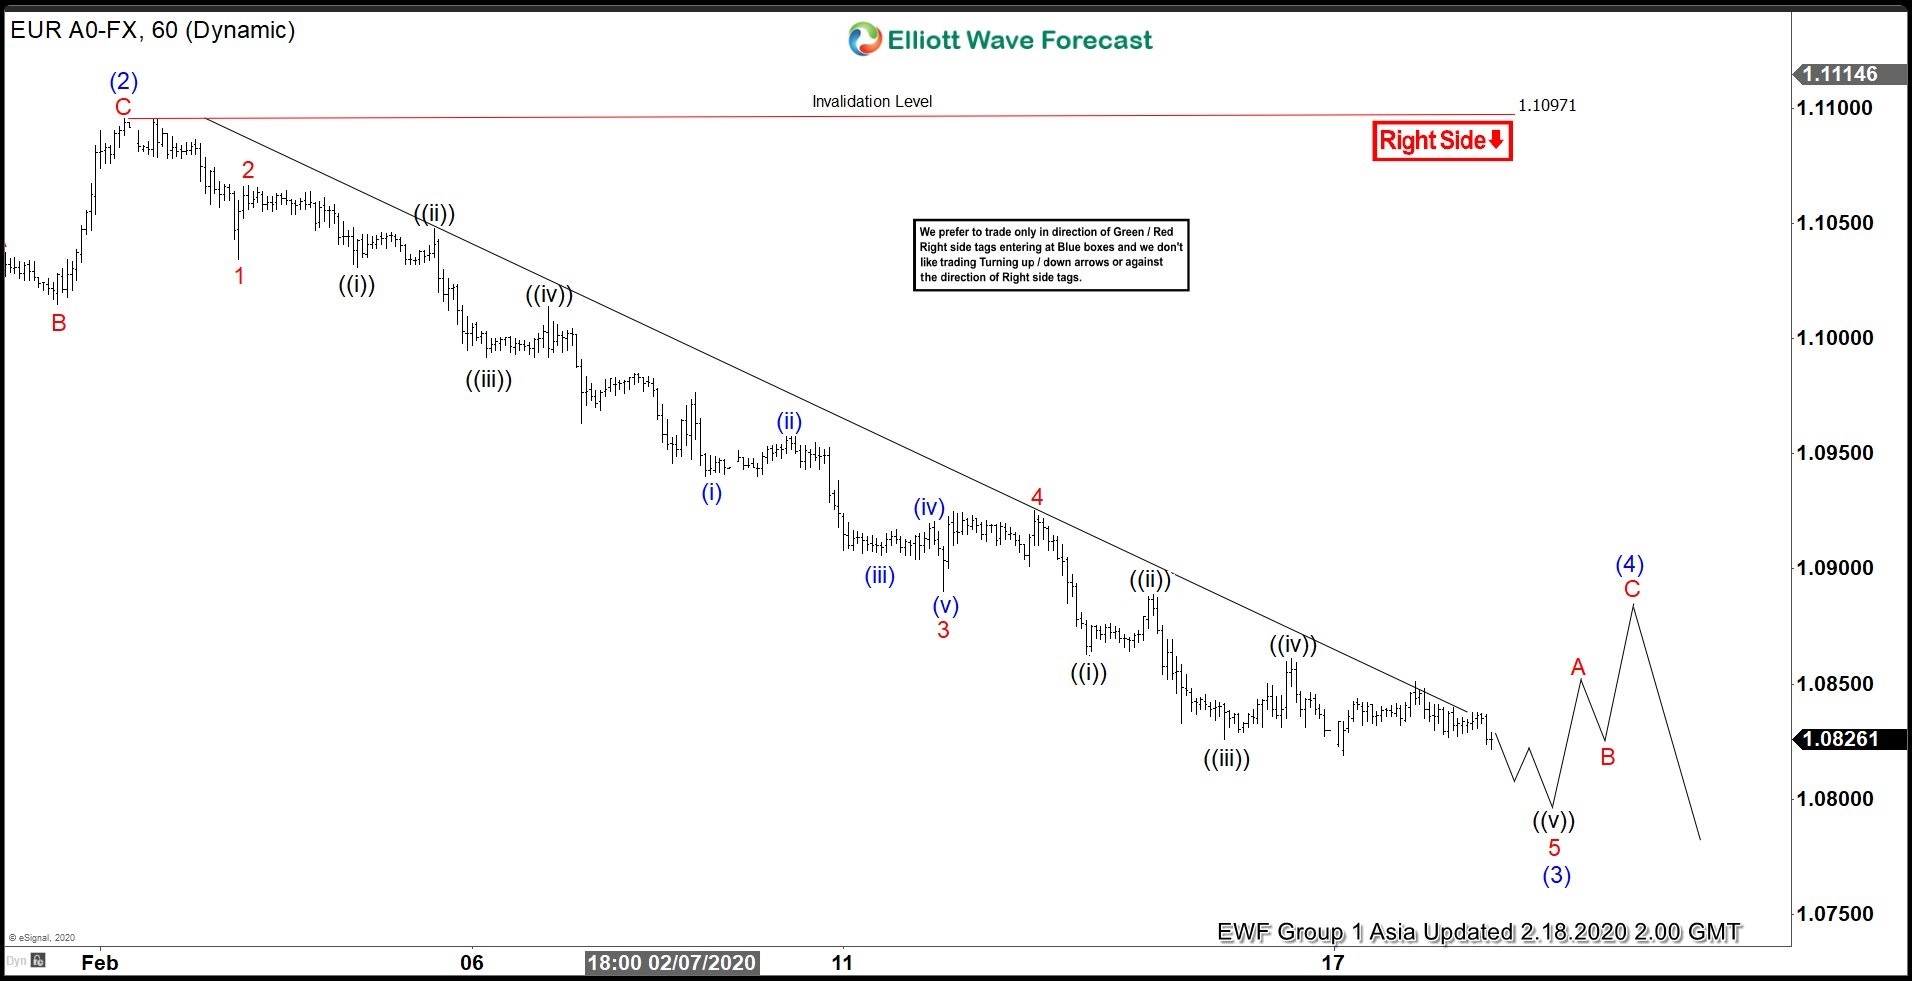
Elliott Wave View: EURUSD Can Bounce Soon
Read MoreShort term Elliott wave view in EURUSD suggests the cycle from December 31, 2019 high is unfolding as an impulse wave. Down from December 31, wave (1) ended at 1.0991 low and the bounce in wave (2) ended at 1.1097 high. The pair continues to the downside and wave (3) is still in progress. Wave […]
-

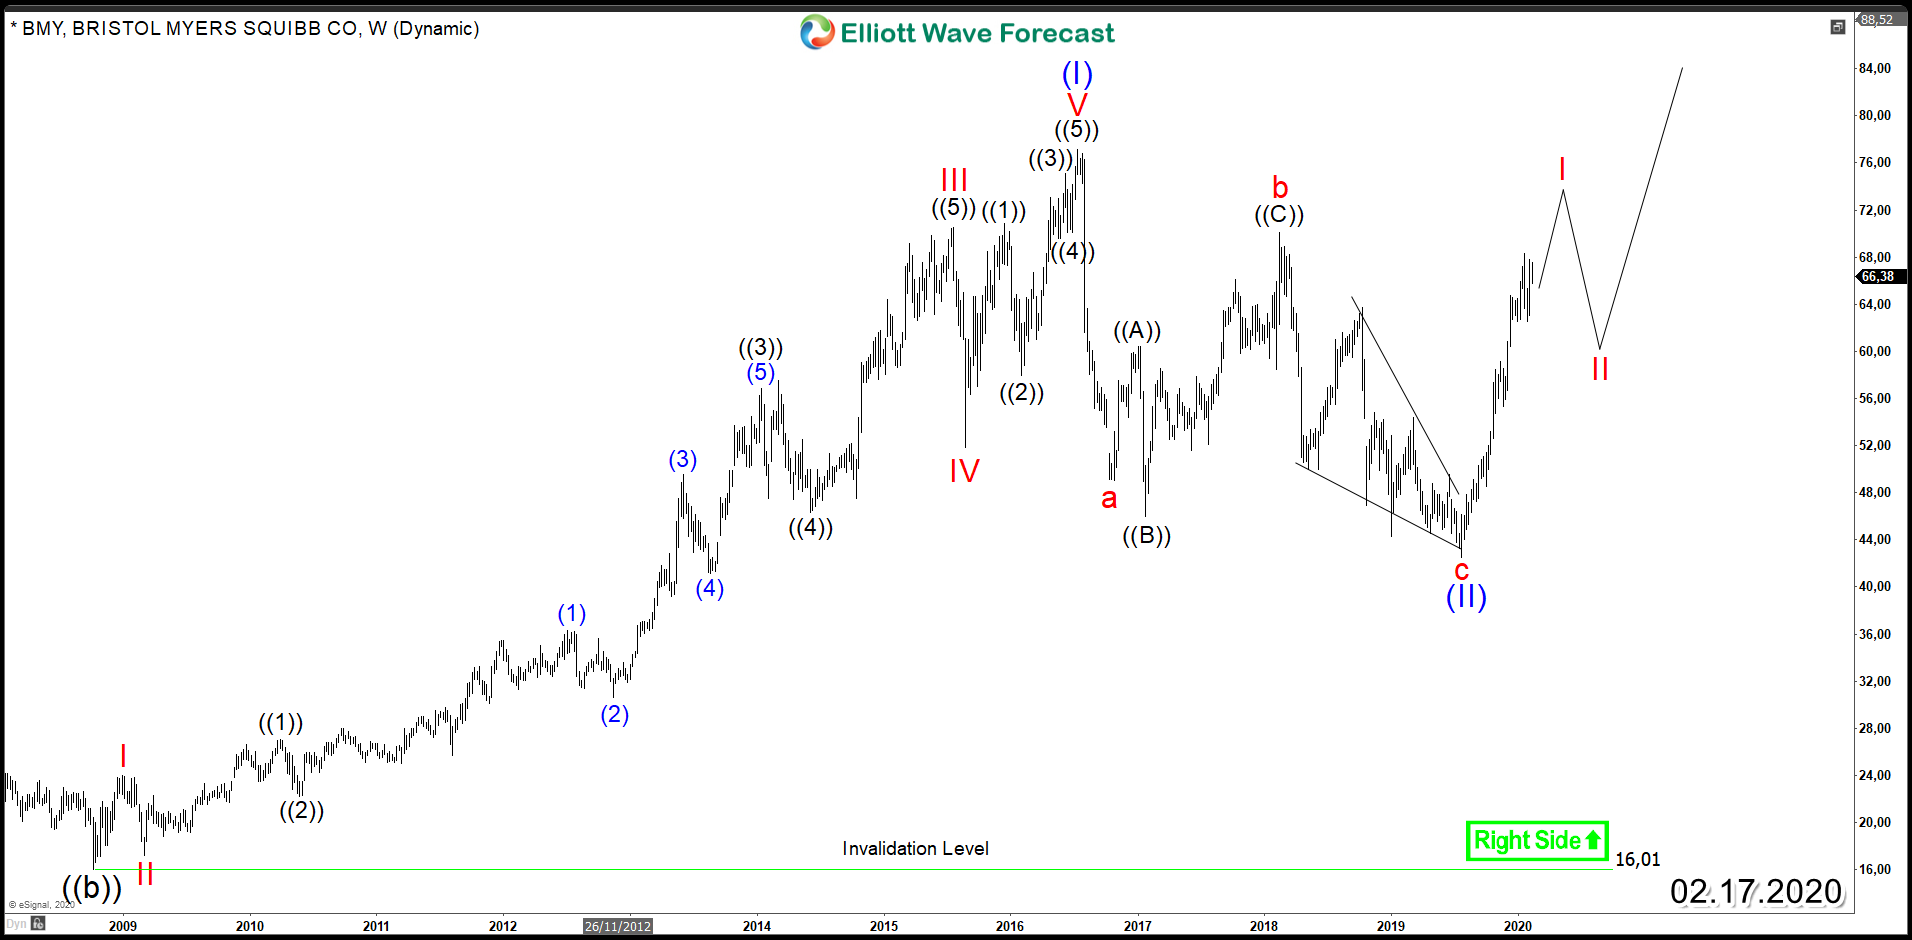
Bristol-Myers Squibb ( NYSE: BMY ) Aiming for New All Time Highs
Read MoreBristol-Myers Squibb (NYSE: BMY) is an American pharmaceutical company which manufactures prescription pharmaceuticals and biologics in several therapeutic areas with particular success in cardiovascular treatments. Since 2008, BMY established an impulsive rally taking the stock to new all time highs after it managed to break above 1999 peak which opened a multi-year bullish sequence. The cycle lasted for […]
-

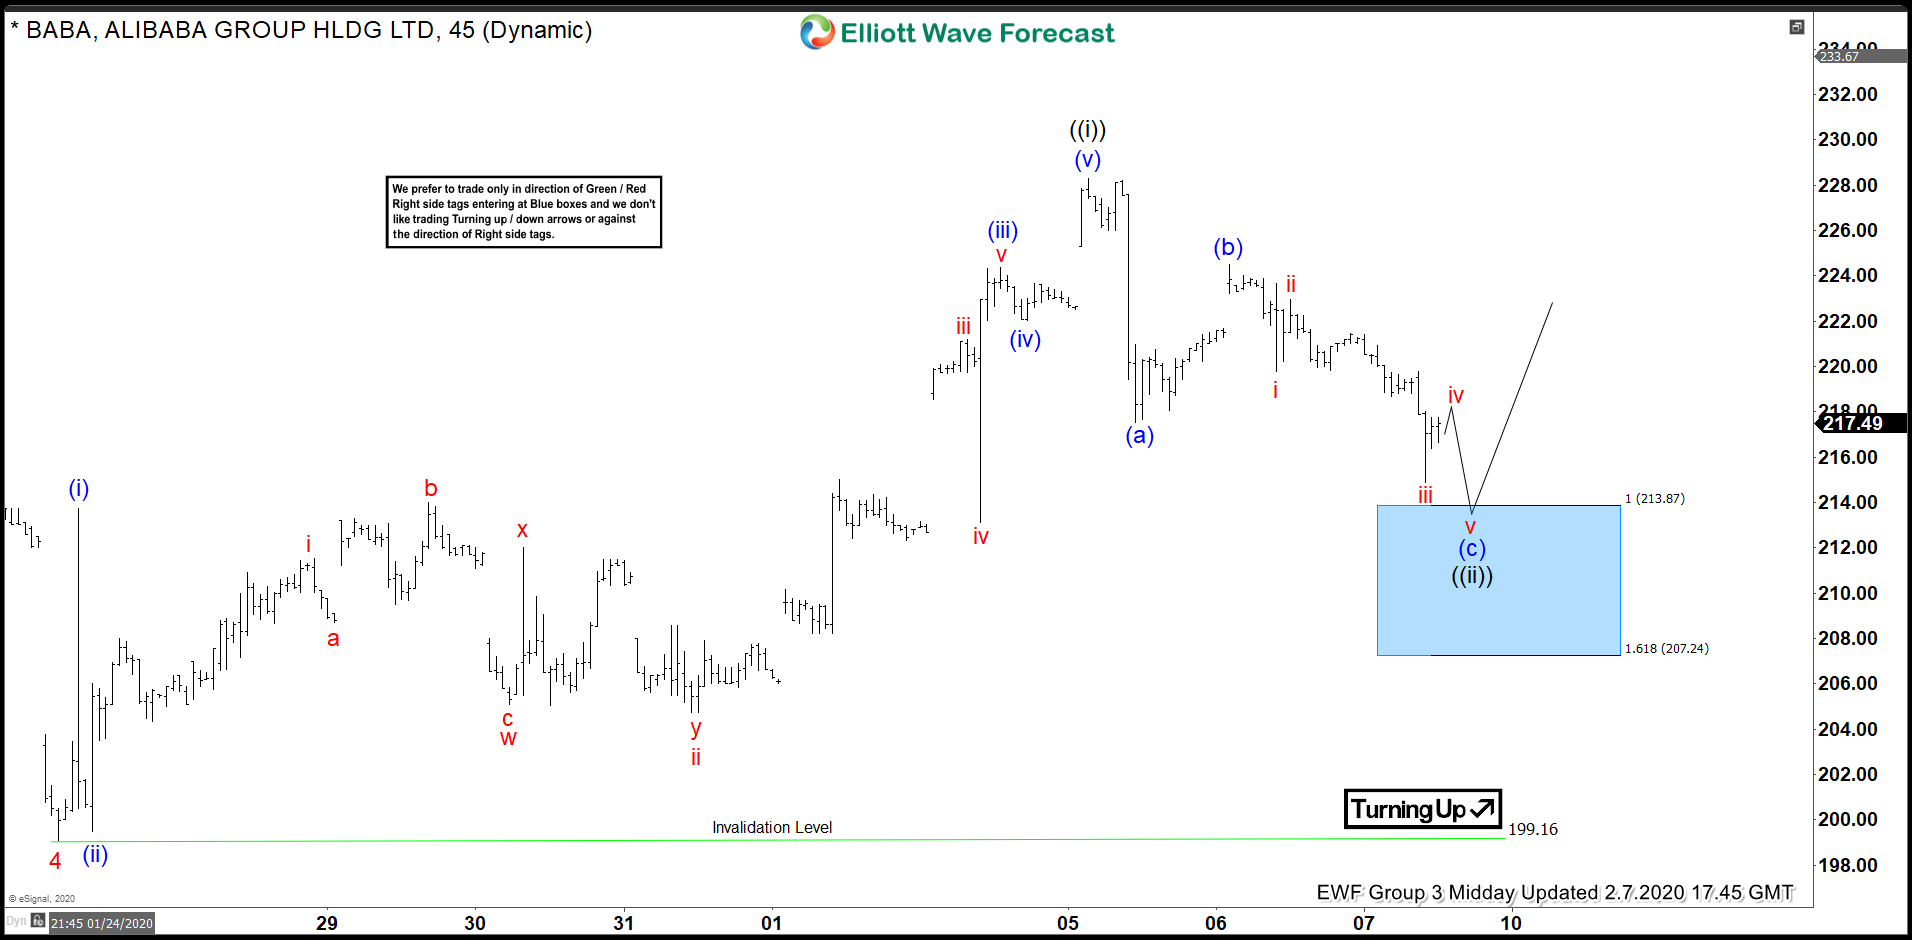
BABA Found Byers At The Blue Box After Elliott Wave Zig Zag Pattern
Read MoreHello fellow traders. In this technical blog we’re going to take a quick look at the Elliott Wave charts of BABA. As our members know BABA has recently given us pull back against the 199.12 low. Pull back unfolded as Elliott Wave Zig Zag Pattern. We expected buyers to appear at the Blue Box , […]