

The Power of 3-7-11 and the Grand Super Cycle: How We Saw the Bullish Turn in April 2025 Back on April 9, 2025, while World Indices were dropping sharply and global sentiment had turned overwhelmingly bearish, we published an article that challenged the fear-driven narrative. We explained why selling was not the right approach and […]
-
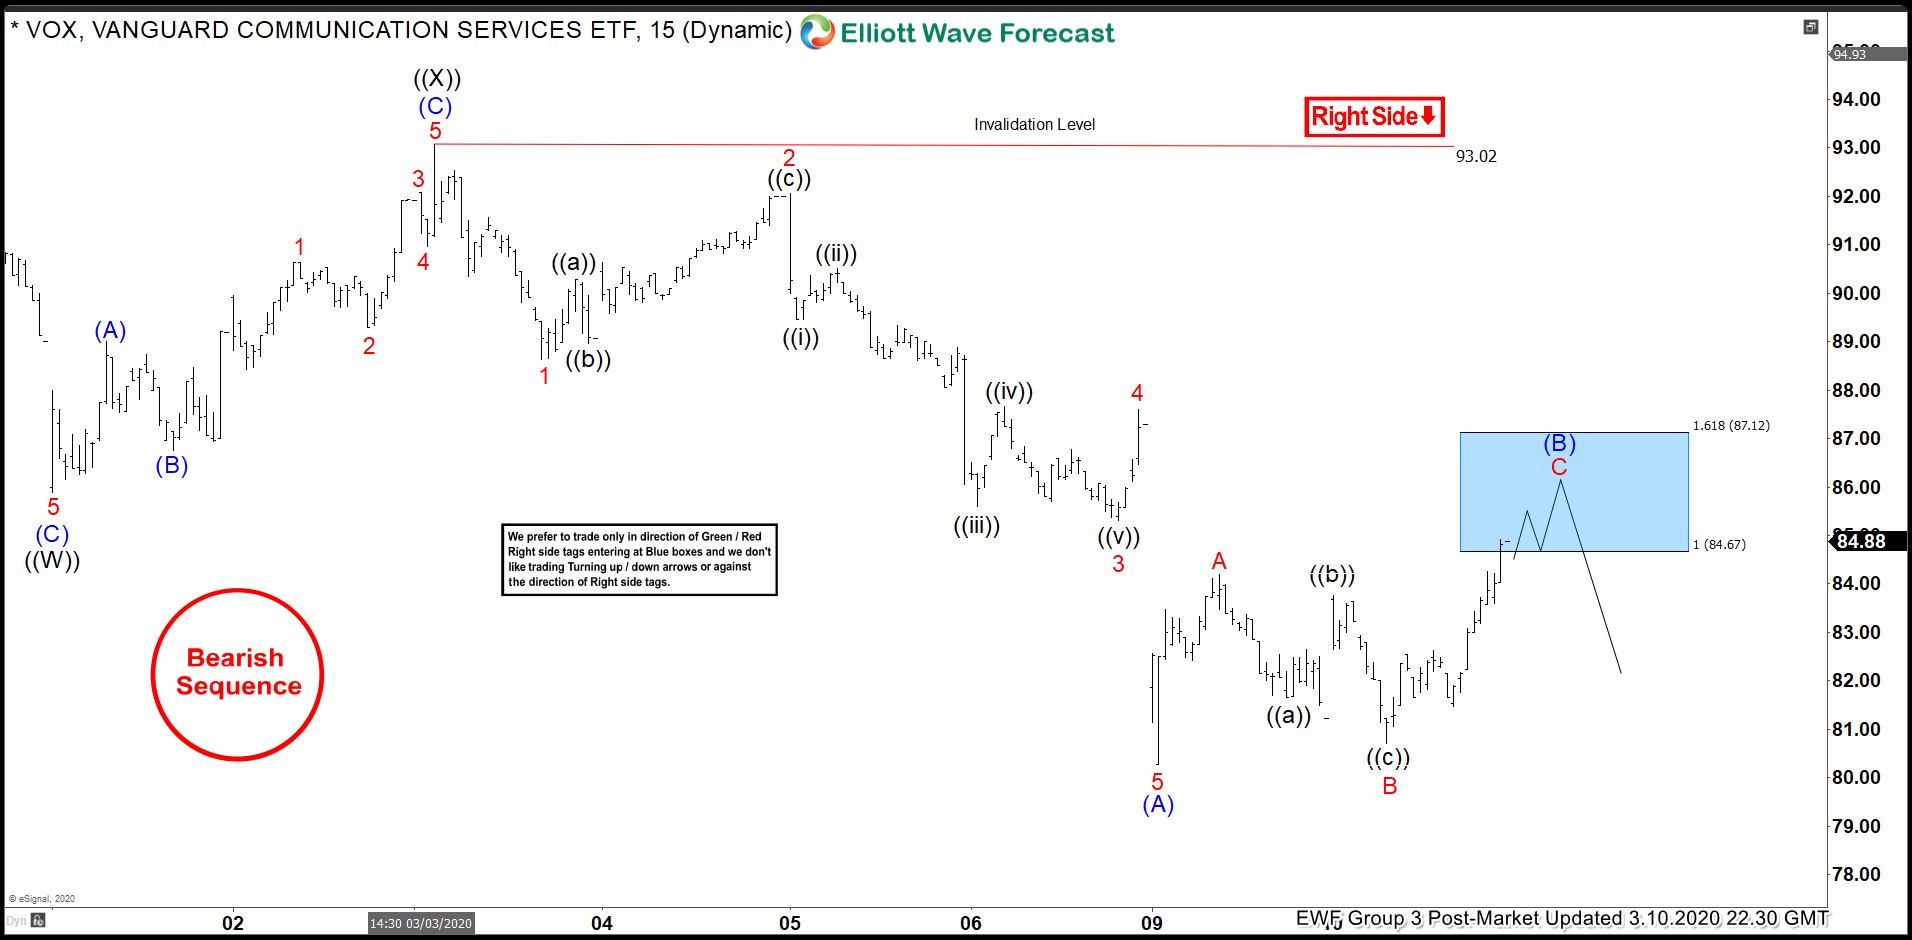
VOX Elliott Wave View: Selling The Blue Box Areas
Read MoreIn this blog, we take a look at the past performance of 1 hour Elliott Wave charts of VOX In which our members took advantage of the blue box areas.
-
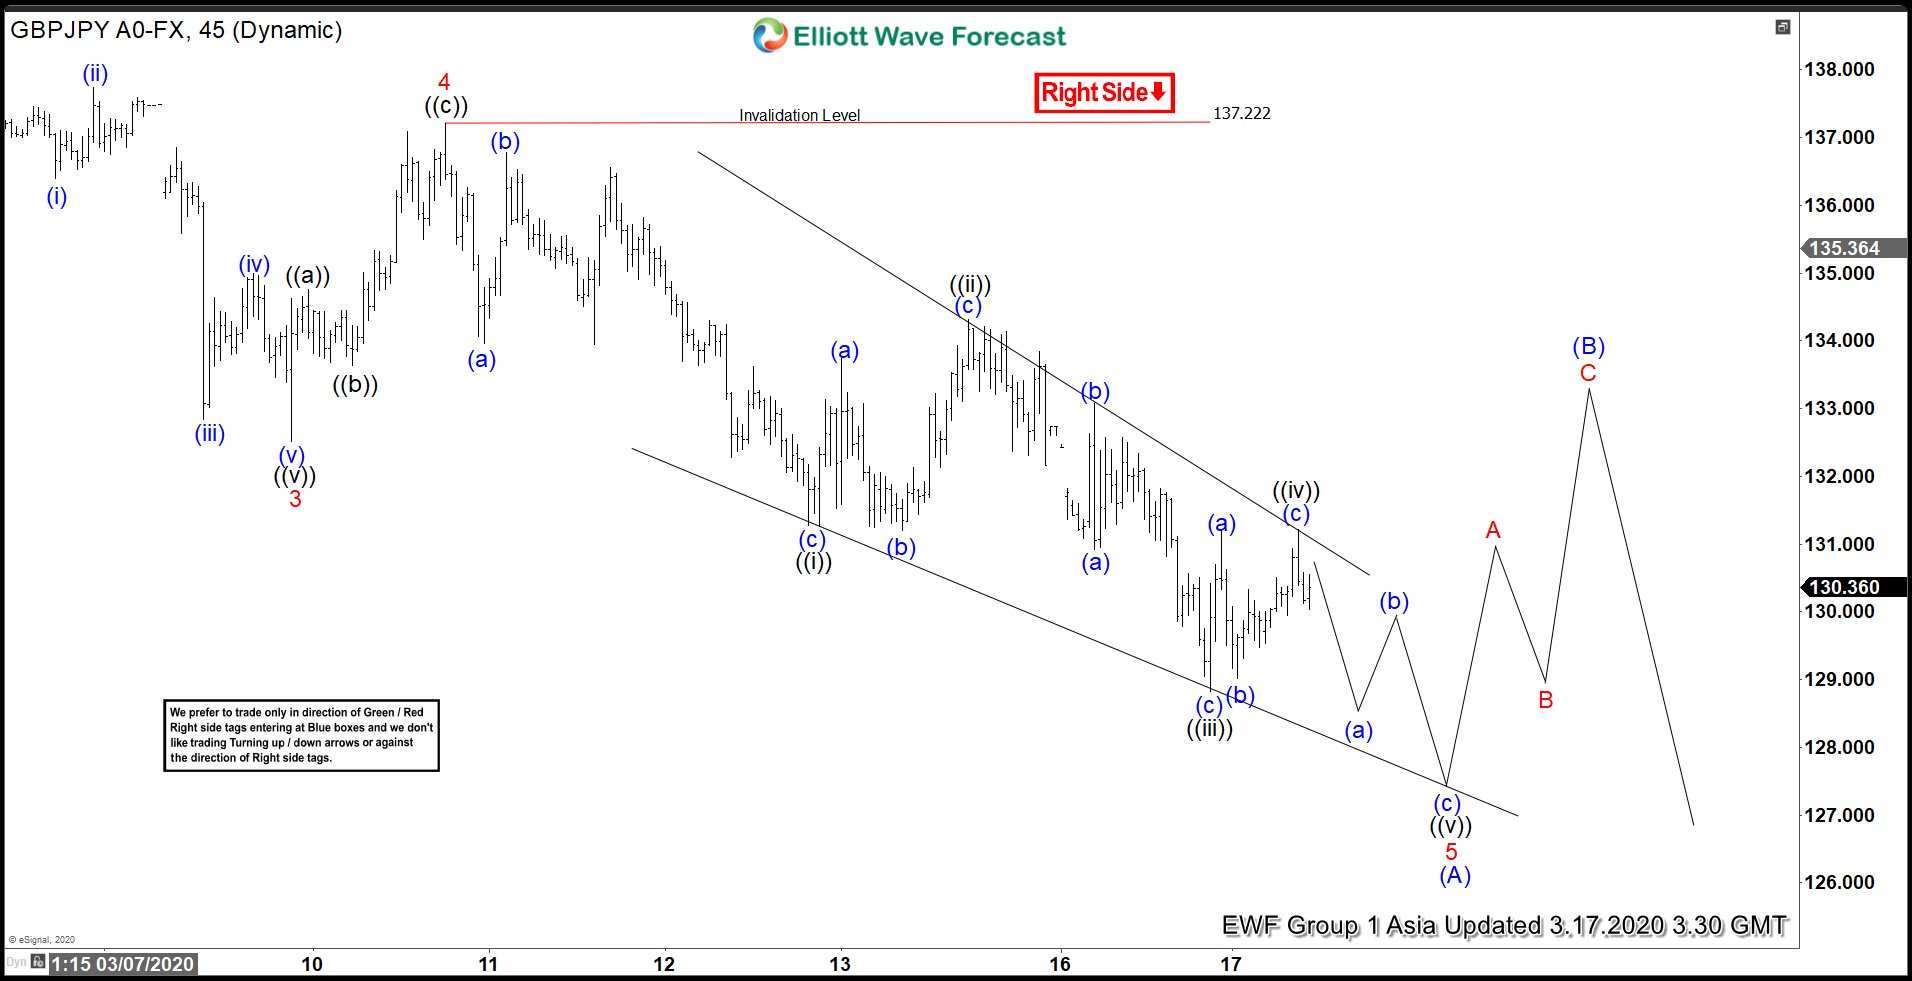
Elliott Wave View: GBPJPY Ending 5 Waves Impulse
Read MoreElliott Wave view in GBPJPY suggests that the decline from December 13, 2019 high is unfolding as a 5 waves impulse Elliott Wave structure. Down from December 13, 2019 high, wave 1 ended at 141.14, and wave 2 bounce ended at 144.96. Pair extended lower in wave 3 at 132.51 & wave 4 bounce ended […]
-
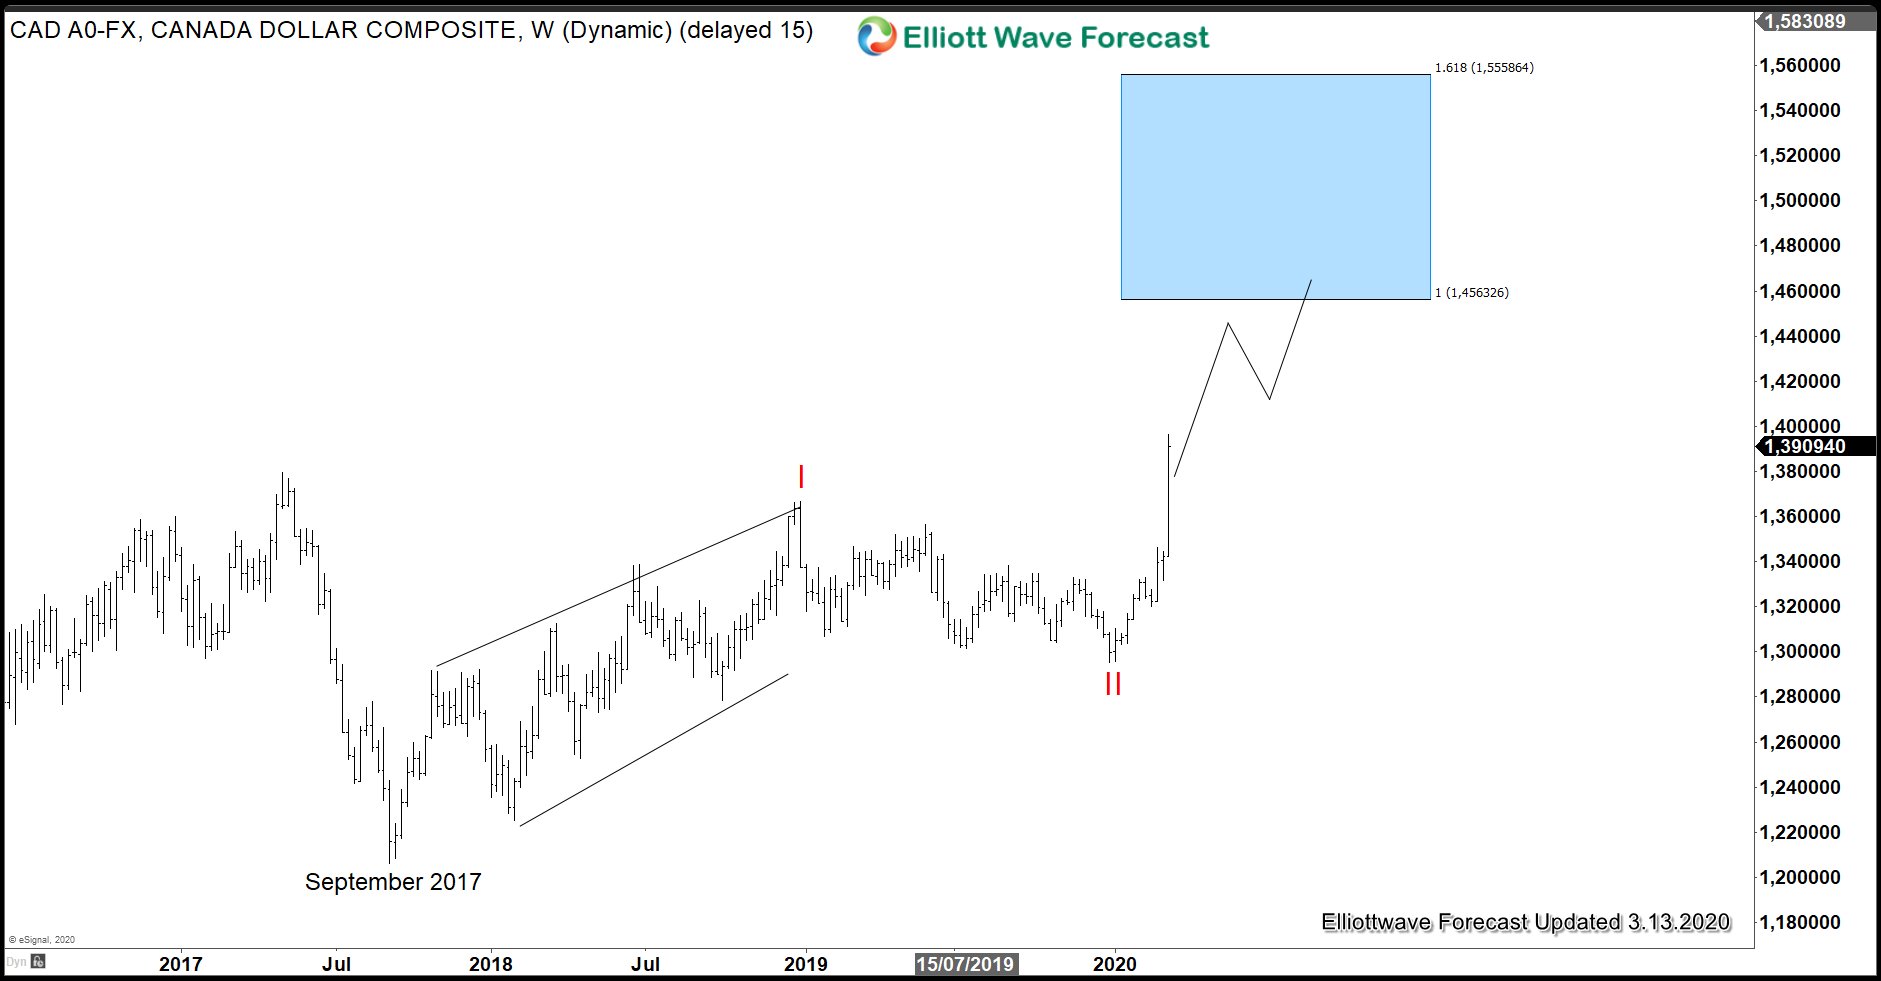
CAD And NOK Biggest Losers As Oil Price Crashed
Read MoreOil price crashed more than 30% and reached a low of $27 earlier this week. OPEC’s failure to agree on further production cuts and Saudi Arabia/Russia price war has driven crude oil to the low last seen in January 2016. Commodity currencies such as Canadian Dollar (CAD) and Norwegian Krone (NOK), which are oil-sensitive, were […]
-
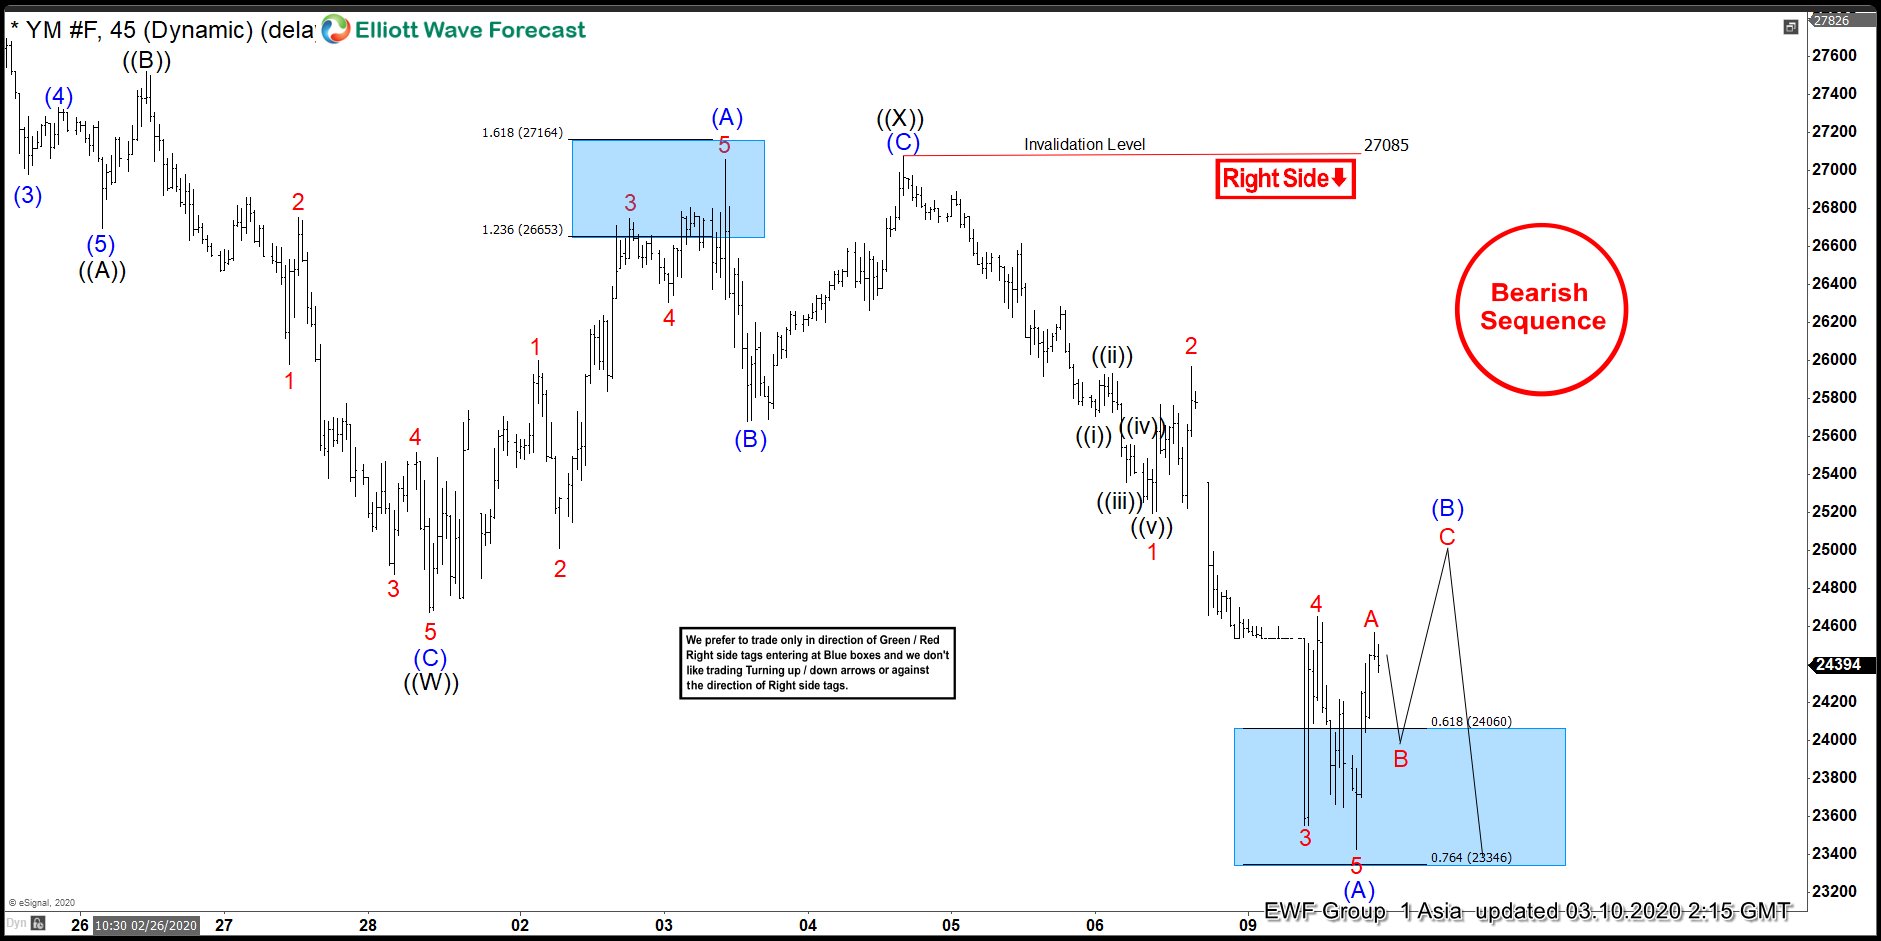
INDU ( $YM_F ) Elliott Wave : Forecasting The Path
Read MoreHello fellow traders. In this technical blog we’re going to take a quick look at the Elliott Wave charts of INDU ( $YM_F) , published in members area of the website. As our members know , recently we were calling for more weakness in INDU within the cycle from the February 12th peak. Eventually INDU […]