
The Power of 3-7-11 and the Grand Super Cycle: How We Saw the Bullish Turn in April 2025 Back on April 9, 2025, while World Indices were dropping sharply and global sentiment had turned overwhelmingly bearish, we published an article that challenged the fear-driven narrative. We explained why selling was not the right approach and […]
-

Elliott Wave Forecast: USDCHF Dips Can See Support
Read MoreUSDCHF rally from March 28 low is impulsive and while dips stay above there, pair can see further upside.This article & video look at the Elliott Wave path.
-

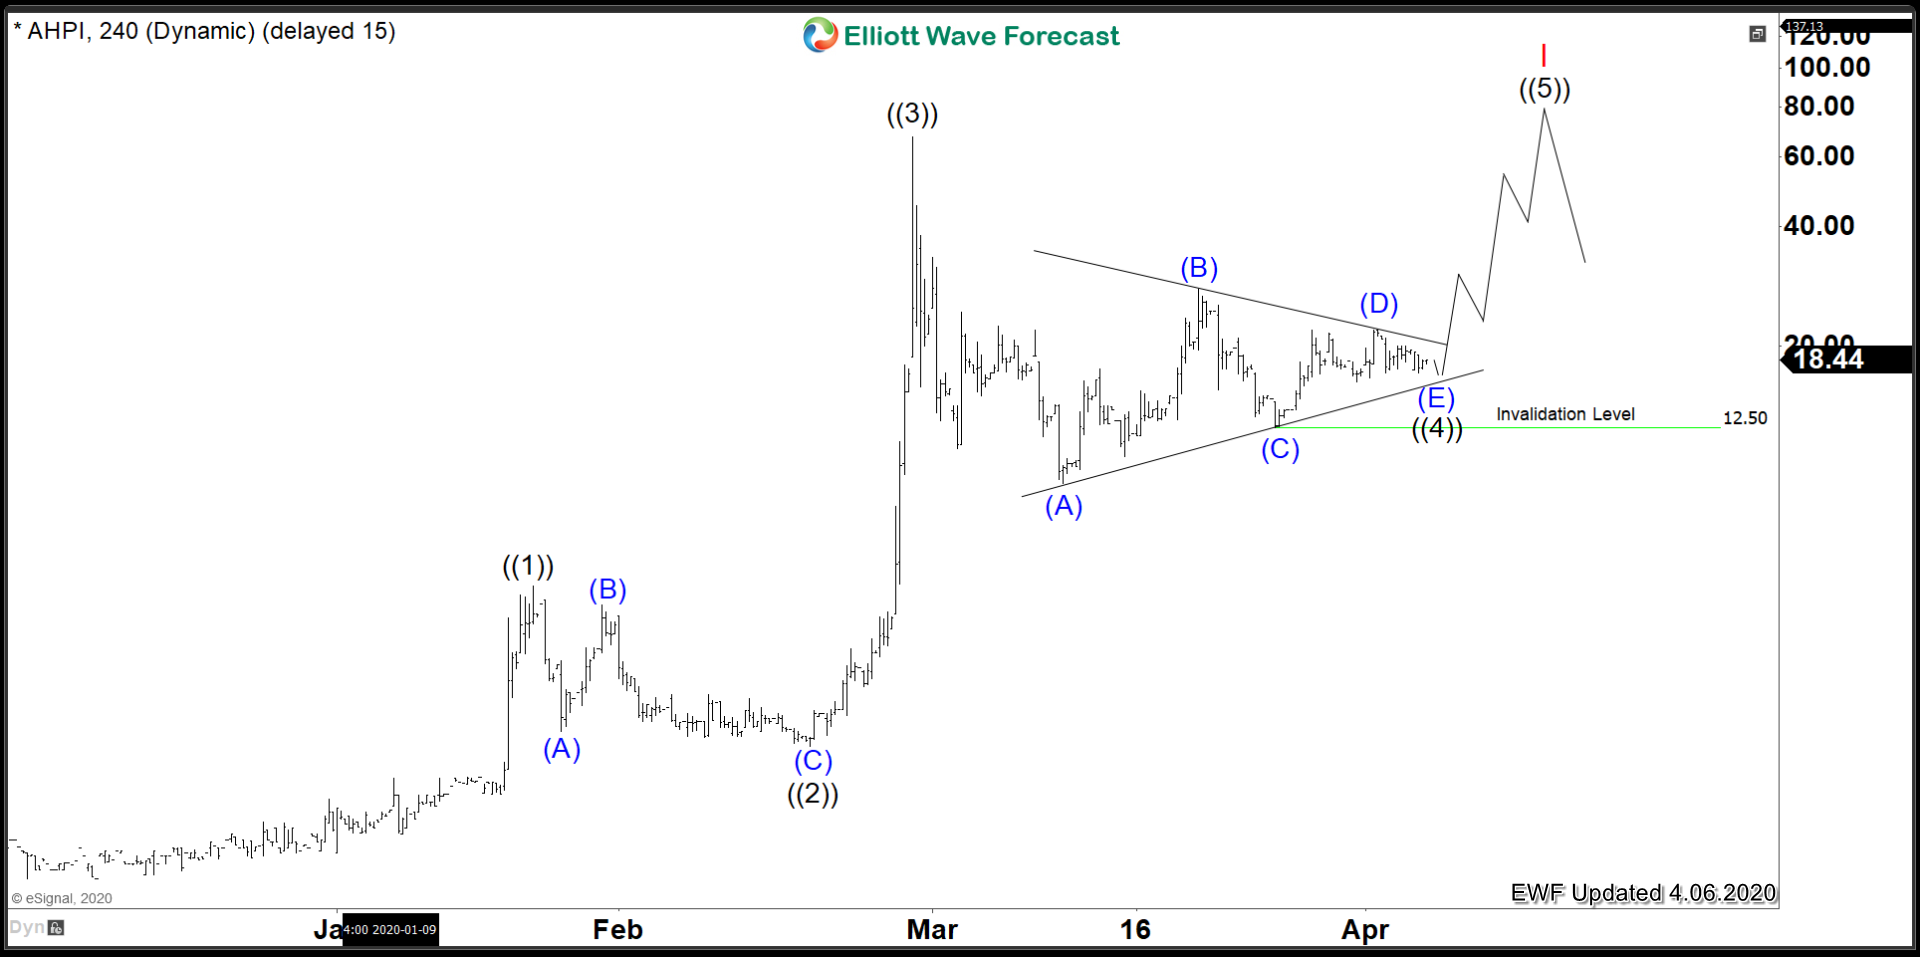
Allied Healthcare Products Inc. ($AHPI) Leaning Bullish
Read MoreThe Corona Virus has provided some tremendous rallies in the healthcare and bio science sectors. Allied Healthcare Products Inc. is one of those names that has gone parabolic with the COVID-19 spreading worldwide. It still remains very technical, and I think there could be one more leg up before the rally is complete. Lets take […]
-

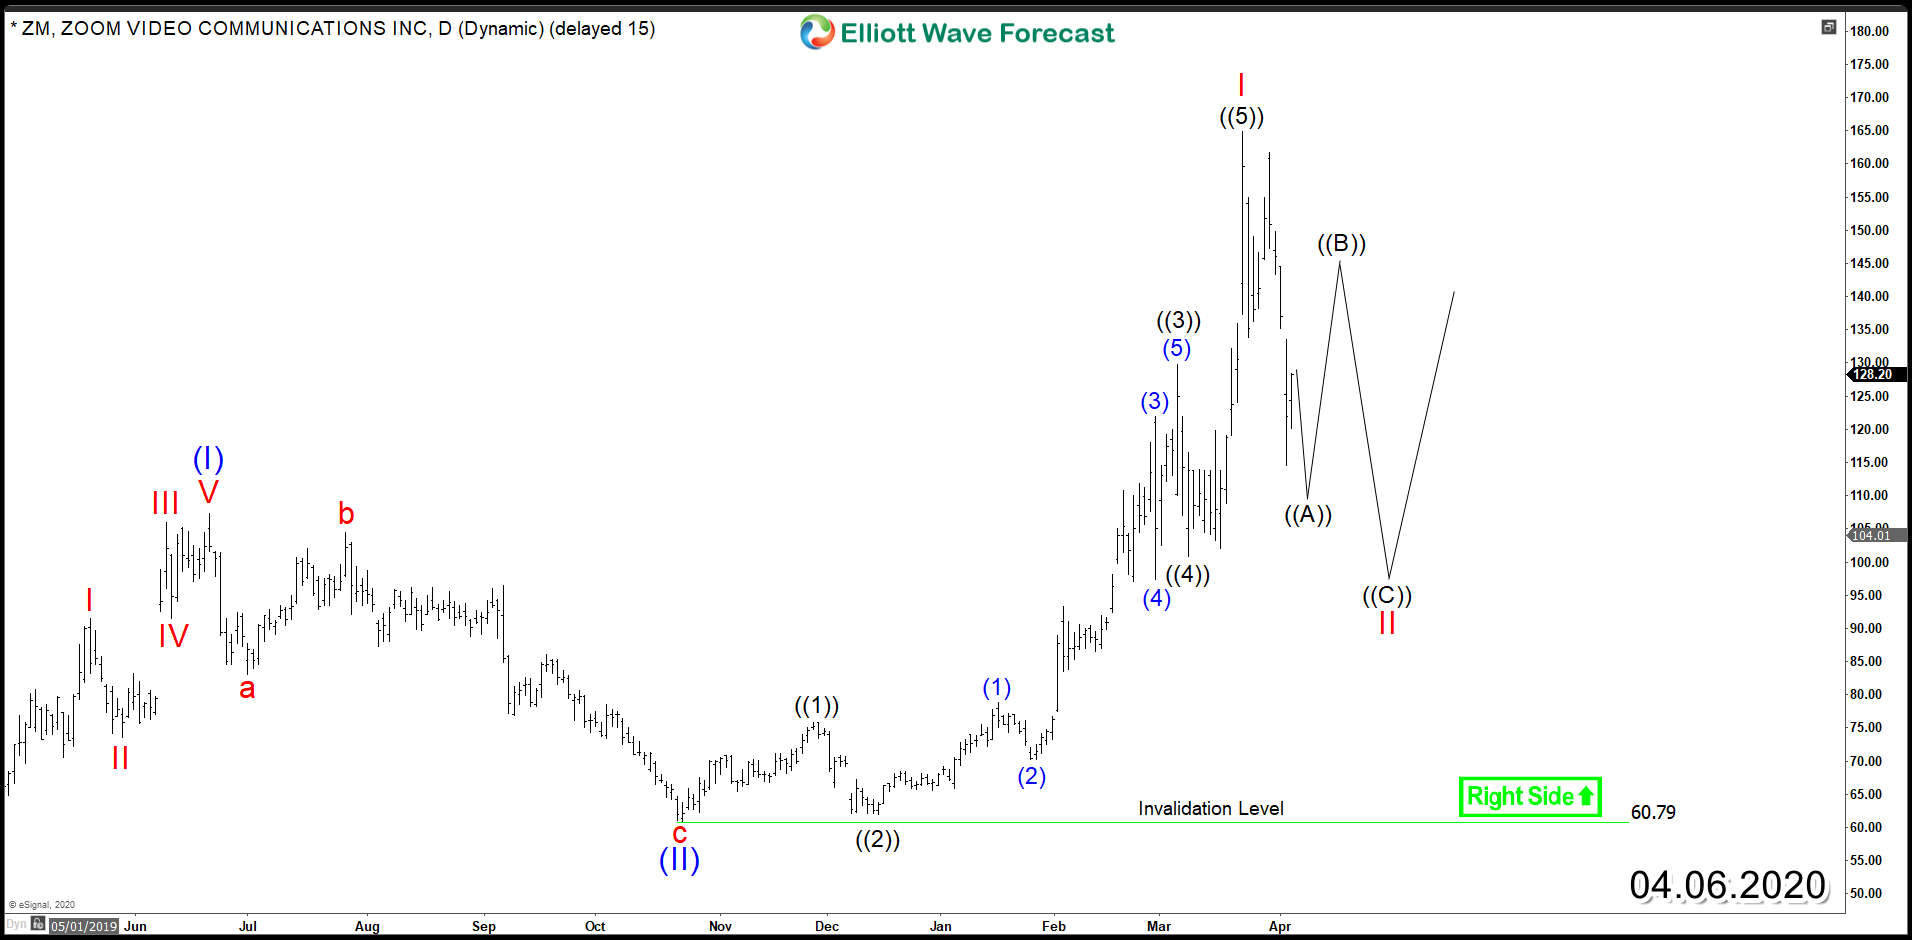
Zoom Video Communications Inc (NASDAQ: ZM) Remain Bullish
Read MoreZoom Video Communications Inc (NASDAQ: ZM) is an American remote conferencing services company that combines video conferencing, online meetings, chat, and mobile collaboration. The stock has gained 90% since February before giving up half of the gains last week , while the majority of stocks has plunged over 20%. That puts ZM as one of the […]
-

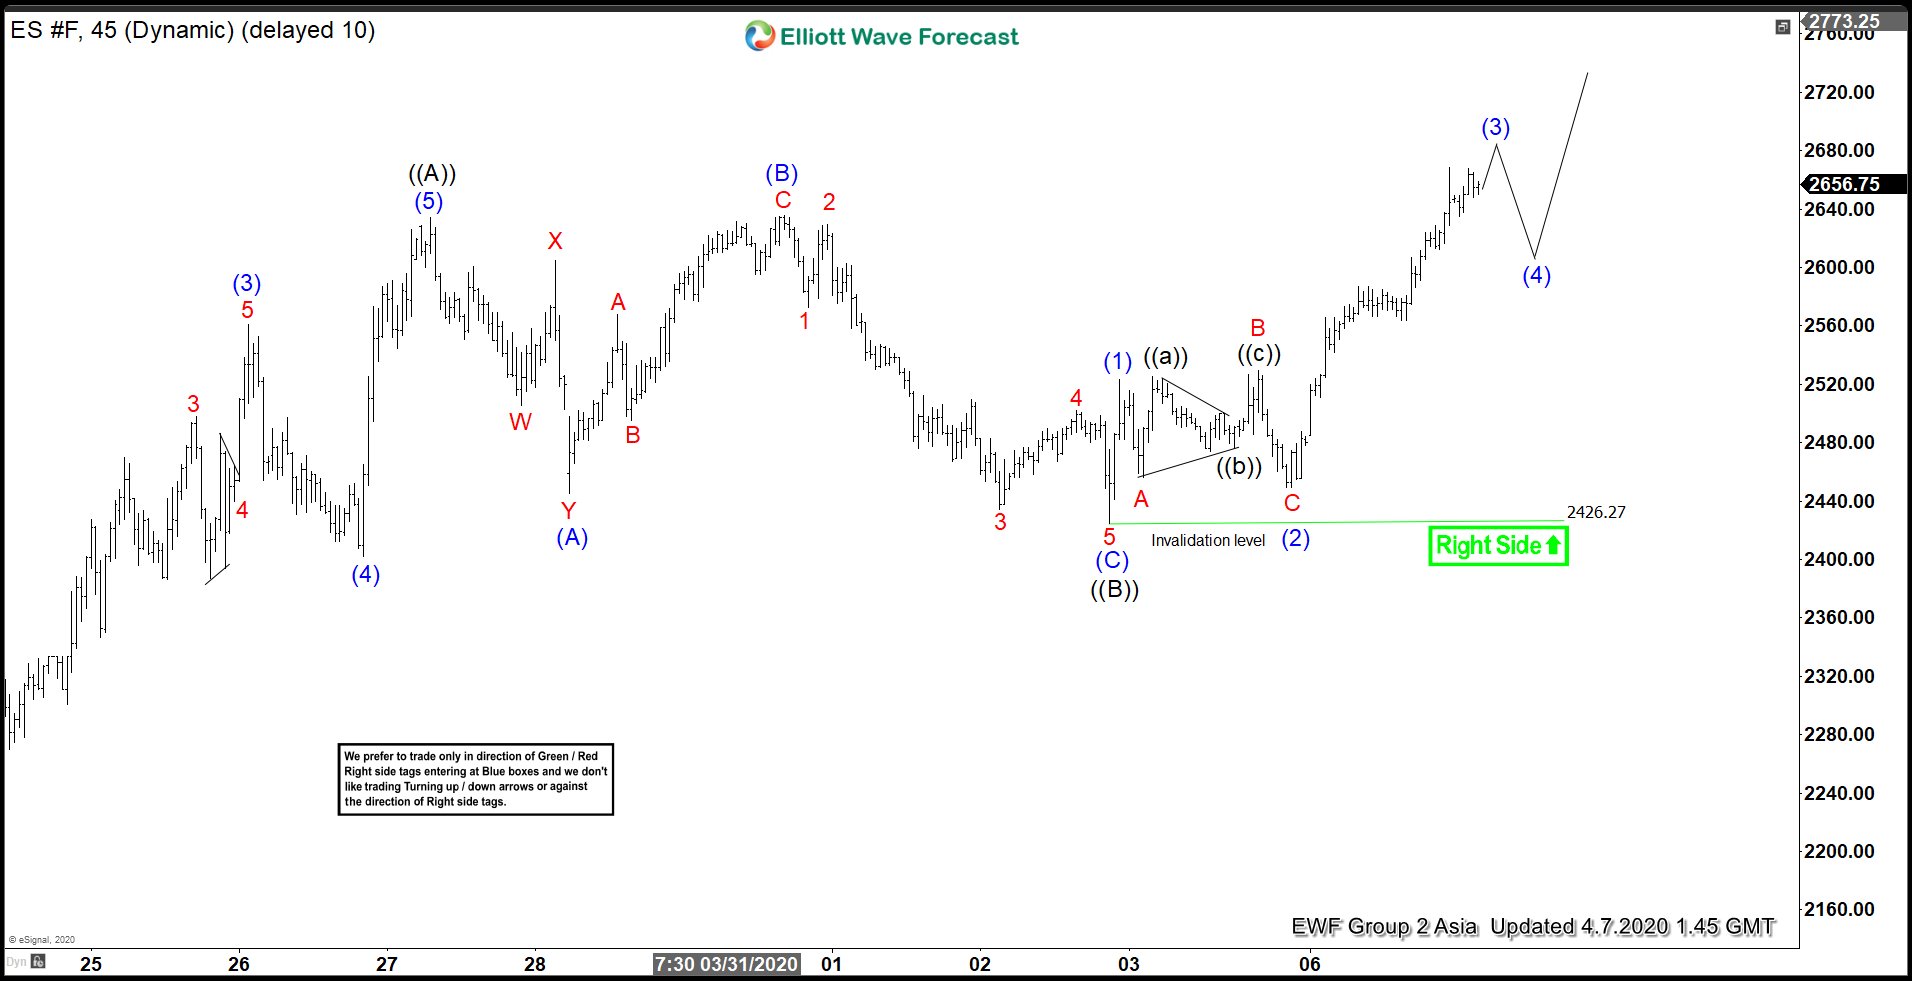
Elliott Wave View: S&P 500 E-Mini Futures (ES_F) Extends Higher
Read MoreS&P 500 E-Mini Futures (ES_F) broke above last week’s high at 2635.75 and shows incomplete sequence from 3.23 low, favoring further upside in near term. Short Term Elliott Wave suggests the rally from 3.23 low (2174) is unfolding as Elliott Wave zigzag structure. Up from 3.23 low, wave ((A)) ended at 2634.5. Internal of wave […]