
The Power of 3-7-11 and the Grand Super Cycle: How We Saw the Bullish Turn in April 2025 Back on April 9, 2025, while World Indices were dropping sharply and global sentiment had turned overwhelmingly bearish, we published an article that challenged the fear-driven narrative. We explained why selling was not the right approach and […]
-

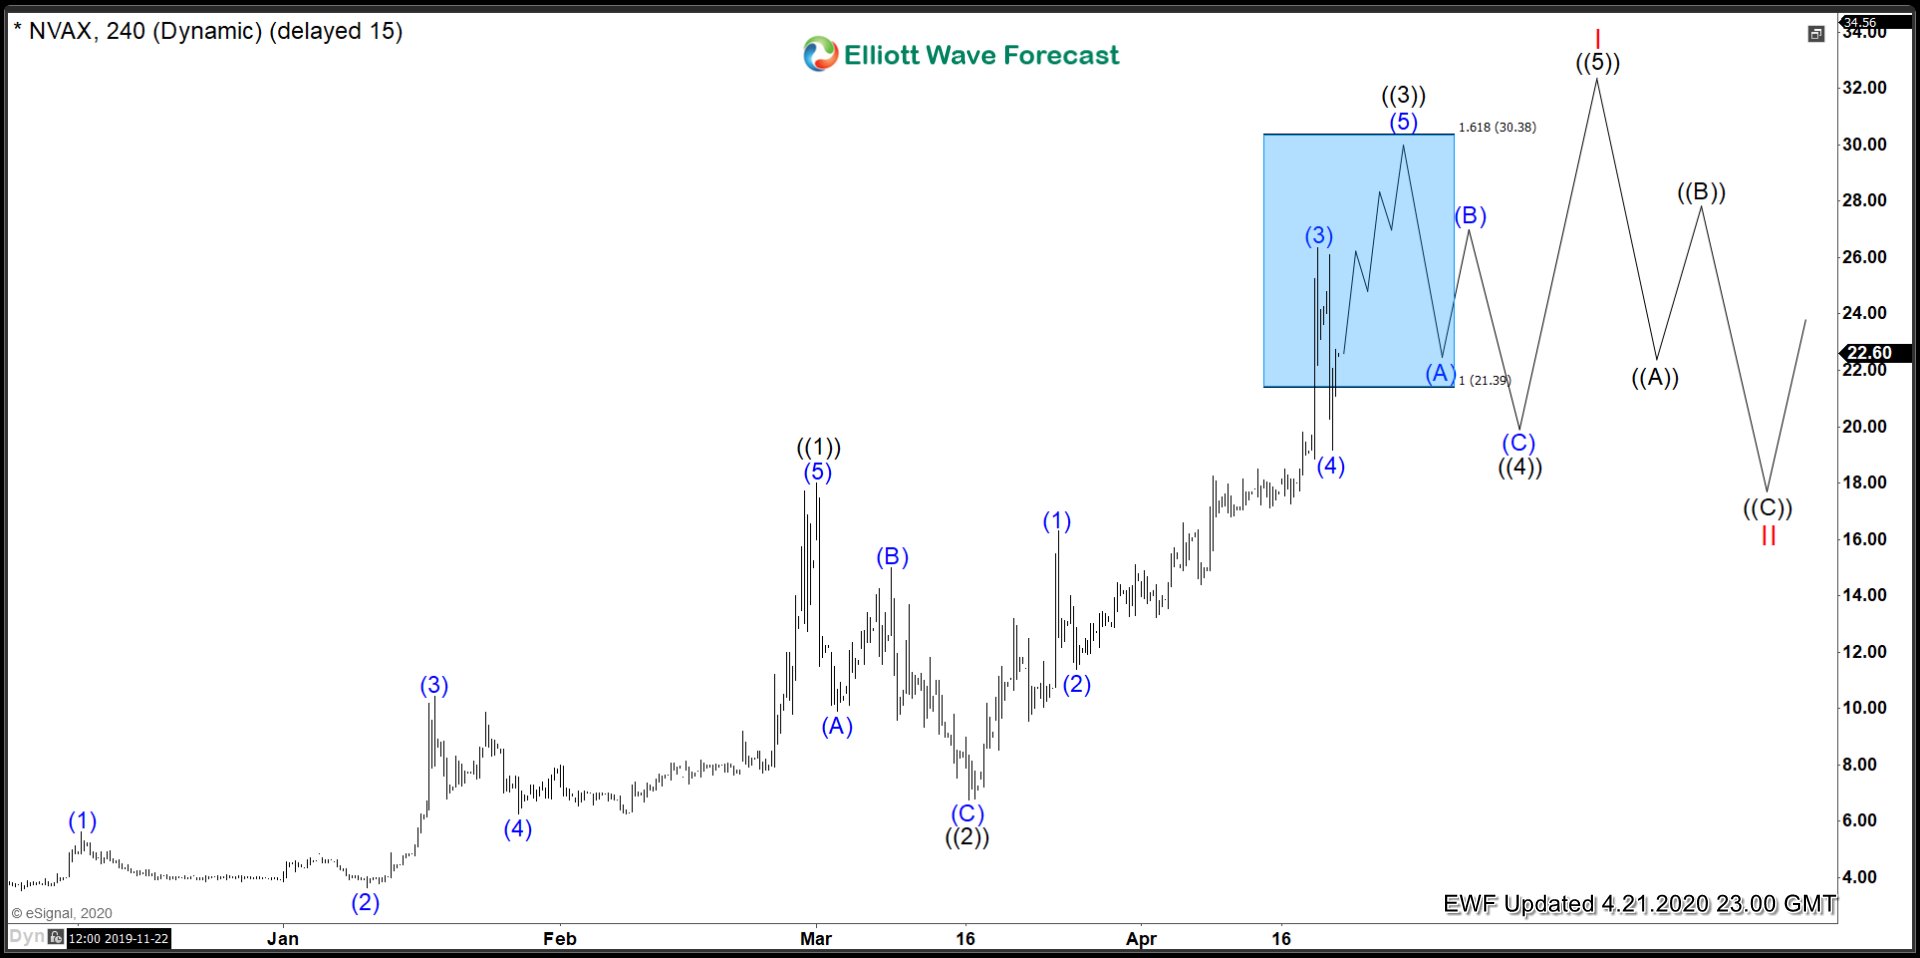
Novavax ($NVAX) Riding The Waves
Read MoreContinuing along the theme of Corona Virus stocks, this week Novavax Inc. is next up in line. Novavax has gone parabolic with the COVID-19 spreading worldwide as with the other names I have covered. It also remains very technical, and I think there could a few more swings up before a longer term top is […]
-

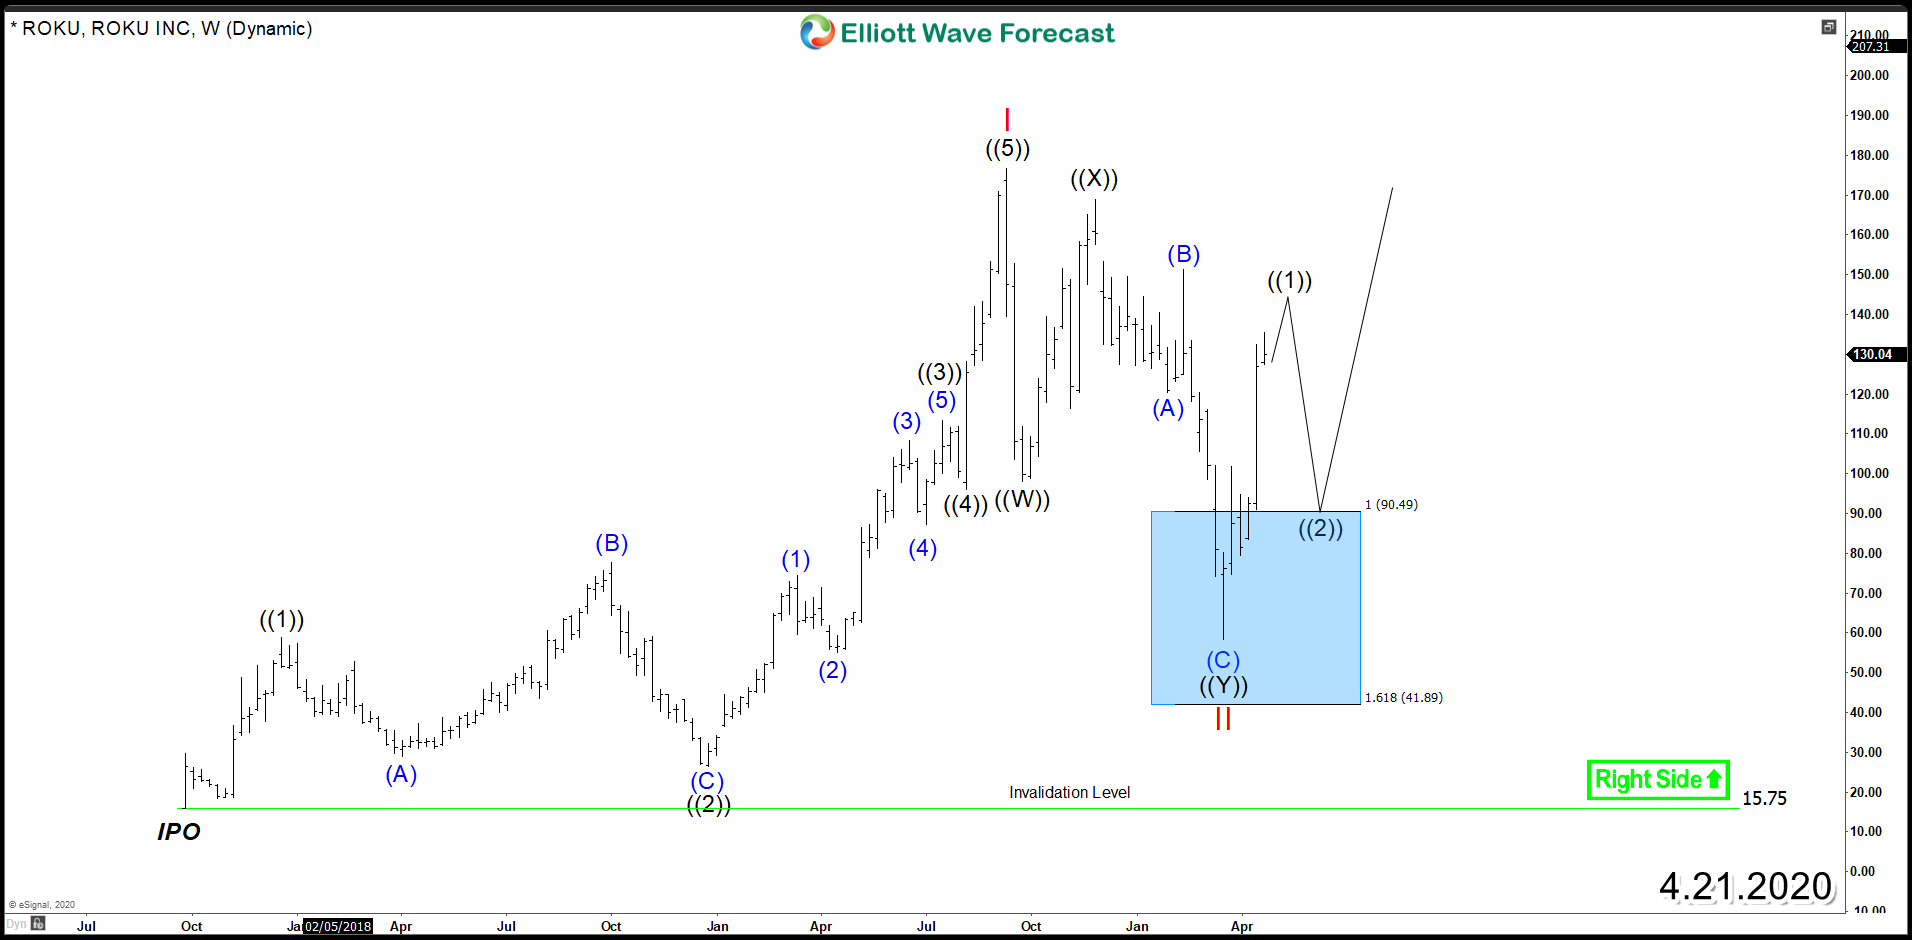
ROKU (NASDAQ:ROKU) – New Bullish Cycle On The Horizon
Read MoreLast year, the streaming TV ROKU (NASDAQ:ROKU) ended the entire rally since IPO as an impulsive 5 waves advance which is a bullish structure followed by a Double Three corrective structure. Based on the Elliott Wave Theory, after an instrument ends the correction it will either resume the rally within the main trend or bounce in 3 […]
-

Elliott Wave View: SPY Looking for Pullback Soon
Read MoreShort Term Elliott Wave view in S&P 500 ETF (SPY) suggests the rally from March 23, 2020 low low is unfolding as a 5 waves impulse. Up from 3.23 low (218.26), wave (1) ended at 263.7, and pullback in wave (2) ended at 242.94. Index has resumed higher in wave (3) as another 5 waves […]
-

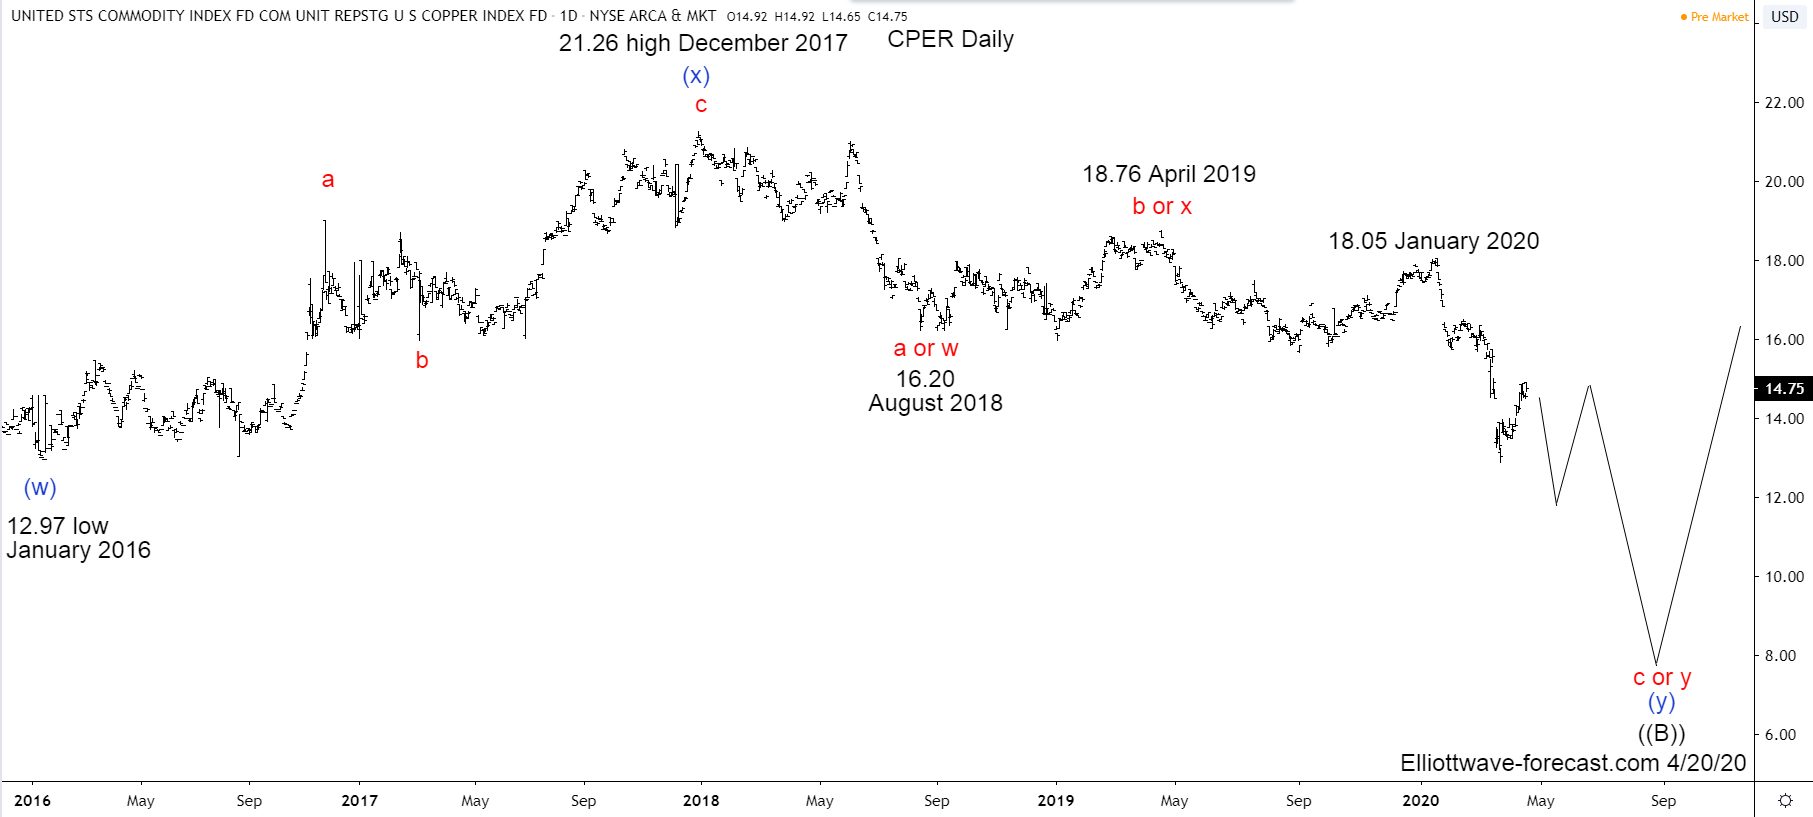
$CPER Copper Index Tracker Elliott Wave & Long Term Cycles
Read More$CPER Copper Index Tracker Elliott Wave & Long Term Cycles Firstly the CPER Copper Index Tracking instrument has an inception date of 11/15/2011. There is data in the HG_F copper futures before this going back many years. That shows copper made an all time high on February 15th, 2011 at 4.649. Translated into this instrument, it […]