
The Power of 3-7-11 and the Grand Super Cycle: How We Saw the Bullish Turn in April 2025 Back on April 9, 2025, while World Indices were dropping sharply and global sentiment had turned overwhelmingly bearish, we published an article that challenged the fear-driven narrative. We explained why selling was not the right approach and […]
-

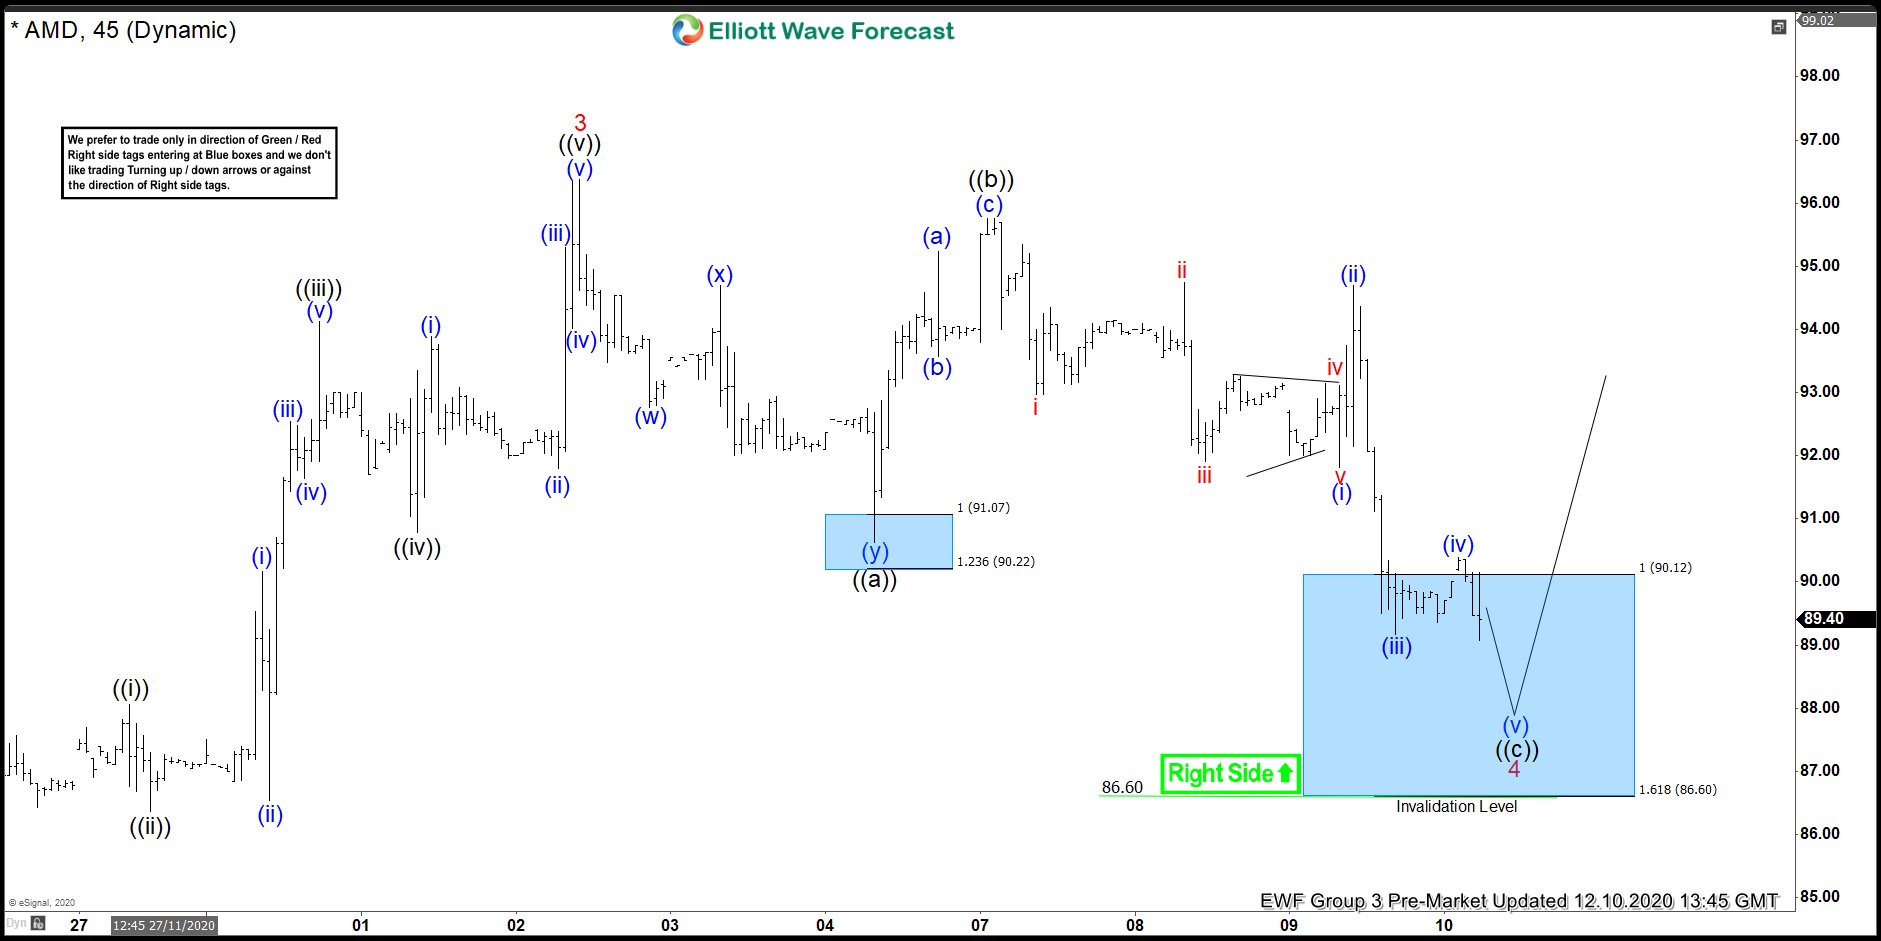
AMD Resuming Higher After Ending Flat Correction
Read MoreIn this blog, we take a look at the past performance of 1 hour Elliott Wave charts of AMD In which our members took advantage of the blue box areas.
-

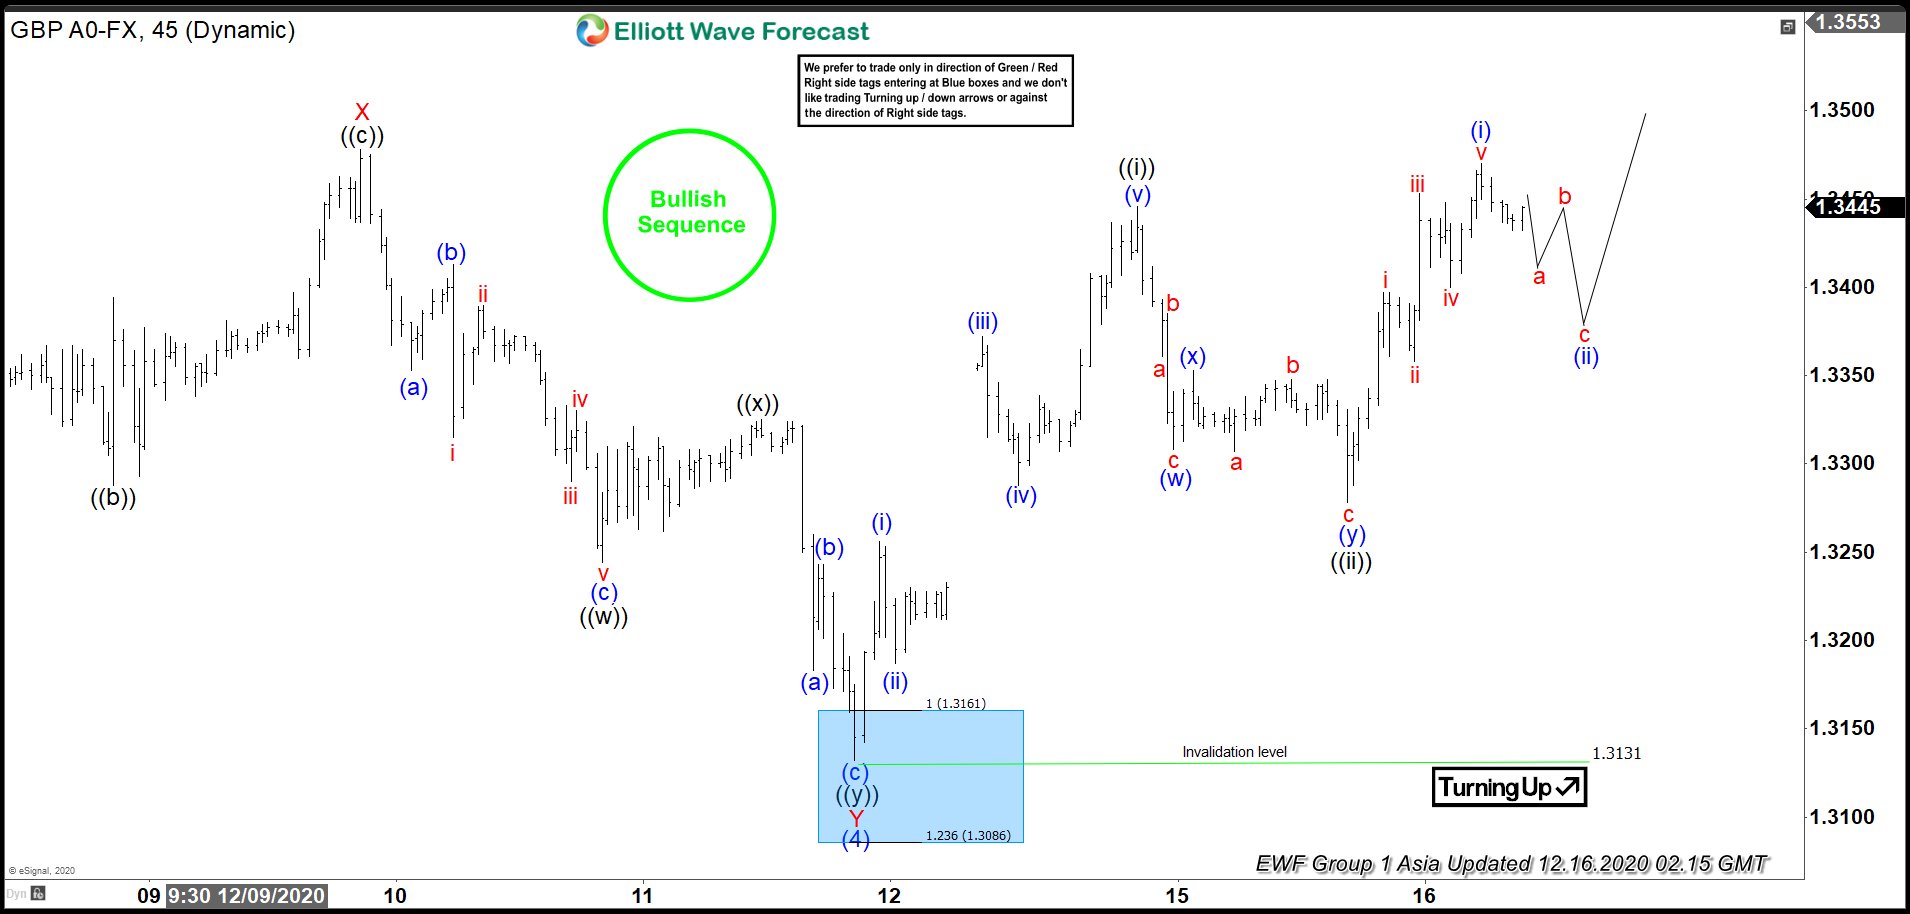
Elliott Wave View: GBPUSD Bullish Sequence Favors More Upside
Read MoreGBPUSD shows incomplete bullish sequence from March 20 low favoring more upside. This article and video look at the Elliott Wave path.
-

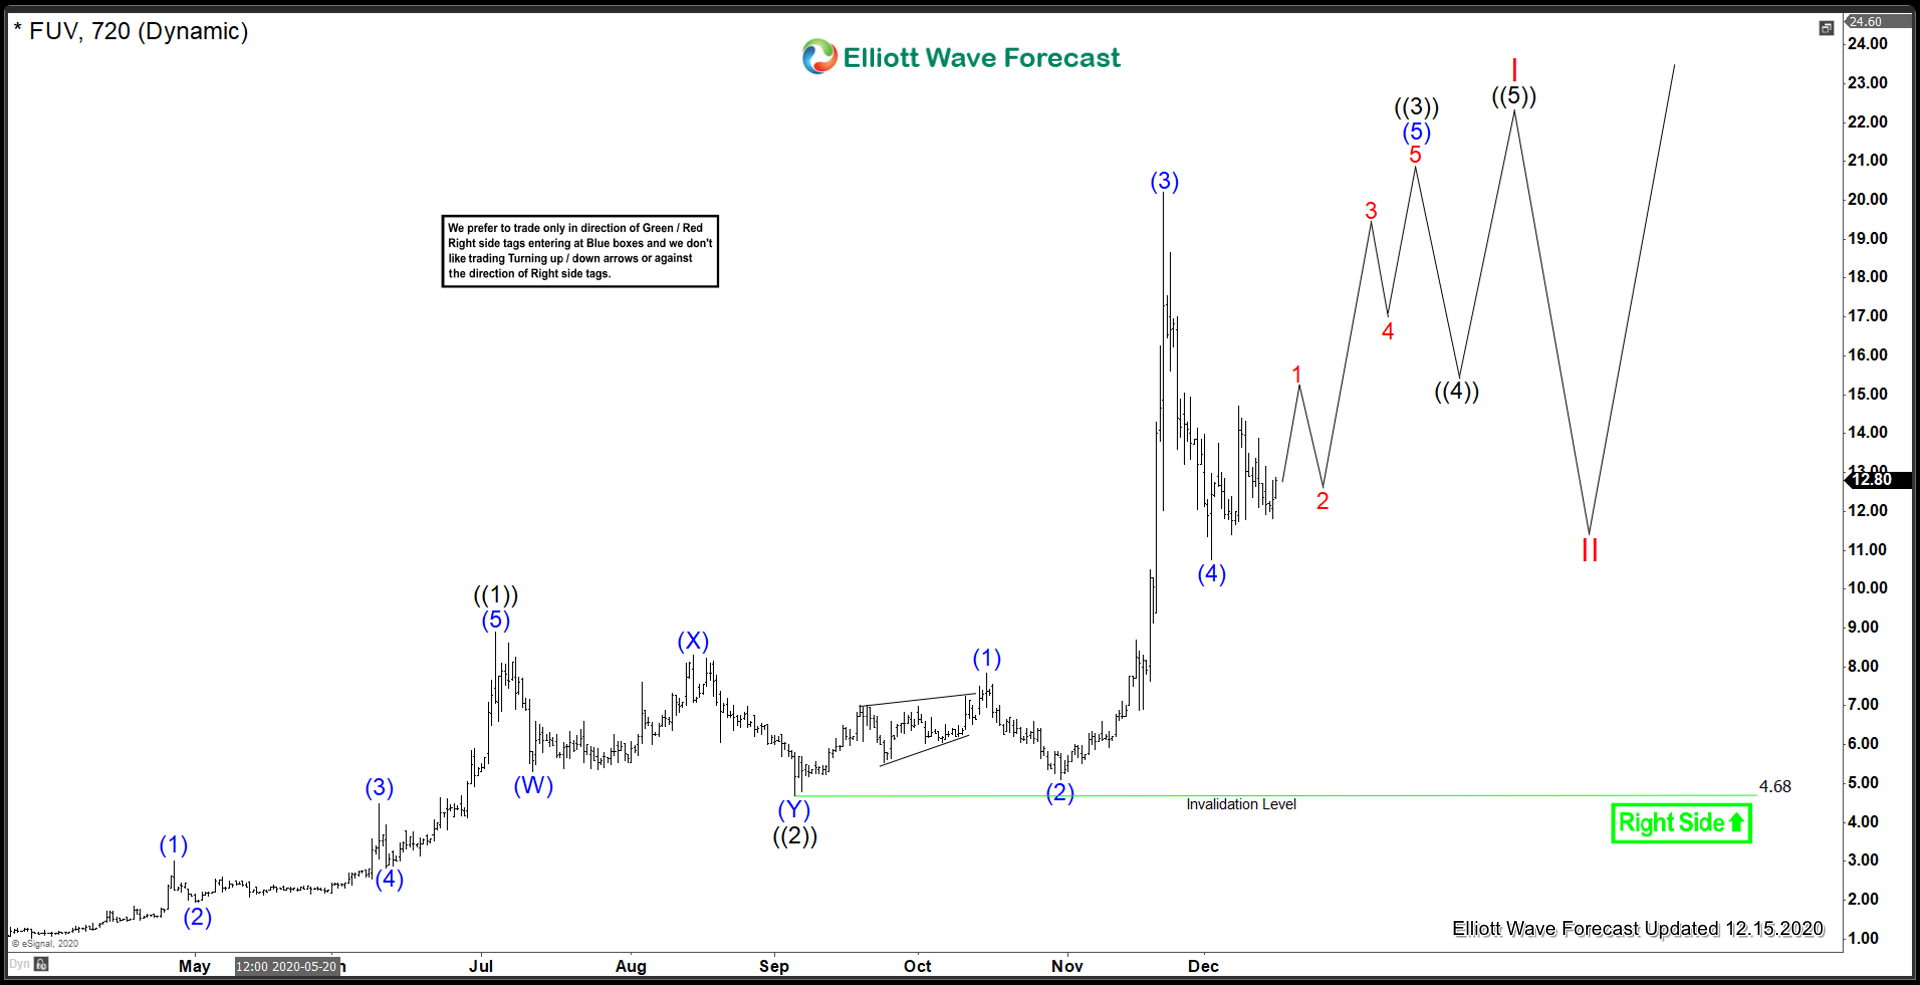
Arcimoto ($FUV) Bullish Trend Intact
Read MoreArcimoto off the March 2020 low has been on an amazing rally. With the stock price rallying from $1 to $20, it has enjoyed a 2000% gain in under a year. Arcimoto is an electric vehicle company headquartered in Eugene, Oregon. Arcimoto manufactures and sells the Fun Utility Vehicle, or FUV, a tandem two-seat, three-wheeled electric vehicle. They […]
-

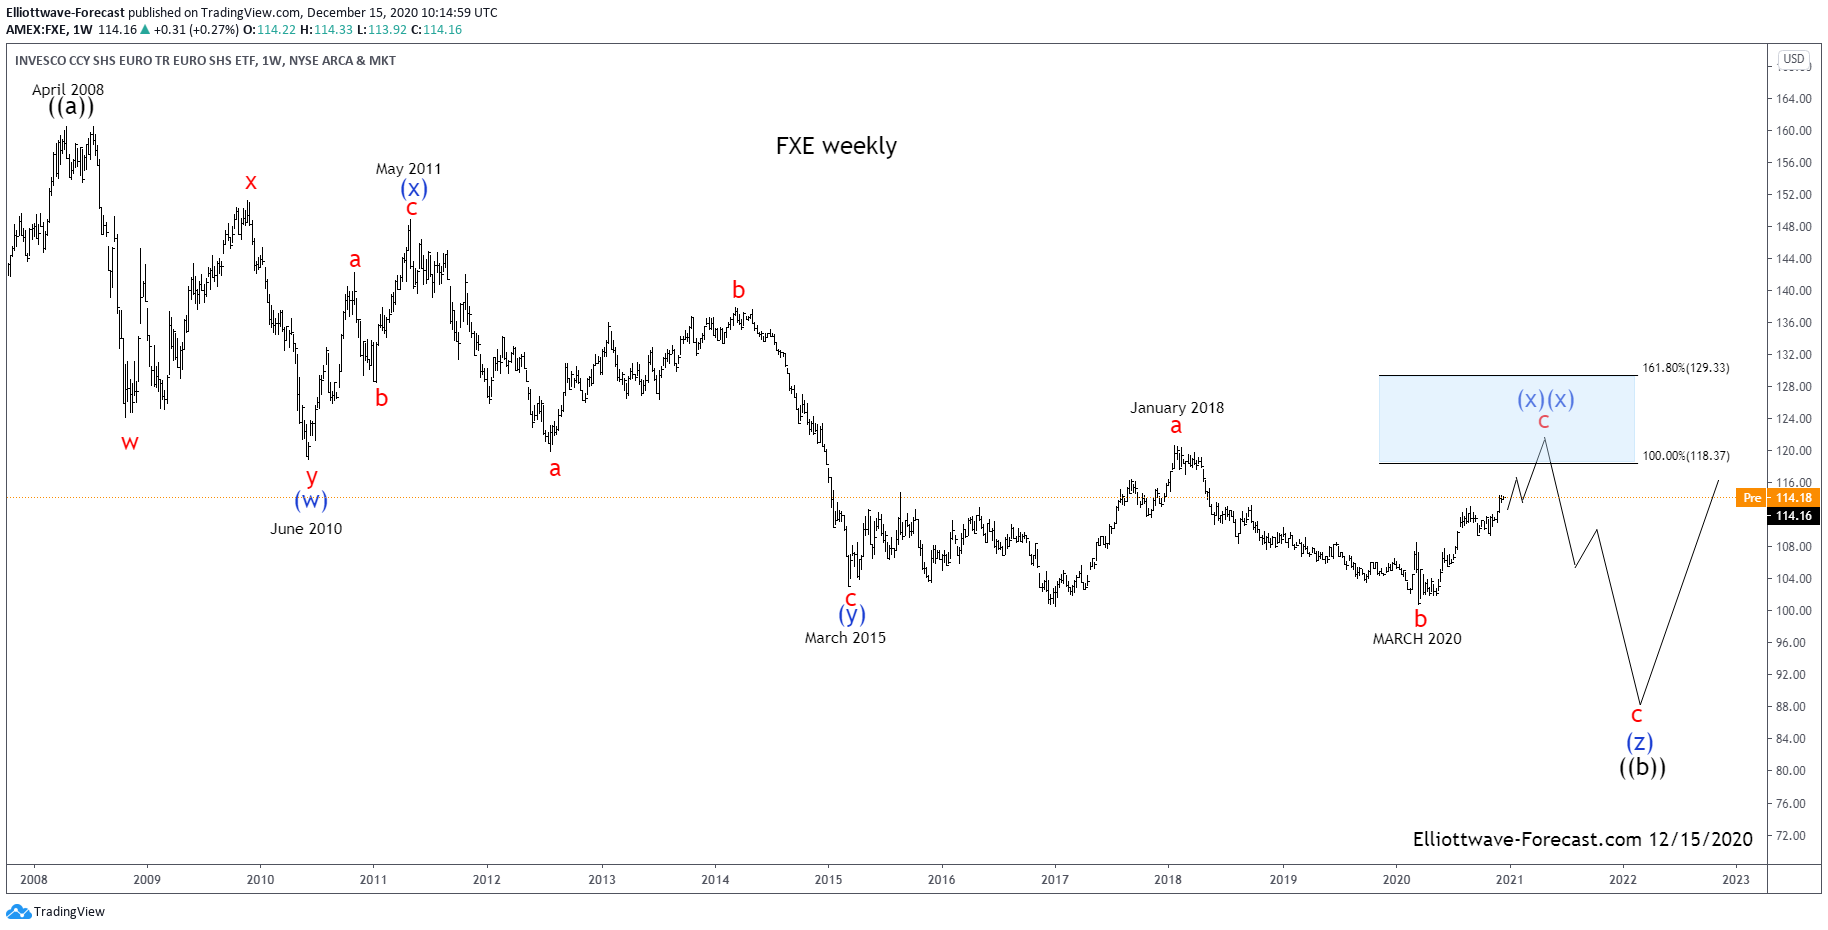
$FXE Long Term Cycle and Elliott Wave
Read More$FXE Long Term Cycle and Elliott Wave Firstly as seen on the weekly chart shown below the instrument made a high in April 2008. There is data back to December 2005 in the ETF fund. Data correlated in the EURUSD foreign exchange pair suggests the high in April 2008 was the end of a cycle up […]