
The Power of 3-7-11 and the Grand Super Cycle: How We Saw the Bullish Turn in April 2025 Back on April 9, 2025, while World Indices were dropping sharply and global sentiment had turned overwhelmingly bearish, we published an article that challenged the fear-driven narrative. We explained why selling was not the right approach and […]
-

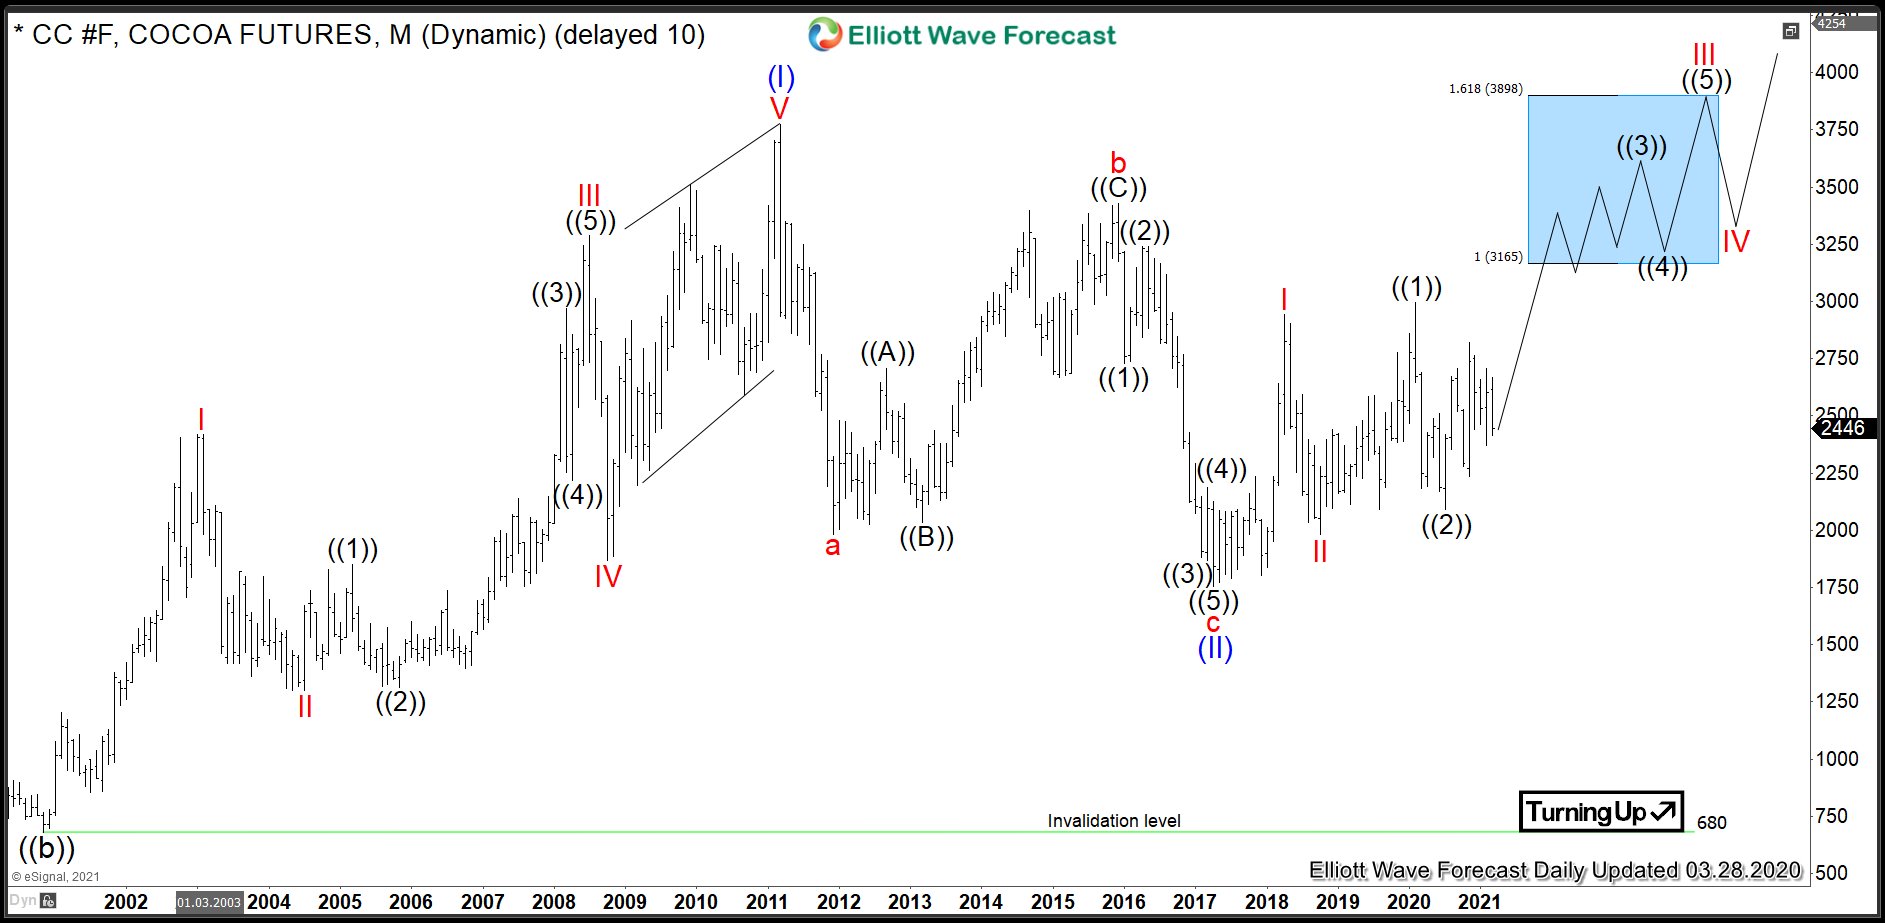
$CC #F: Bullish Sequence to Push Cocoa Prices Higher
Read MoreCocoa (or cocoa bean) is one of soft commodities, along with sugar, coffee, orange juice and cotton. The bean is the fully dried and fermented seed, wherefrom cocoa solids and cocoa butter can be extracted. Cocoa beans are the basis of the chocolate. One can trade Cocoa futures at ICE owned New York Board of […]
-

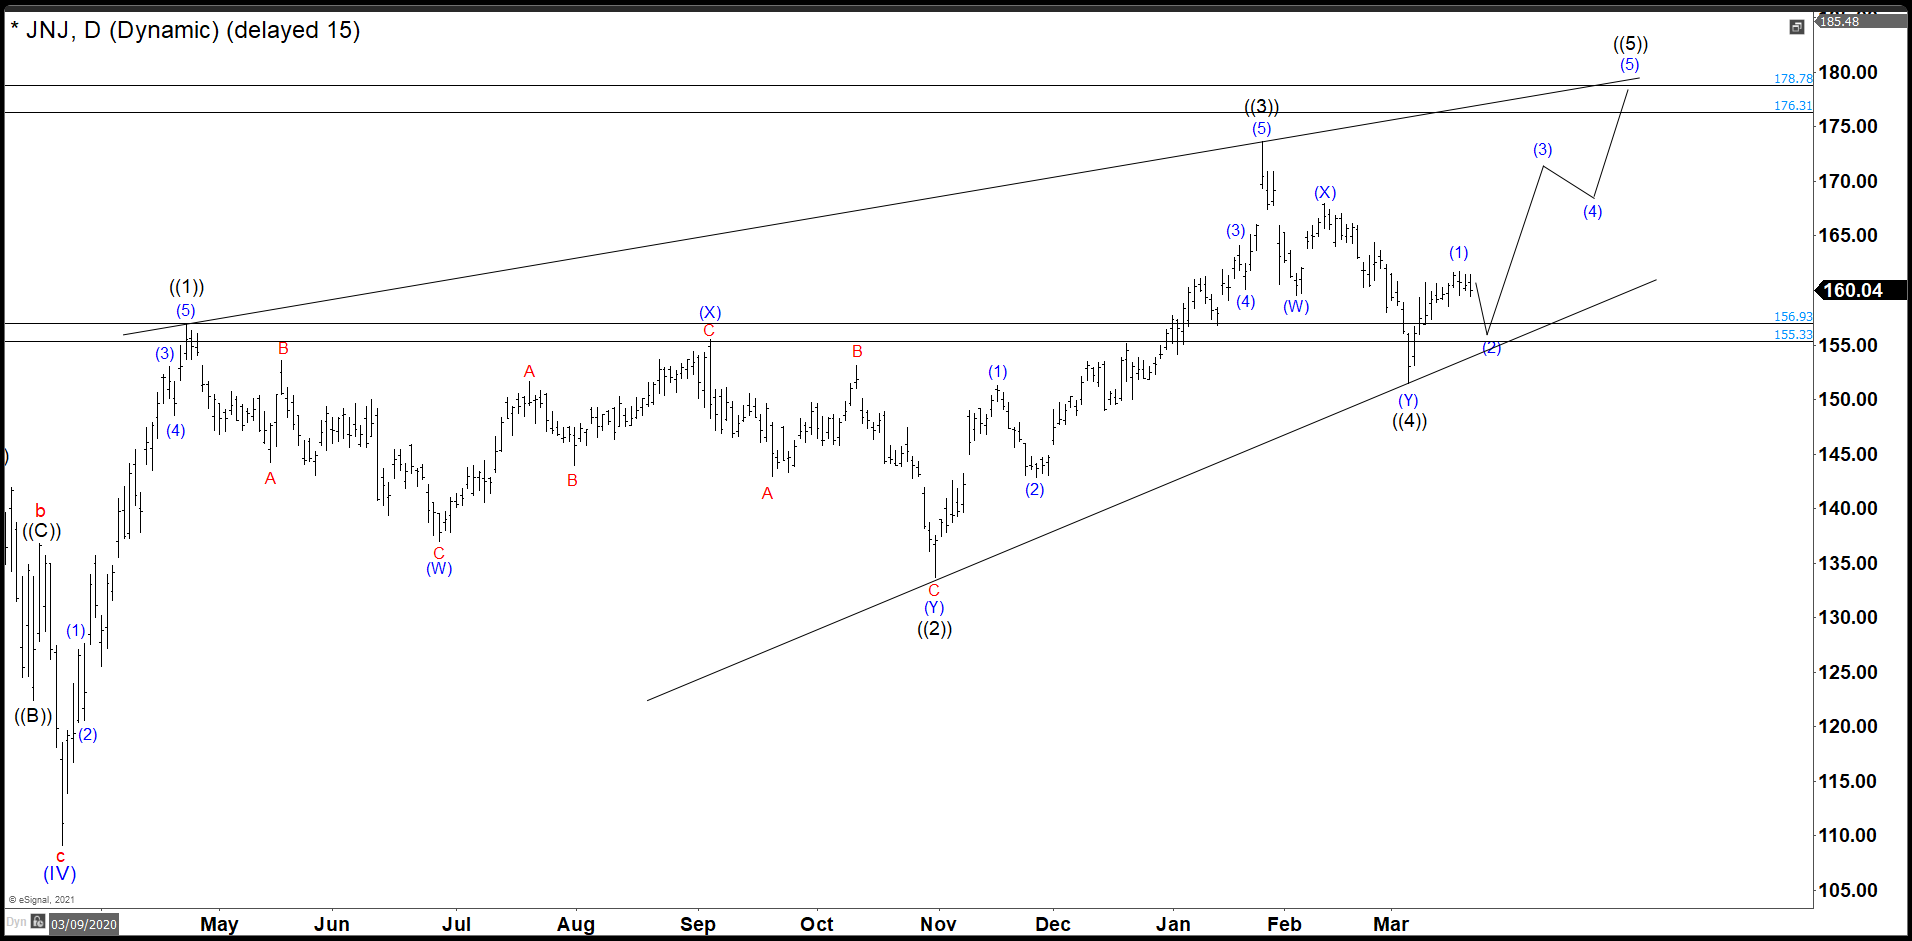
JNJ Is Near To End A Wedge Structure In Short Term
Read MoreSince the crash of March 2020, all stocks have tried to recover what they lost and JNJ was no exception. Johnson & Johnson did not only recover the lost, but It also reached historic highs. Now, we are going to try to build a wedge from the March 2020 lows with a target above $176. […]
-

The 10 Best Stock Trading Apps in 2024
Read MoreMany old-school investors worldwide are considered long-term investors, and they park their monetary assets and cash values in some boring mutual funds and let it simmer for medium to long term bias. In the last decade, there has been a significant shift in active stock trading and long-term investments. Some investors now like to have […]
-

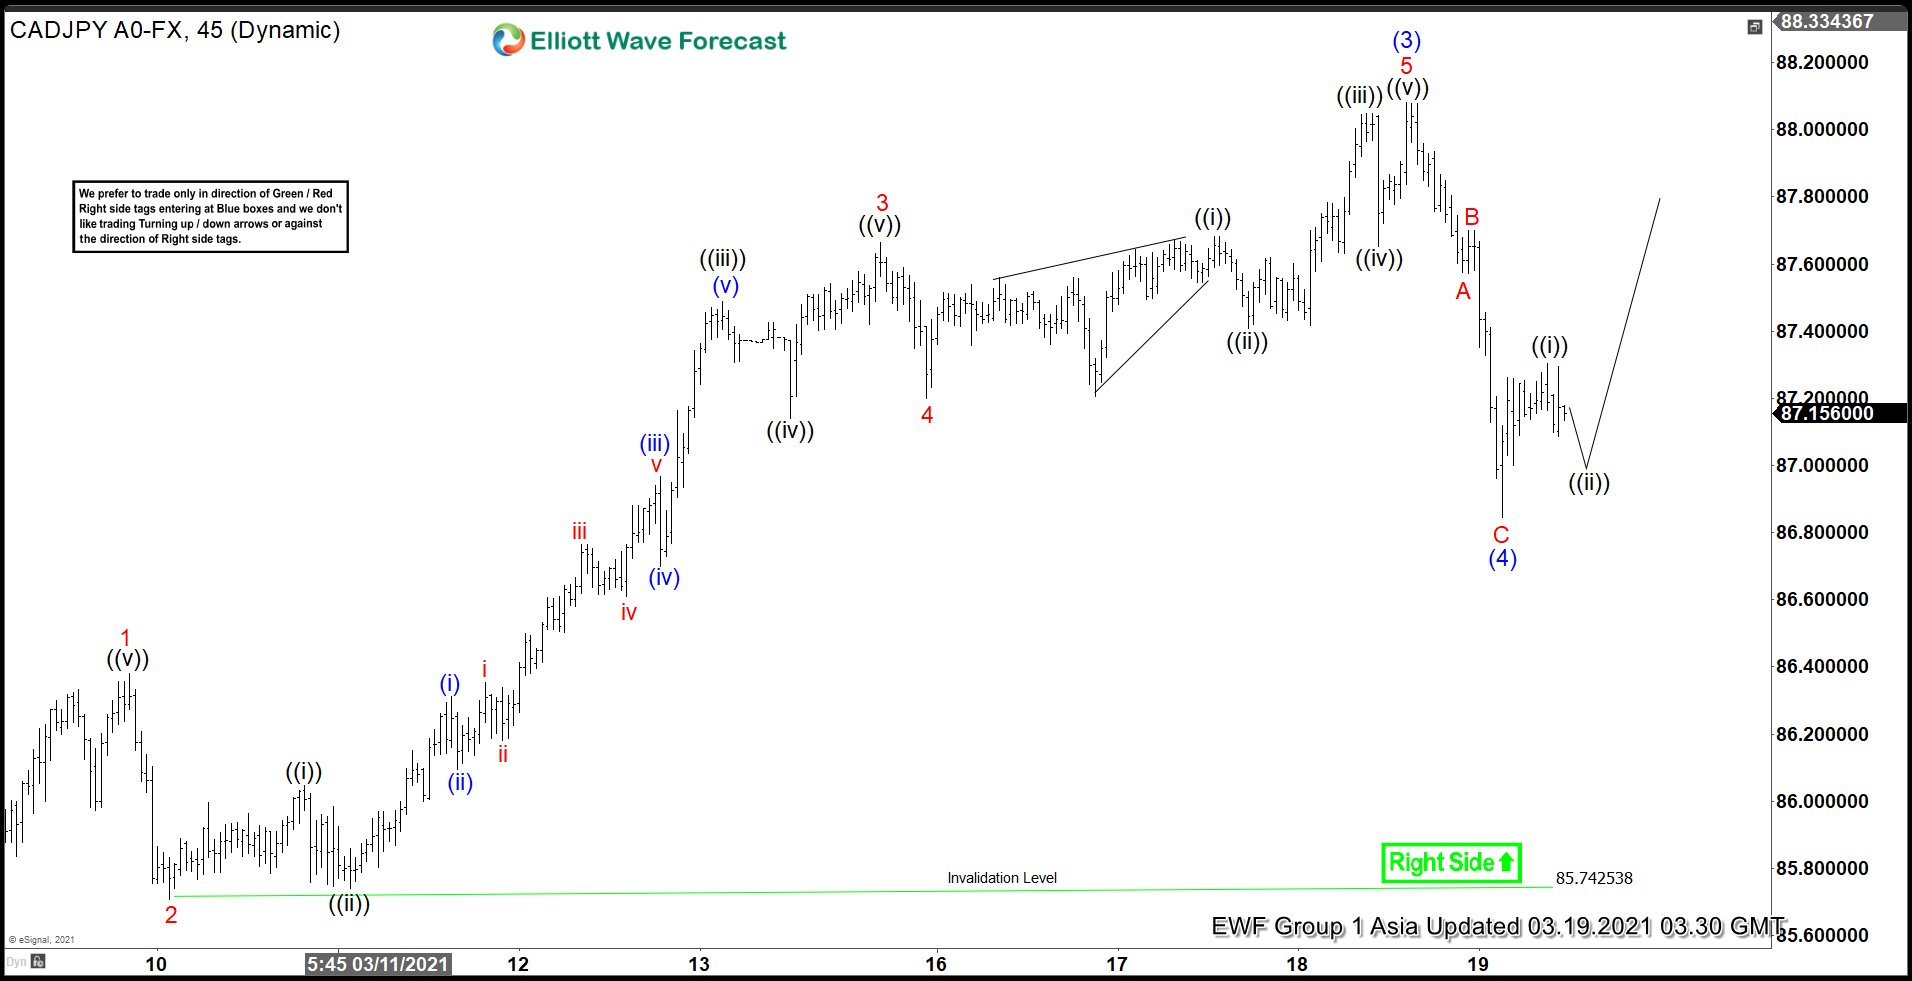
Elliott Wave View: CADJPY Upside Remains Favored
Read MoreCADJPY rally in an impulsive structure and structure is likely incomplete due to lack of divergence. This article and video look at the Elliott Wave path.