

The Power of 3-7-11 and the Grand Super Cycle: How We Saw the Bullish Turn in April 2025 Back on April 9, 2025, while World Indices were dropping sharply and global sentiment had turned overwhelmingly bearish, we published an article that challenged the fear-driven narrative. We explained why selling was not the right approach and […]
-
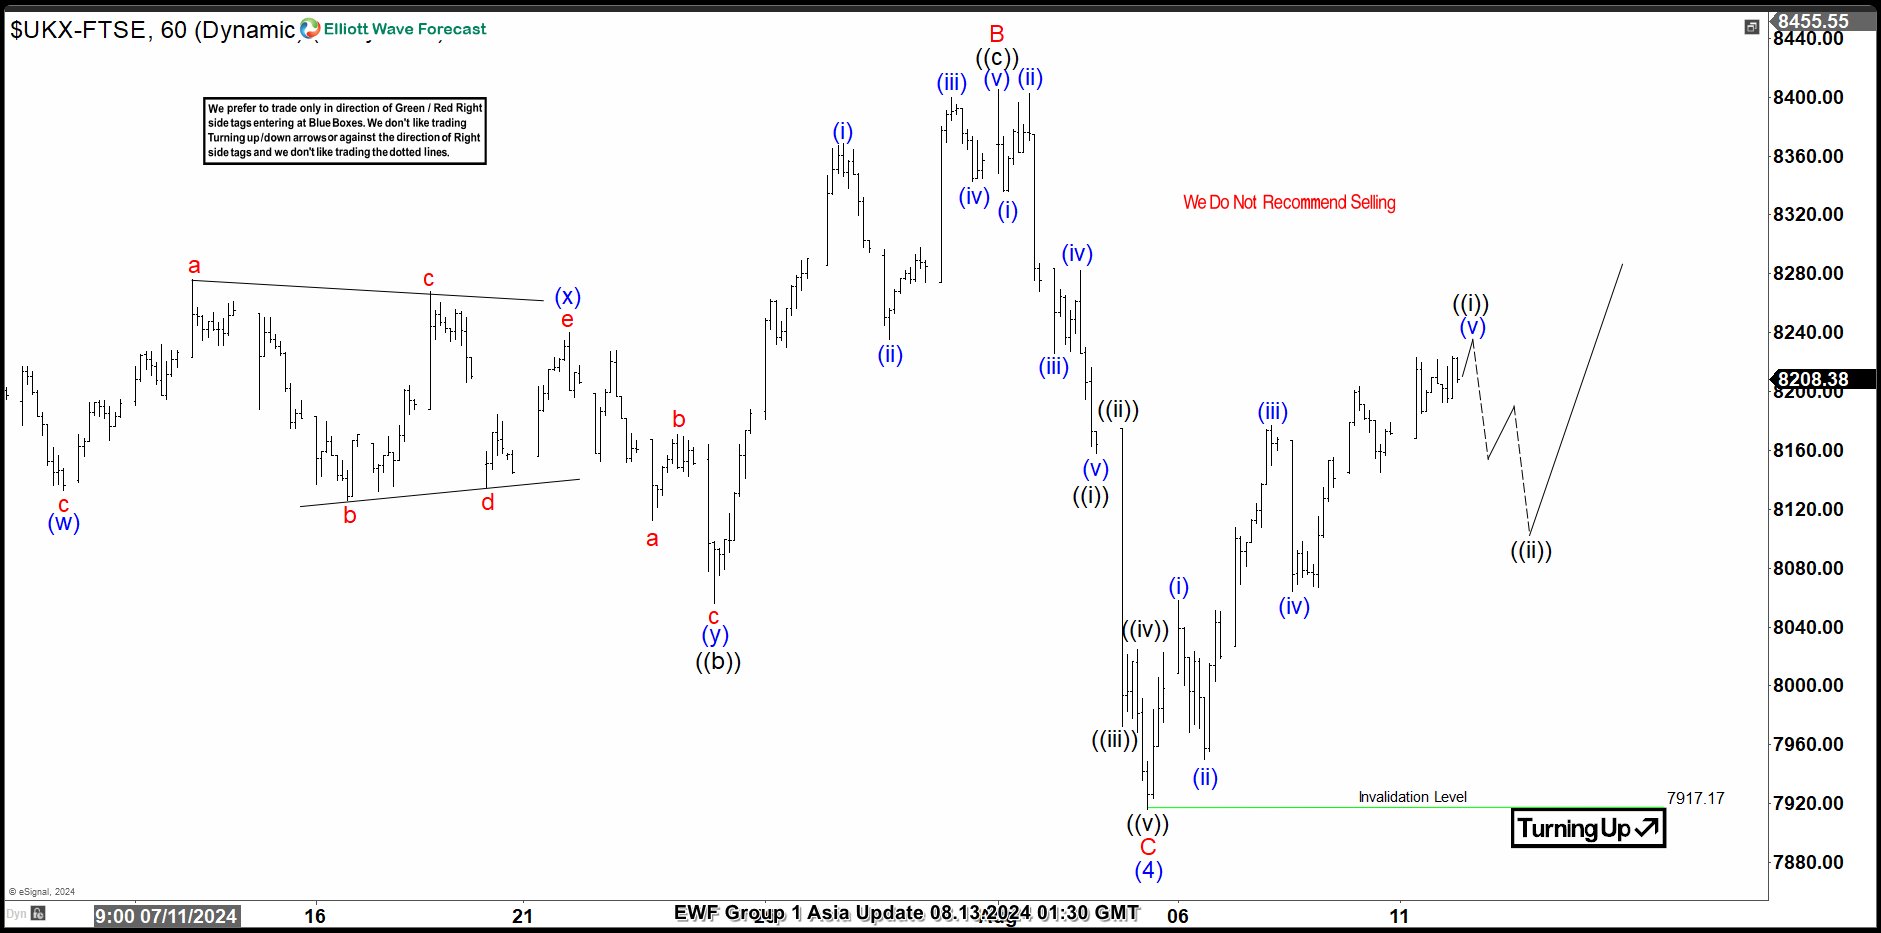
Elliott Wave Intraday Analysis: FTSE should Continue Higher
Read MoreShort Term Elliott Wave in FTSE suggests that the index has completed a bearish sequence from 5.15.2024 high. The decline made a zig zag Elliott Wave structure. Down from 5.15.2024 high, wave A ended at 8106.79 low. Rally in wave B ended at 8405.24 high with internal subdivision as an expanded flat structure. Up from […]
-
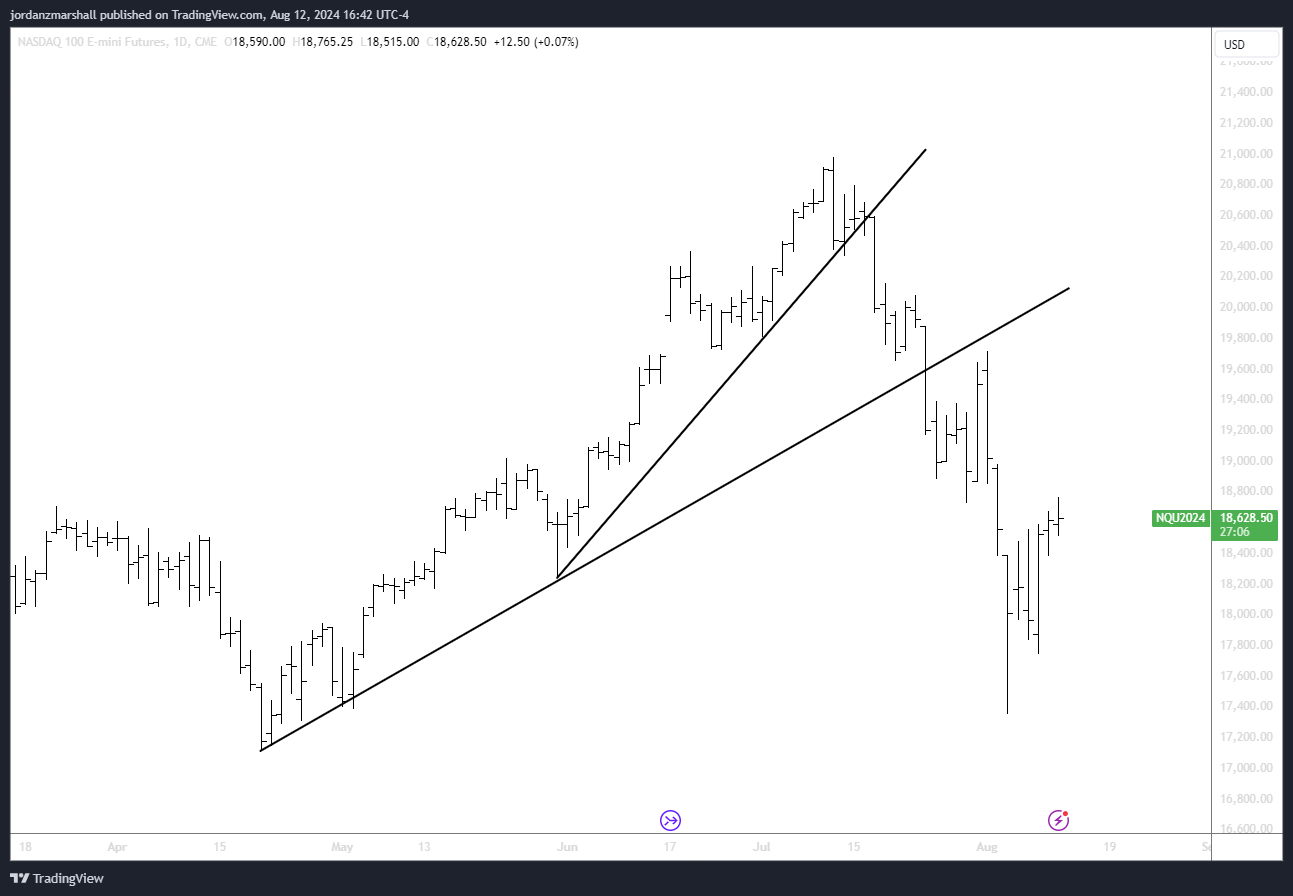
Trendline Basics – A Critical Market Tool
Read MoreWhy trendlines? One thing I’ve found through my past years as a trader and market analyst is the importance of using a trendline. These simple tools can really help make or break your trading, and often signal a larger move to come. I’ve met traders who ONLY use trendlines, and they have made massive profits […]
-
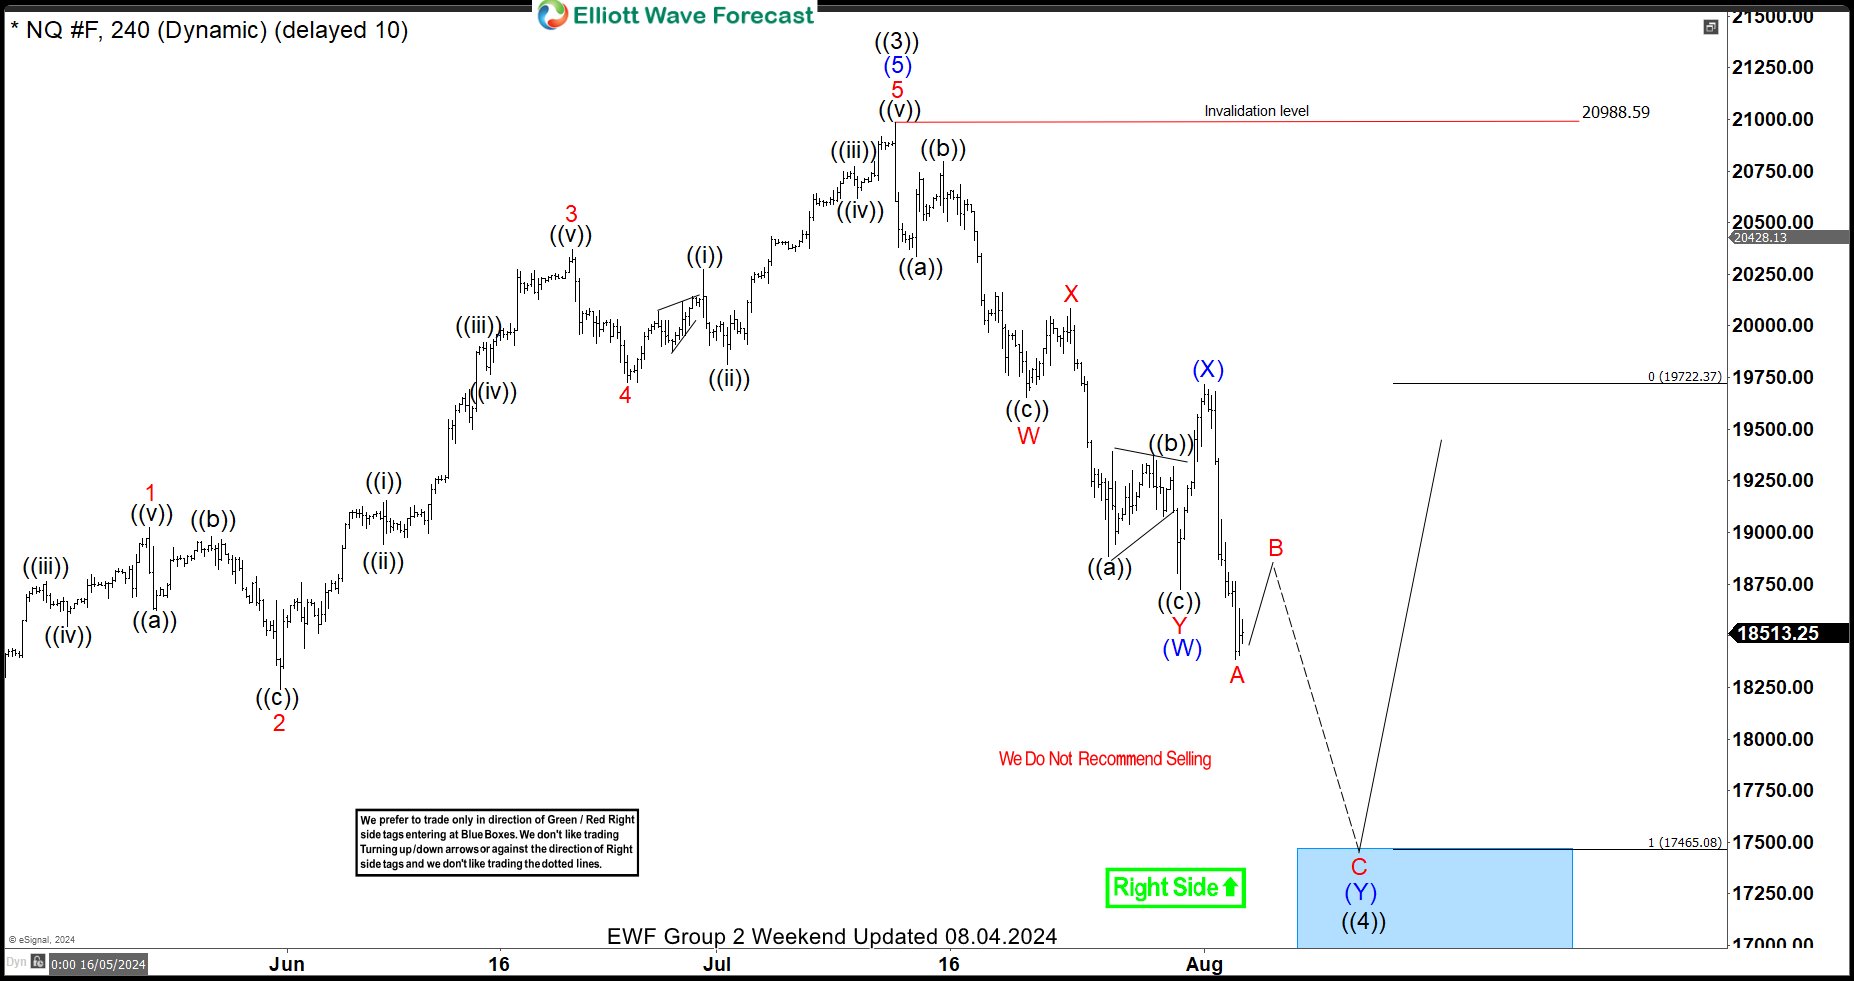
NASDAQ (NQ_F) Nice Reaction Higher From Blue Box Area
Read MoreIn this blog, we take a look at the past performance of NASDAQ (NQ_F) charts. The index is showing a very nice reaction higher from the blue box area.
-
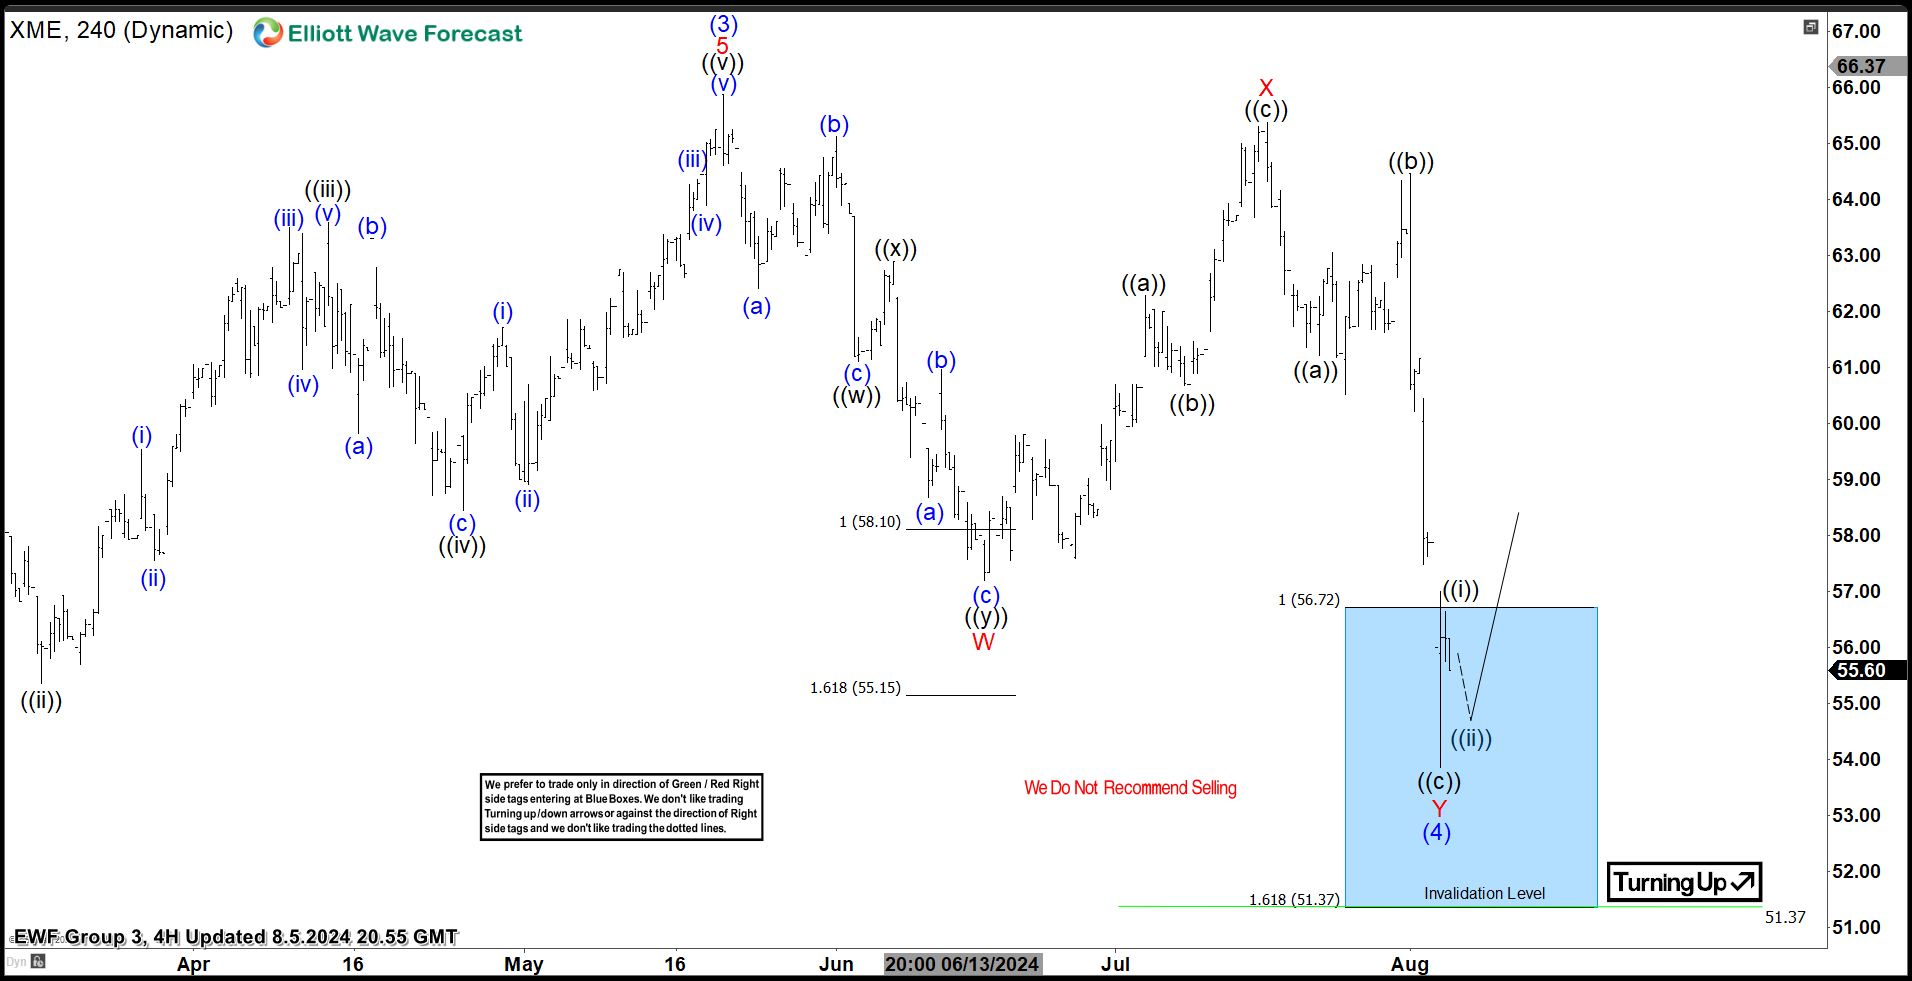
SPDR Metals & Mining ETF ( $XME ) Found Buyers At The Blue Box Area.
Read MoreHello everyone. In today’s article, we will look at the past performance of the 4H Hour Elliott Wave chart of SPDR Metals & Mining ETF ($XME). The rally from 5.31.2023 low unfolded as 5 waves impulse. So, we expected the pullback to unfold in 7 swings and find buyers again. We will explain the structure […]