

The Power of 3-7-11 and the Grand Super Cycle: How We Saw the Bullish Turn in April 2025 Back on April 9, 2025, while World Indices were dropping sharply and global sentiment had turned overwhelmingly bearish, we published an article that challenged the fear-driven narrative. We explained why selling was not the right approach and […]
-

-
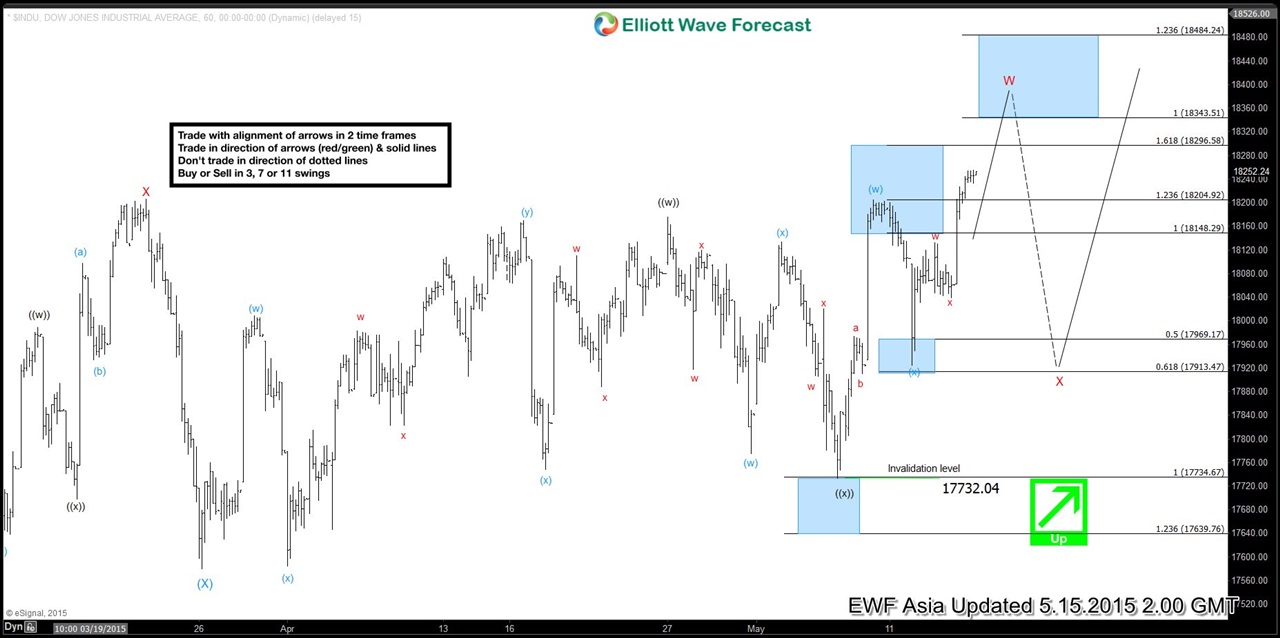
Dow Jones (INDU) Elliott Wave Chart of the Day Summary Week 5.11.2015 – 5.15.2015
Read MoreBelow is a recap of our Chart of The Day for Dow Jones (INDU) for the week of 5/11/2015 – 5/15/2015: Dow Jones (INDU) Chart of The Day posted at 5/12/2015 In our Chart of The Day at 5/12/2015, we said wave (x) pullback is in progress and expected to complete at 17843.94 – 17969.54. As […]
-

$GBP/USD Short Term Elliott Wave Analysis 5.14.2015
Read MoreDecline to 1.5086 completed wave (X), and rally from this level is taking the form of a double correction ((w))-((x))-((y)) where wave ((w)) ended at 1.5523 and wave ((x)) ended at 1.5351. Wave ((y)) of W is already at inflection (turning) area, so although it has met the minimum requirement for completion, a marginal high can’t be ruled […]
-

Dow Jones (INDU) Short Term Elliott Wave Update 5.13.2015
Read MoreDecline to 17732.04 completed wave X and the Index has since moved higher. From wave X low, the rally took the form of a zigzag a-b-c, where wave a ended at 17973.07, wave b ended at 17910.15, and wave c of (w) completed at 18205.23. In our last Chart of The Day update, we said that wave (x) pullback is in progress towards […]