

The Power of 3-7-11 and the Grand Super Cycle: How We Saw the Bullish Turn in April 2025 Back on April 9, 2025, while World Indices were dropping sharply and global sentiment had turned overwhelmingly bearish, we published an article that challenged the fear-driven narrative. We explained why selling was not the right approach and […]
-
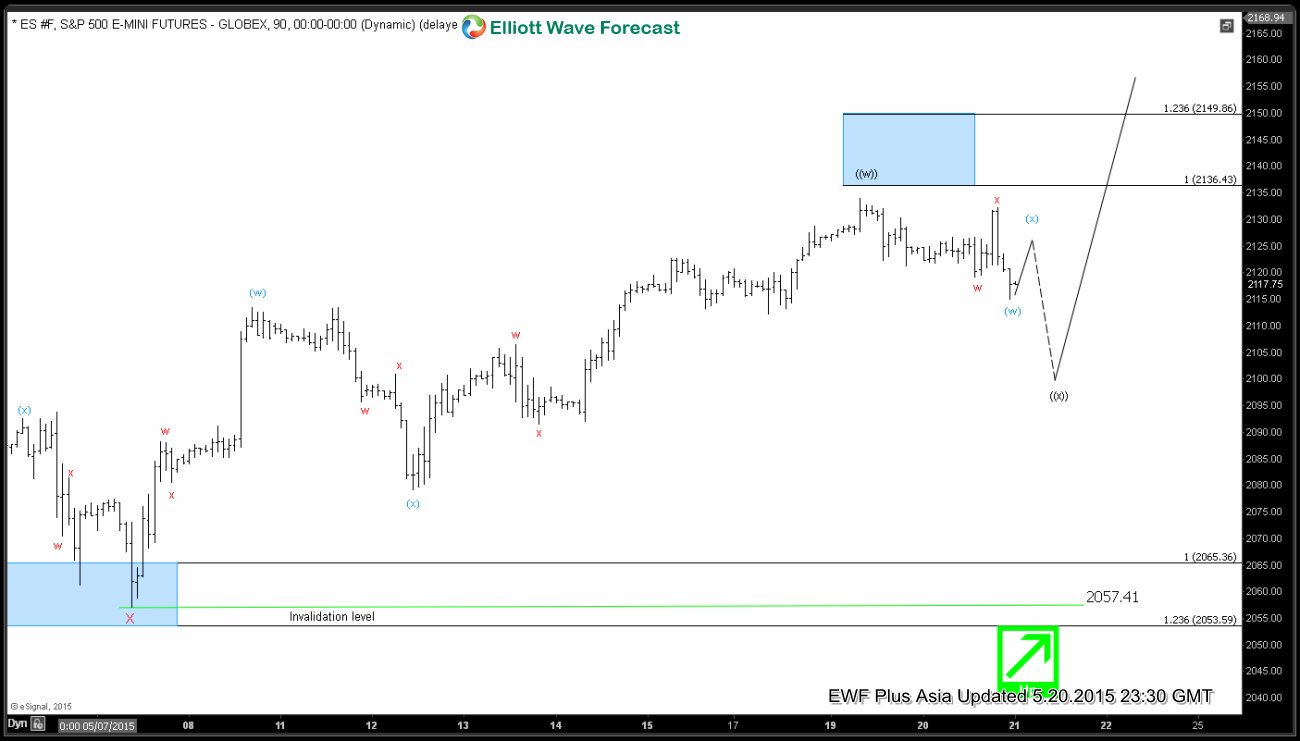
S&P E-Mini (ES_F) Short Term Elliott Wave Update 5.21.2015
Read MoreDecline to 2057.41 completed wave X. Wave ((w)) rally from this level is unfolding in the form of a double correction (w)-(x)-(y), where wave (w) ended at 2113.5 and wave (x) ended at 2079.25. In our previous Chart of The Day at 5/19/2015, we said the last leg wave (y) is in progress towards 2136.43 – 2149.86 […]
-
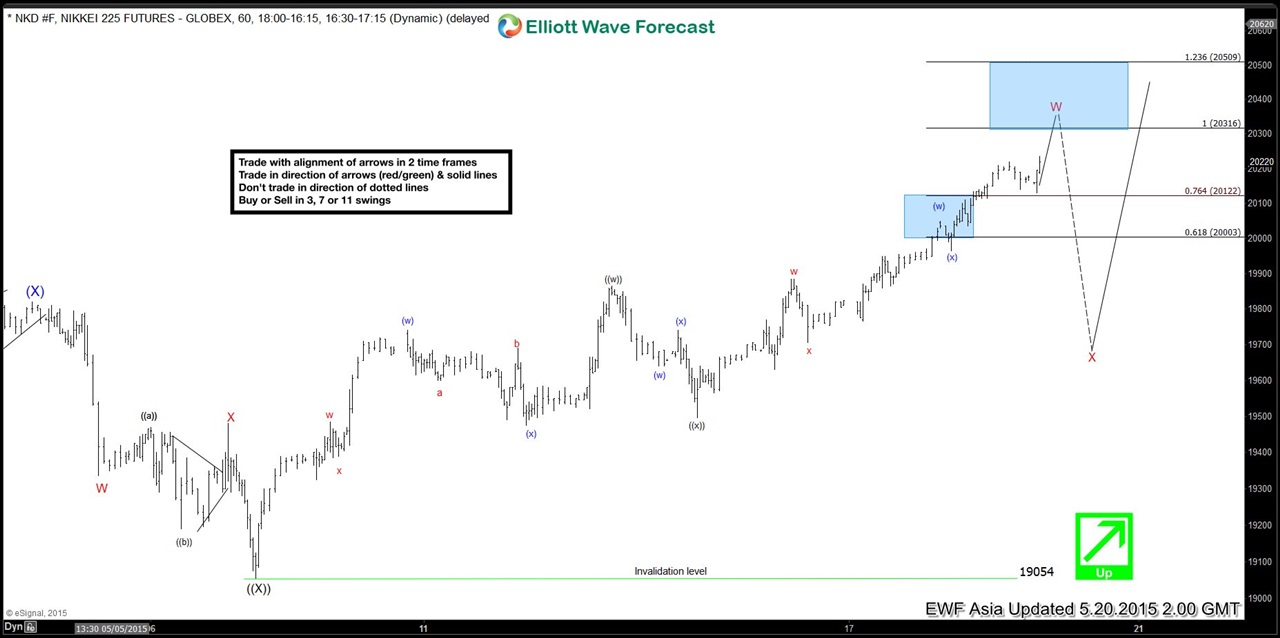
Nikkei 225 Short Term Elliott Wave Analysis 5.20.2015
Read MoreDecline to 19054 completed wave ((X)), and the Index has since resumed the rally in wave W in the form of a double correction ((w))-((x))-((y)) where wave ((w)) ended at 19865, wave ((x)) ended at 19495, and wave ((y)) is in progress towards 20314 – 20507. Expect some profit taking from 20314 – 20507 area and the Index to pullback 3 waves lower […]
-
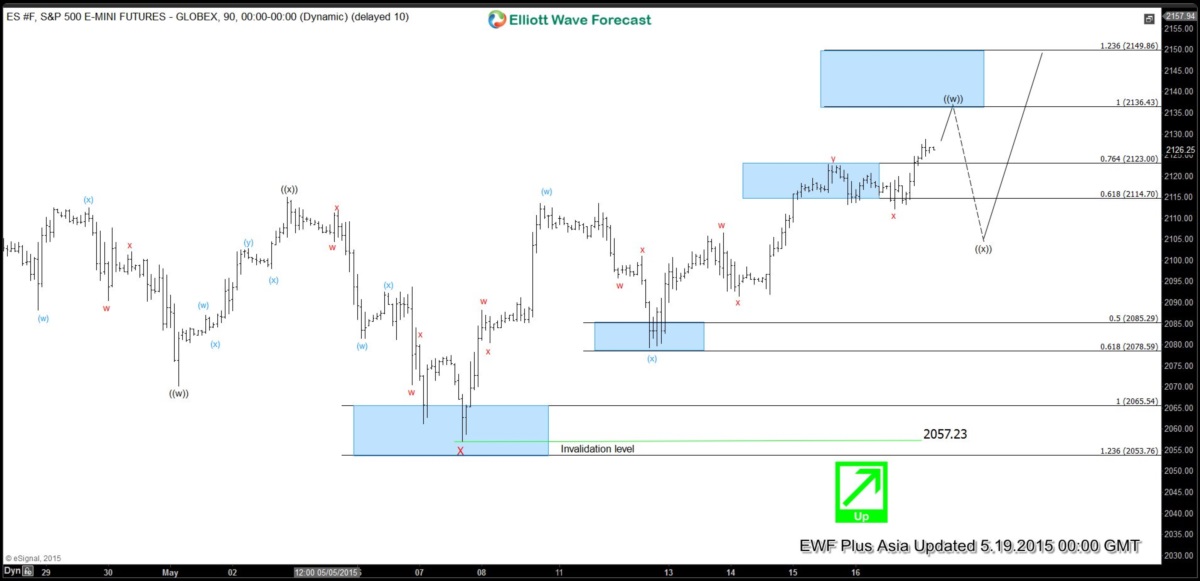
S&P E-Mini (ES_F) Short Term Elliott Wave Analysis 5.19.2015
Read MoreDecline to 2057.23 completed wave X. Wave ((w)) rally from this level is unfolding in the form of a double correction (w)-(x)-(y). Wave (w) of ((w)) took the form of a double correction w-x-y and ended at 2113.5. Wave (x) of ((w)) also took the form of a double correction w-x-y and ended at 2079.25. Wave […]
-

Educational Video Series – Running Flat
Read MoreThere are three different types of Elliott Wave Flat structure: Regular, Irregular / Expanded, and Running Flat. In this video, we will take a look at an example of a Running Flat. Flat is a 3 waves corrective structure labelled as ABC. Internally it is a 3-3-5 structure. Wave A is subdivided into 3 waves […]