
The Power of 3-7-11 and the Grand Super Cycle: How We Saw the Bullish Turn in April 2025 Back on April 9, 2025, while World Indices were dropping sharply and global sentiment had turned overwhelmingly bearish, we published an article that challenged the fear-driven narrative. We explained why selling was not the right approach and […]
-

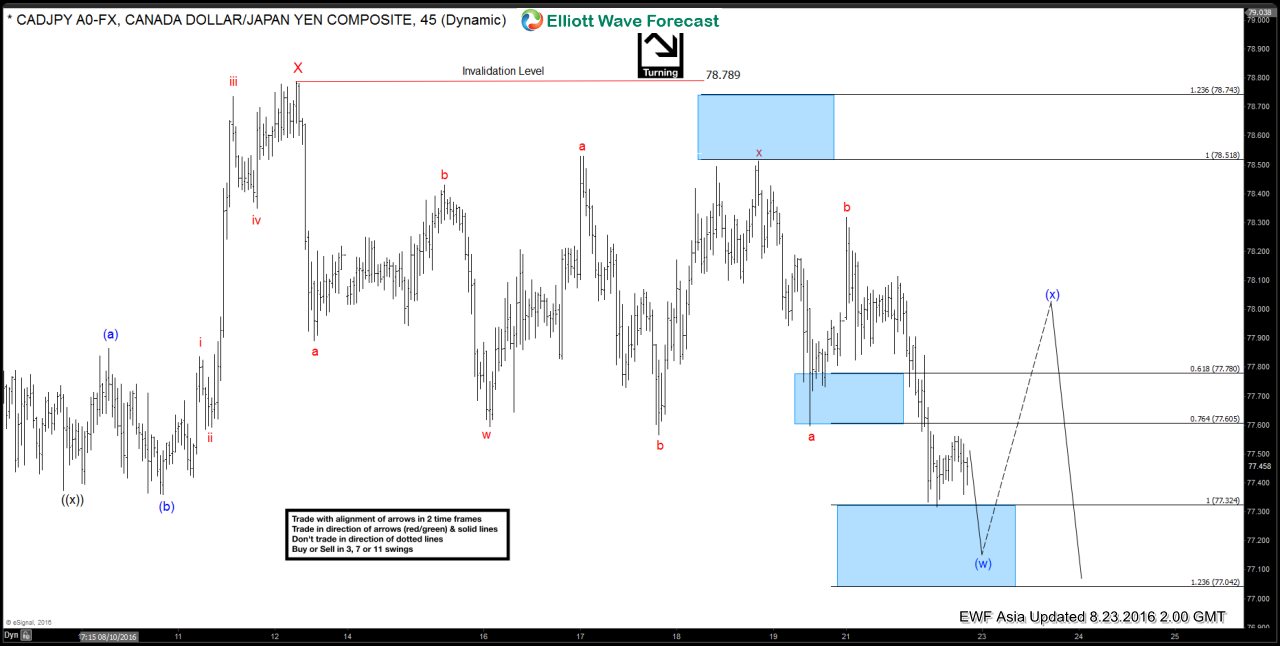
$CADJPY Short-term Elliott Wave Analysis 8.23.2016
Read MorePreferred Elliott wave count suggests that rally to 78.79 ended wave X. Down from there, there’s enough number of swing and extension to call wave (w) completed. After wave (w) is confirmed over, likely from 77 – 77.3 area which it has already reached, then it should bounce in wave (x) before pair resumes lower again. We don’t […]
-

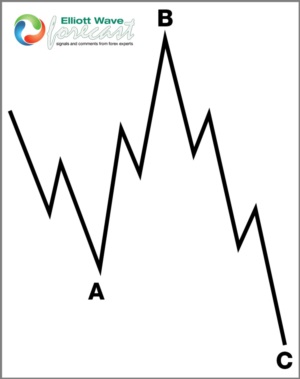
$OIL Expanded flat correction
Read MoreExpanded Elliottwave Flat is a 3 wave corrective pattern which could often be seen in the market. Inner subdivisions are 3, 3, 5 and labelled as A, B, C. Waves A and B have forms of corrective structures like zigzag, flat, double three or triple three. Whereas , wave C is always a 5 waves structure, […]
-

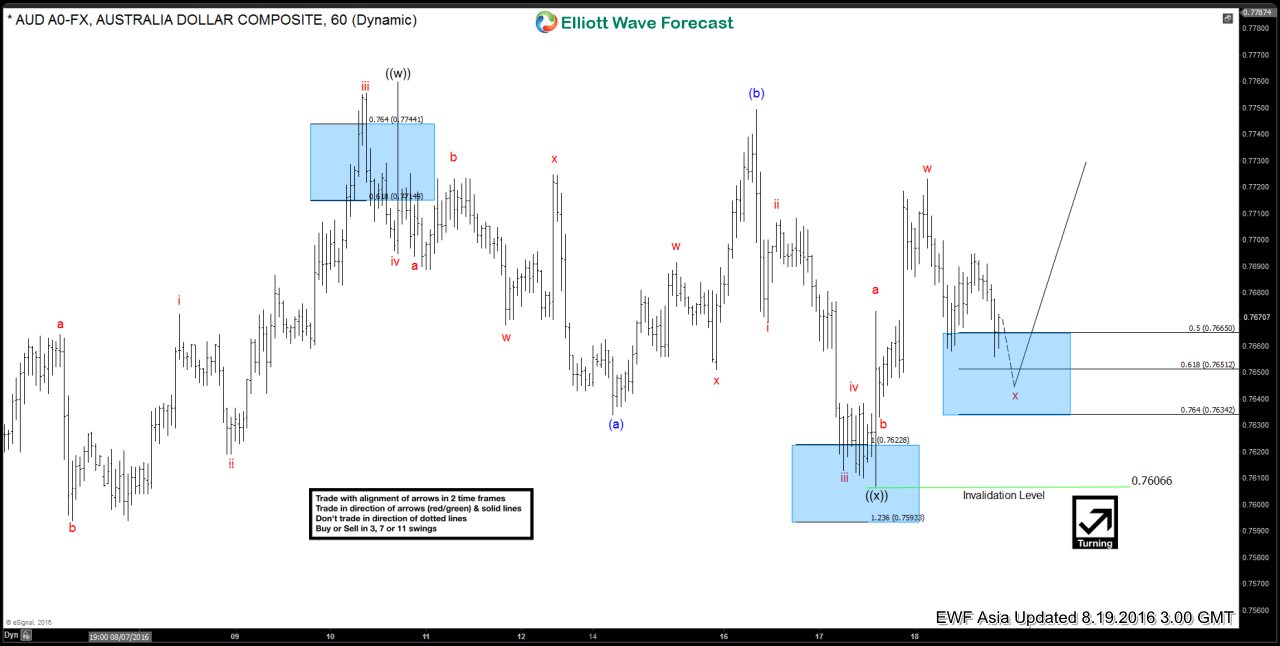
$AUDUSD Short-term Elliott Wave Analysis 8.19.2016
Read MorePreferred Elliott wave count suggests that rally to 0.776 ended wave ((w)) and wave ((x)) pullback is proposed complete at 0.7673. Rally from there is unfolding as a double three where wave w ended at 0.7723 and while wave x pullback stays above 0.7606, expect pair to resume higher. A break below 0.7606 suggests pair can extend lower to 0.7566 – […]
-

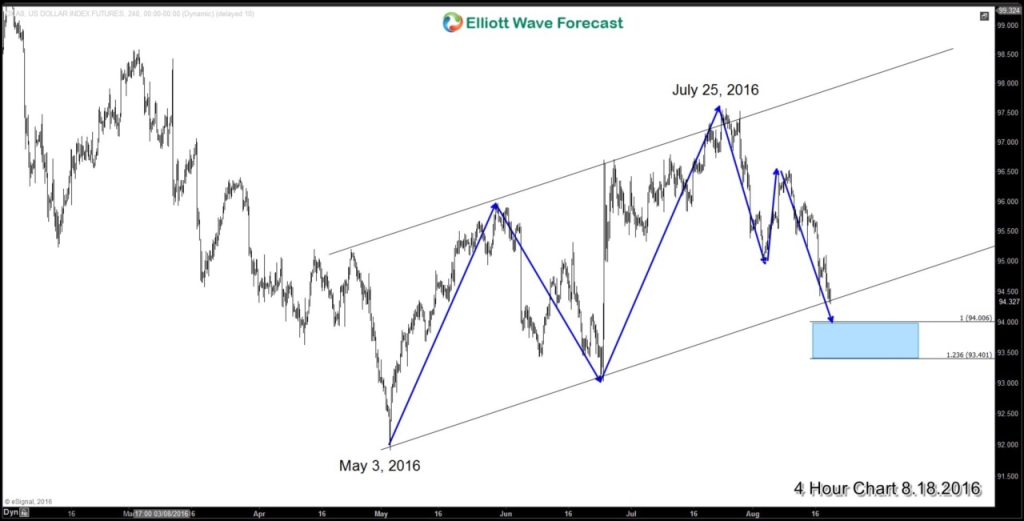
USD may range trade
Read MoreRecent U.S economic data has been mixed. Good data came from the job report, with July’s Non Farm Payroll number came out strong at 217K, which is comfortably beating the market expectation of 170K. Despite the good news, job number has been volatile and unpredictable. Recall that May’s job number only came out at 25K vs 152K consensus […]