
The Power of 3-7-11 and the Grand Super Cycle: How We Saw the Bullish Turn in April 2025 Back on April 9, 2025, while World Indices were dropping sharply and global sentiment had turned overwhelmingly bearish, we published an article that challenged the fear-driven narrative. We explained why selling was not the right approach and […]
-

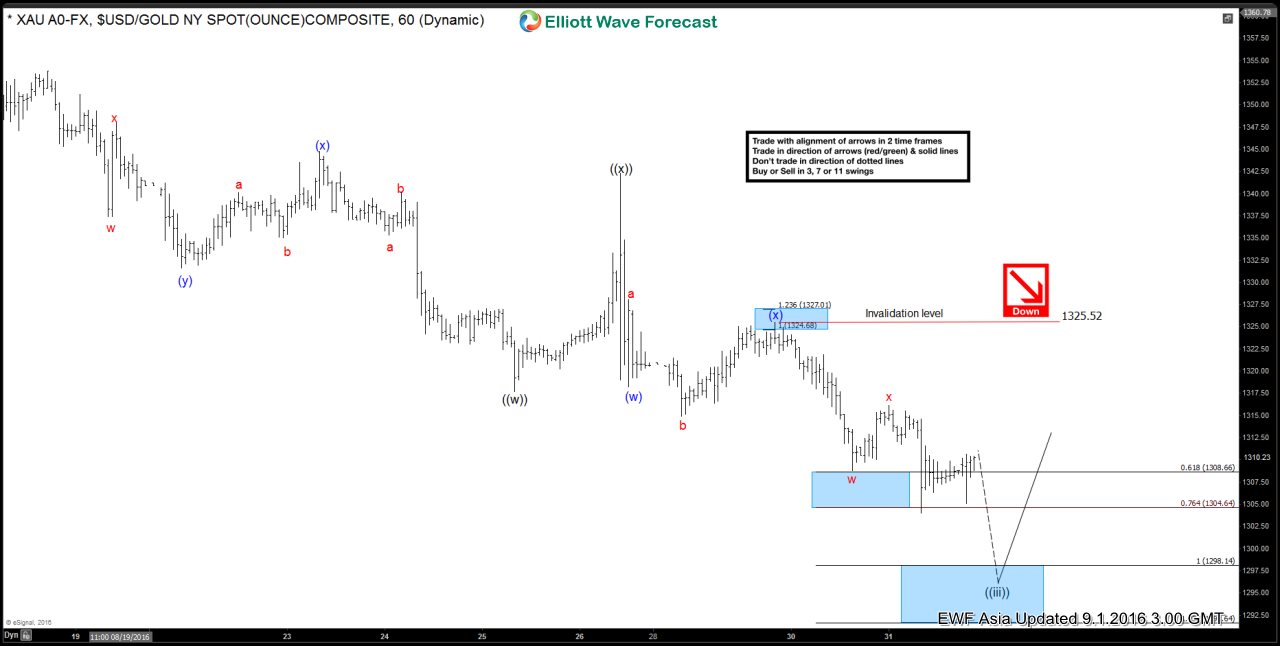
Gold $XAUUSD Short-term Elliott Wave Analysis 9.1.2016
Read MoreShort term Elliott wave count suggests that rally to 1342.26 ended wave ((x)). Decline from there is unfolding as a double three where wave (w) ended at 1318.2 and wave (x) ended at 1325.52. While near term bounce stays below wave x at 1316.13, and more importantly below 1325.52, Gold still has scope to resume lower in […]
-

The importance of a Trading Journal
Read MoreOne of the best practices when it comes to trading is to have a trading journal. Think of a trading journal as your battle plan / strategy. Traders should spend time to analyze the market ideally during the quiet period, such as the Asian session and plan trades for the coming session. When I get to know new traders and […]
-

Elliott wave: The probability behind trading
Read MoreElliott wave is a pattern-based forecasting tool. The Theory was developed in 1930 and it is known for the idea that the Market advances in 5 waves and pullback in 3 waves. The Theory explains that the trend is always in 5 waves, and the trader needs to buy/sell against the beginning of wave 1 to make […]
-

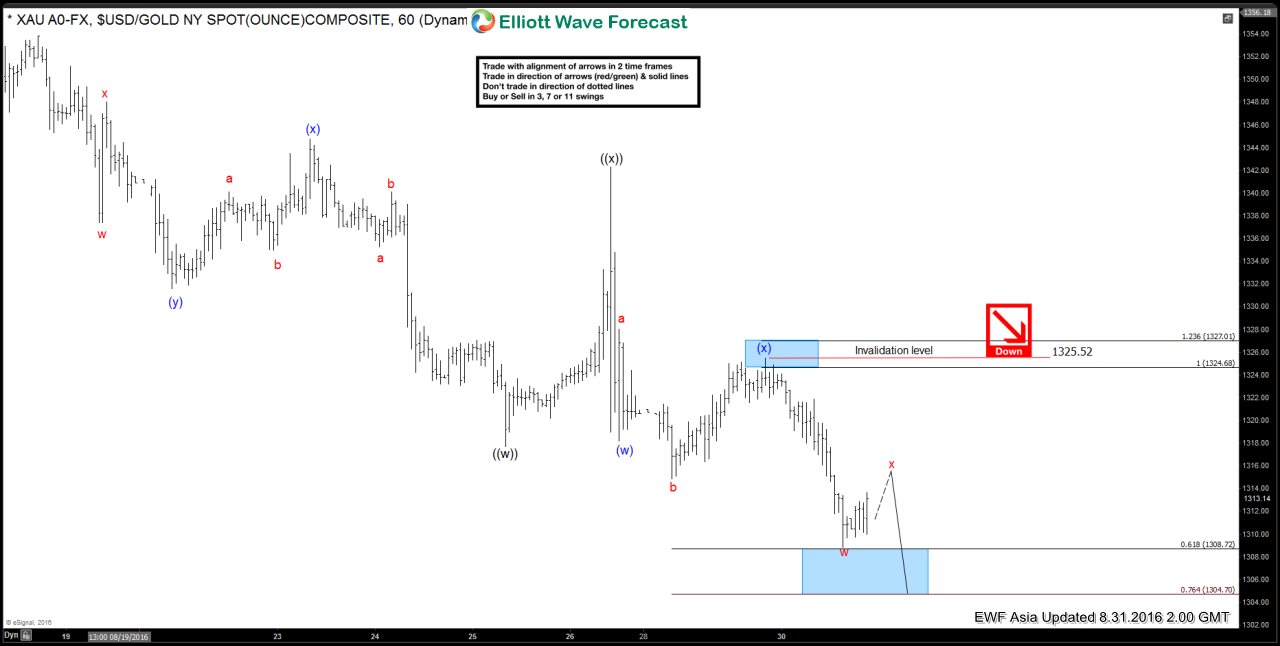
Gold $XAUUSD Short-term Elliott Wave Analysis 8.31.2016
Read MoreShort term Elliott wave count suggests that rally to 1342.26 ended wave ((x)). Decline from there is unfolding as a double three where wave (w) ended at 1318.2 and wave (x) ended at 1325.52. While near term bounce in wave x stays below 1325.52, expect Gold to turn lower in wave (y) of ((y)) towards 1291 […]