
The Power of 3-7-11 and the Grand Super Cycle: How We Saw the Bullish Turn in April 2025 Back on April 9, 2025, while World Indices were dropping sharply and global sentiment had turned overwhelmingly bearish, we published an article that challenged the fear-driven narrative. We explained why selling was not the right approach and […]
-

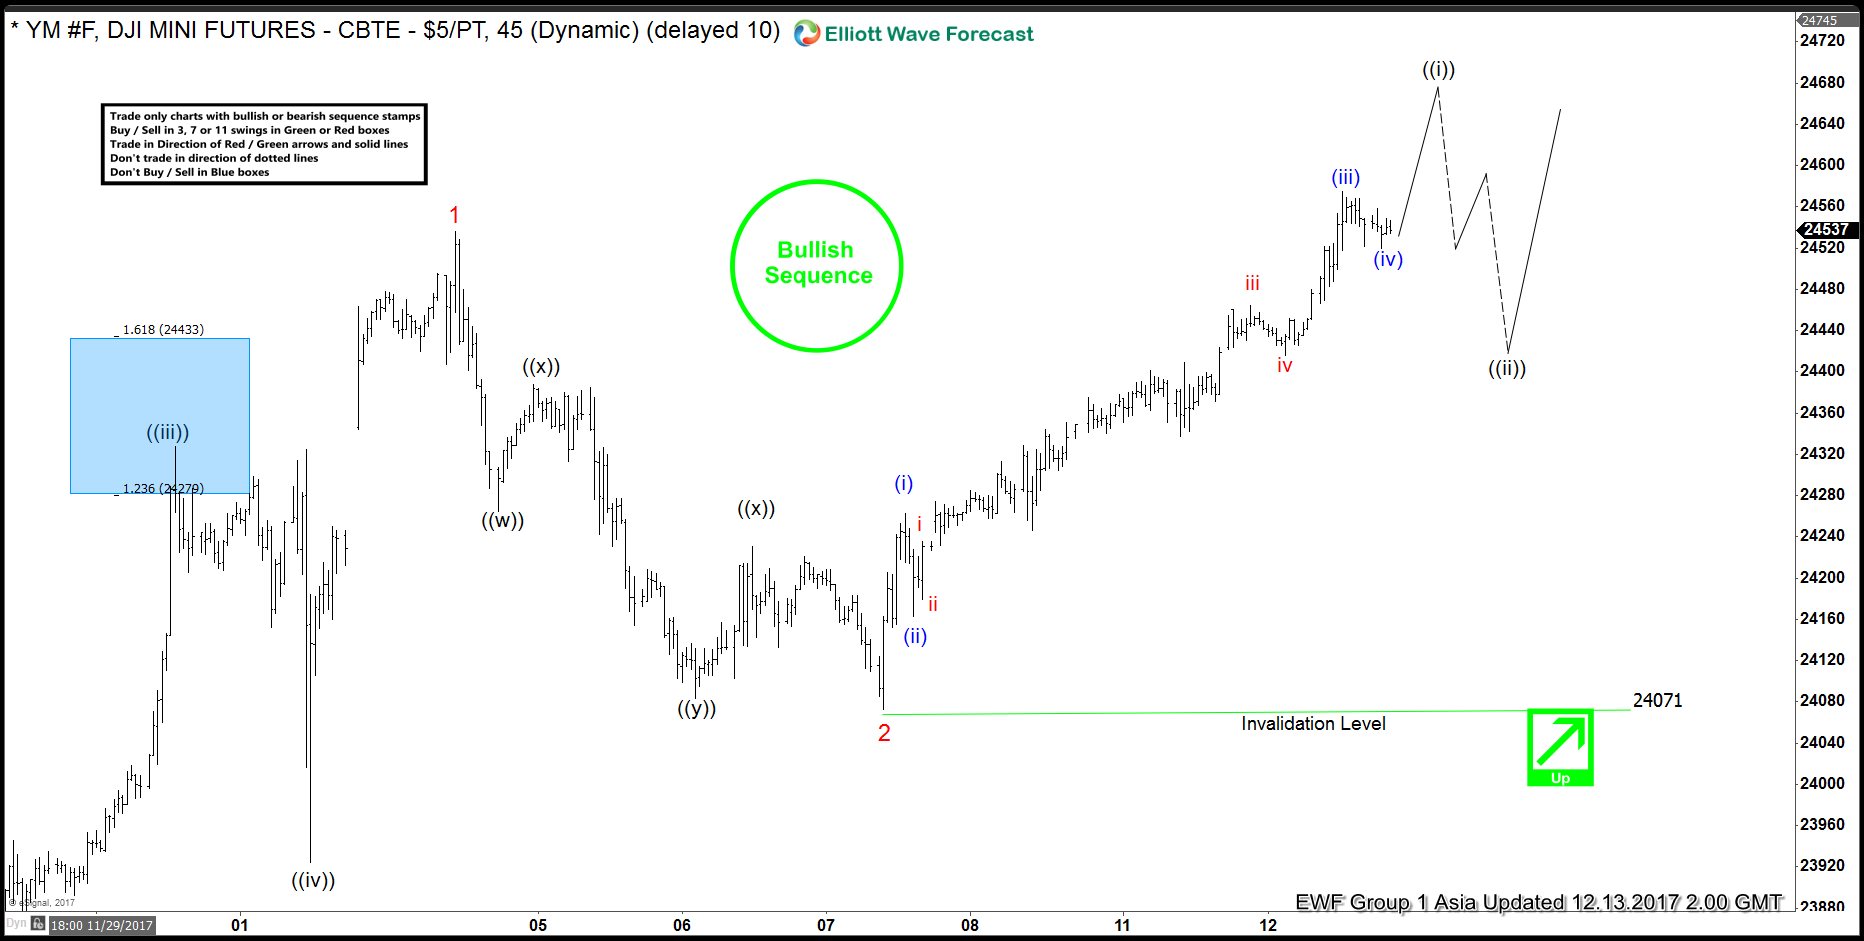
Dow Future Short Term Elliott Wave Analysis
Read MoreDow Future Short Term Elliott Wave view suggests that Intermediate wave (4) ended with the decline to 23205. Up from there, Intermediate wave (5) is unfolding as an Ending Diagonal Elliott Wave structure where Minor wave 1 ended at 24536 and Minor wave 2 ended at 24073. The Index has been able to break above Minor wave […]
-

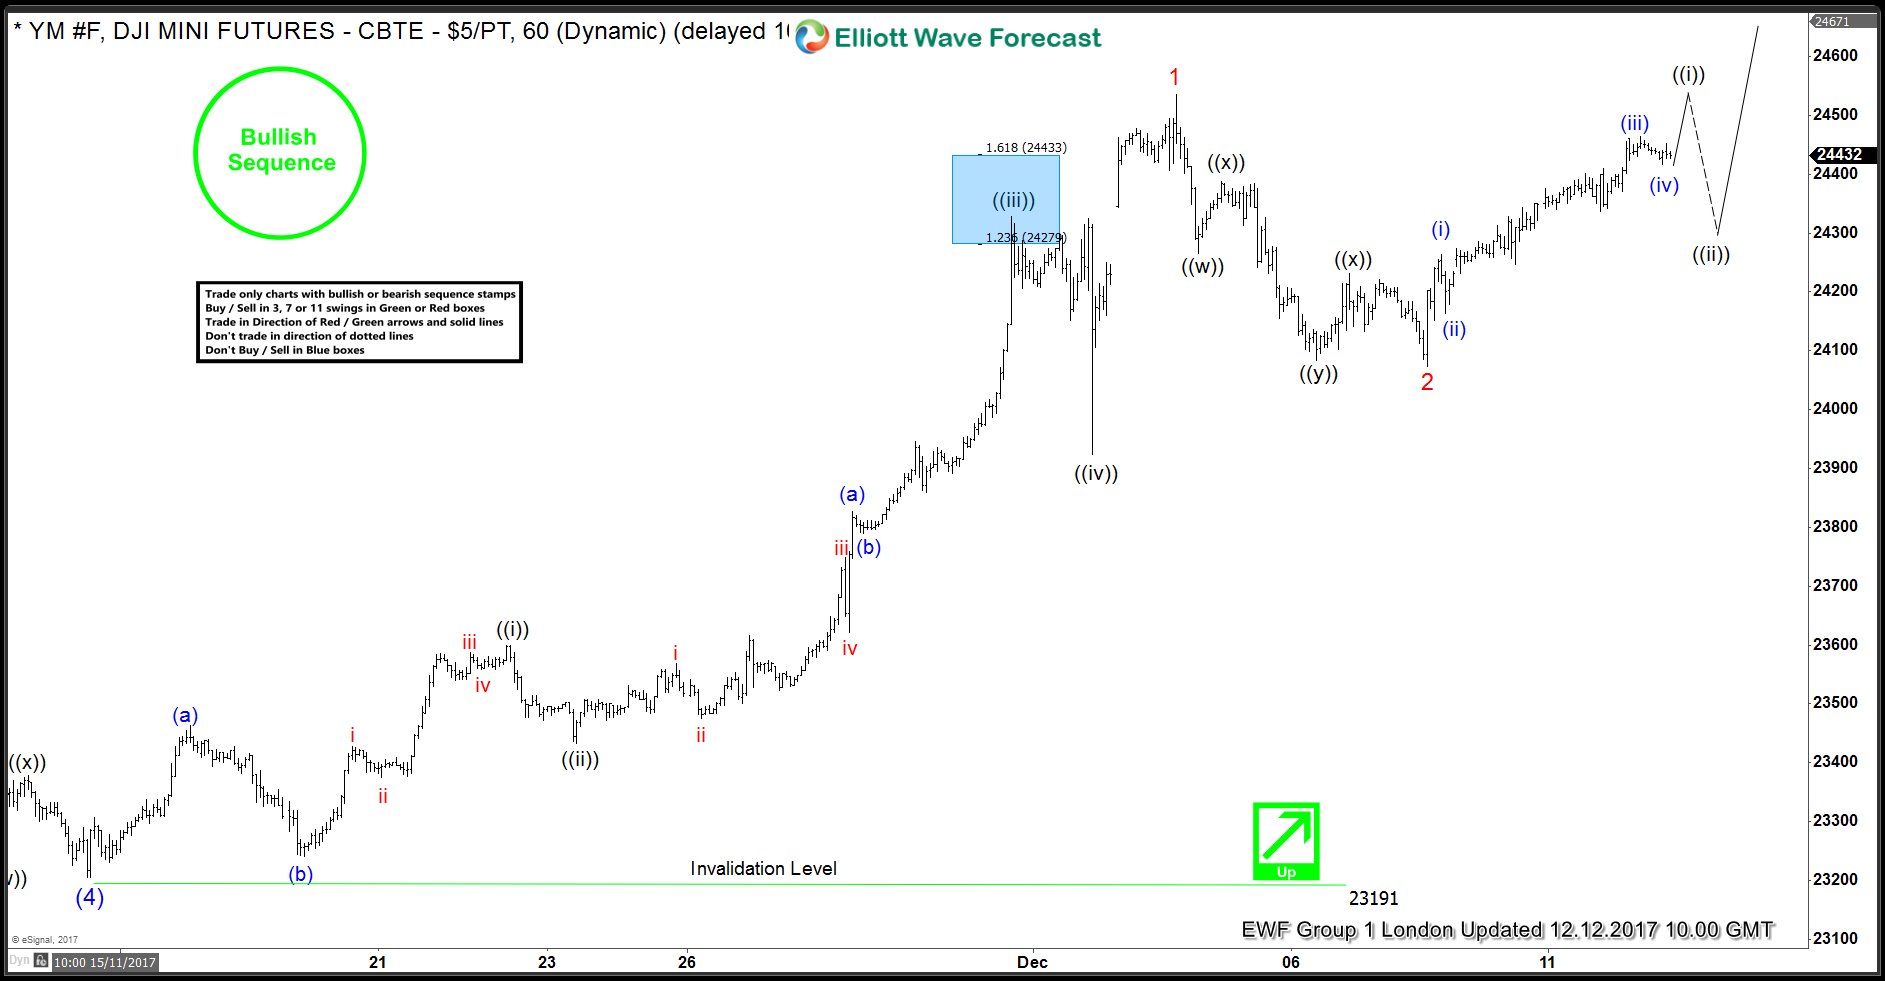
Dow Future Elliott Wave Analysis 12.12.2017
Read MoreDow Future Short Term Elliott Wave view suggests that the decline to 23205 ended Intermediate wave (4). Intermediate wave (5) is in progress as an Ending Diagonal Elliott Wave structure where Minor wave 1 ended at 24536 and Minor wave 2 ended at 24073. The Index still needs to break above Minor wave (1) at 24536 to […]
-

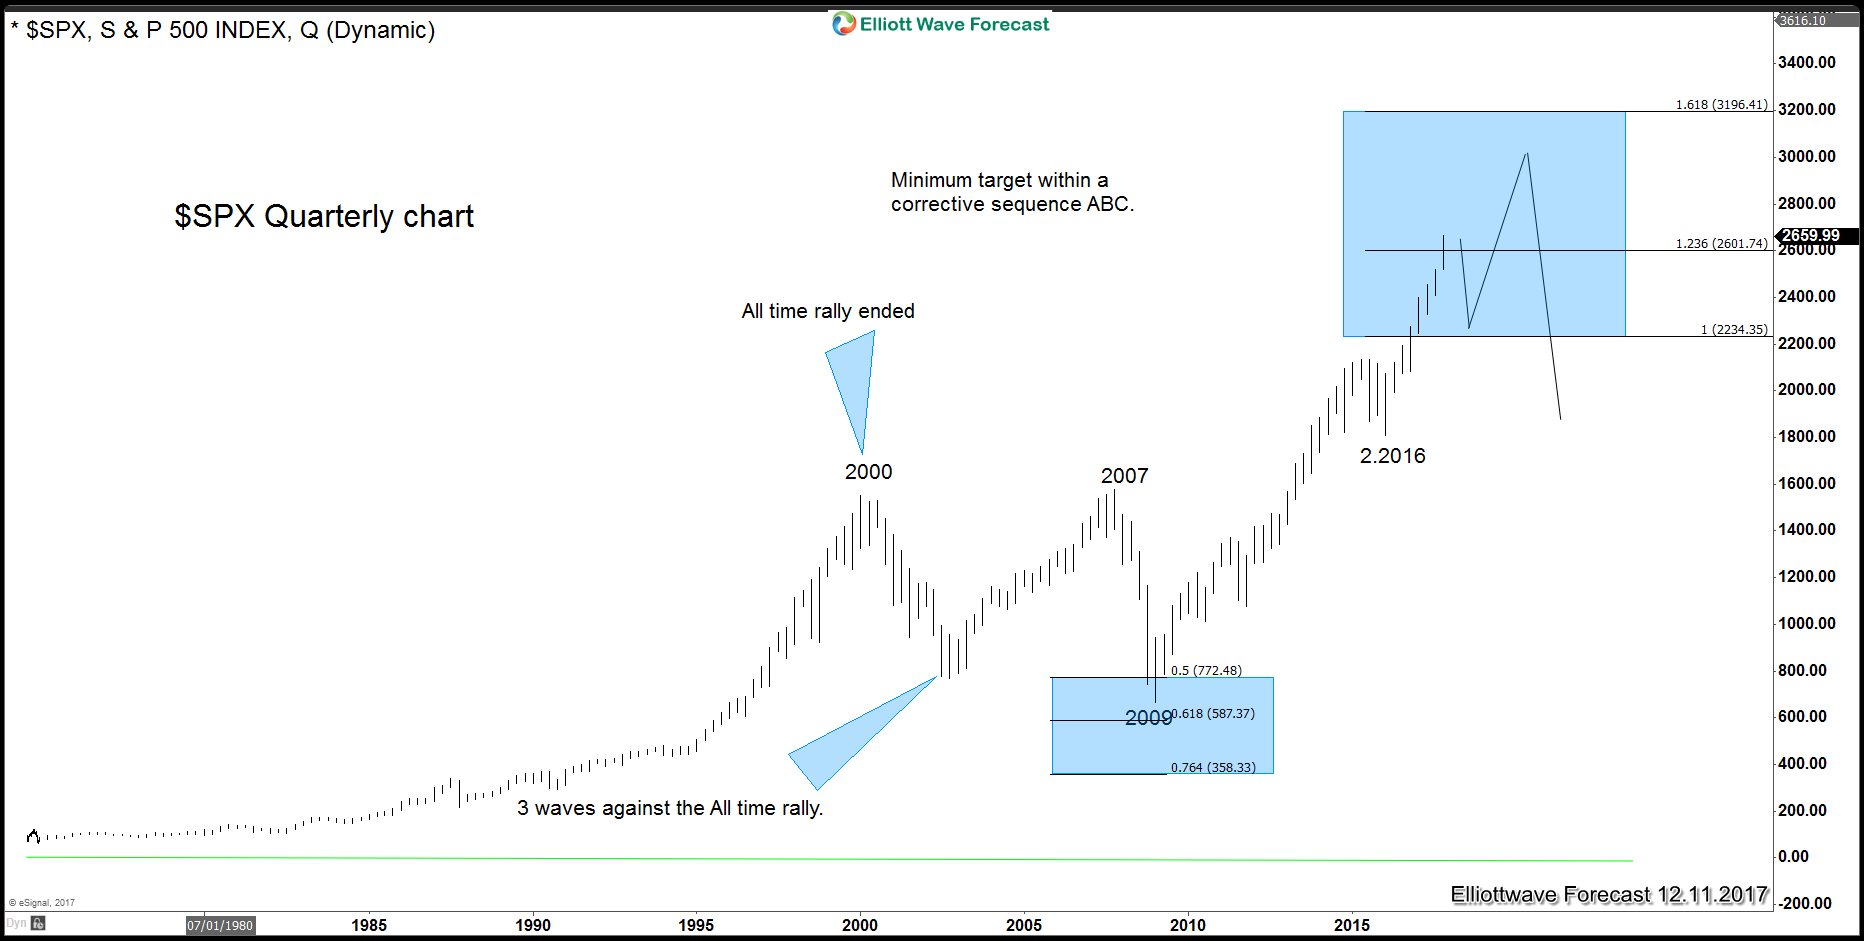
Is the World coming to the end?
Read MoreWe now live in an interesting time. Every day we wake up with the news about either World Indices make all-time records or bad news about terrorist attack and nuclear test. Historically, humans have gone through these stages and we were able to withstand all these events. At ElliottwaveForecast.com, we try to ignore all these events […]
-

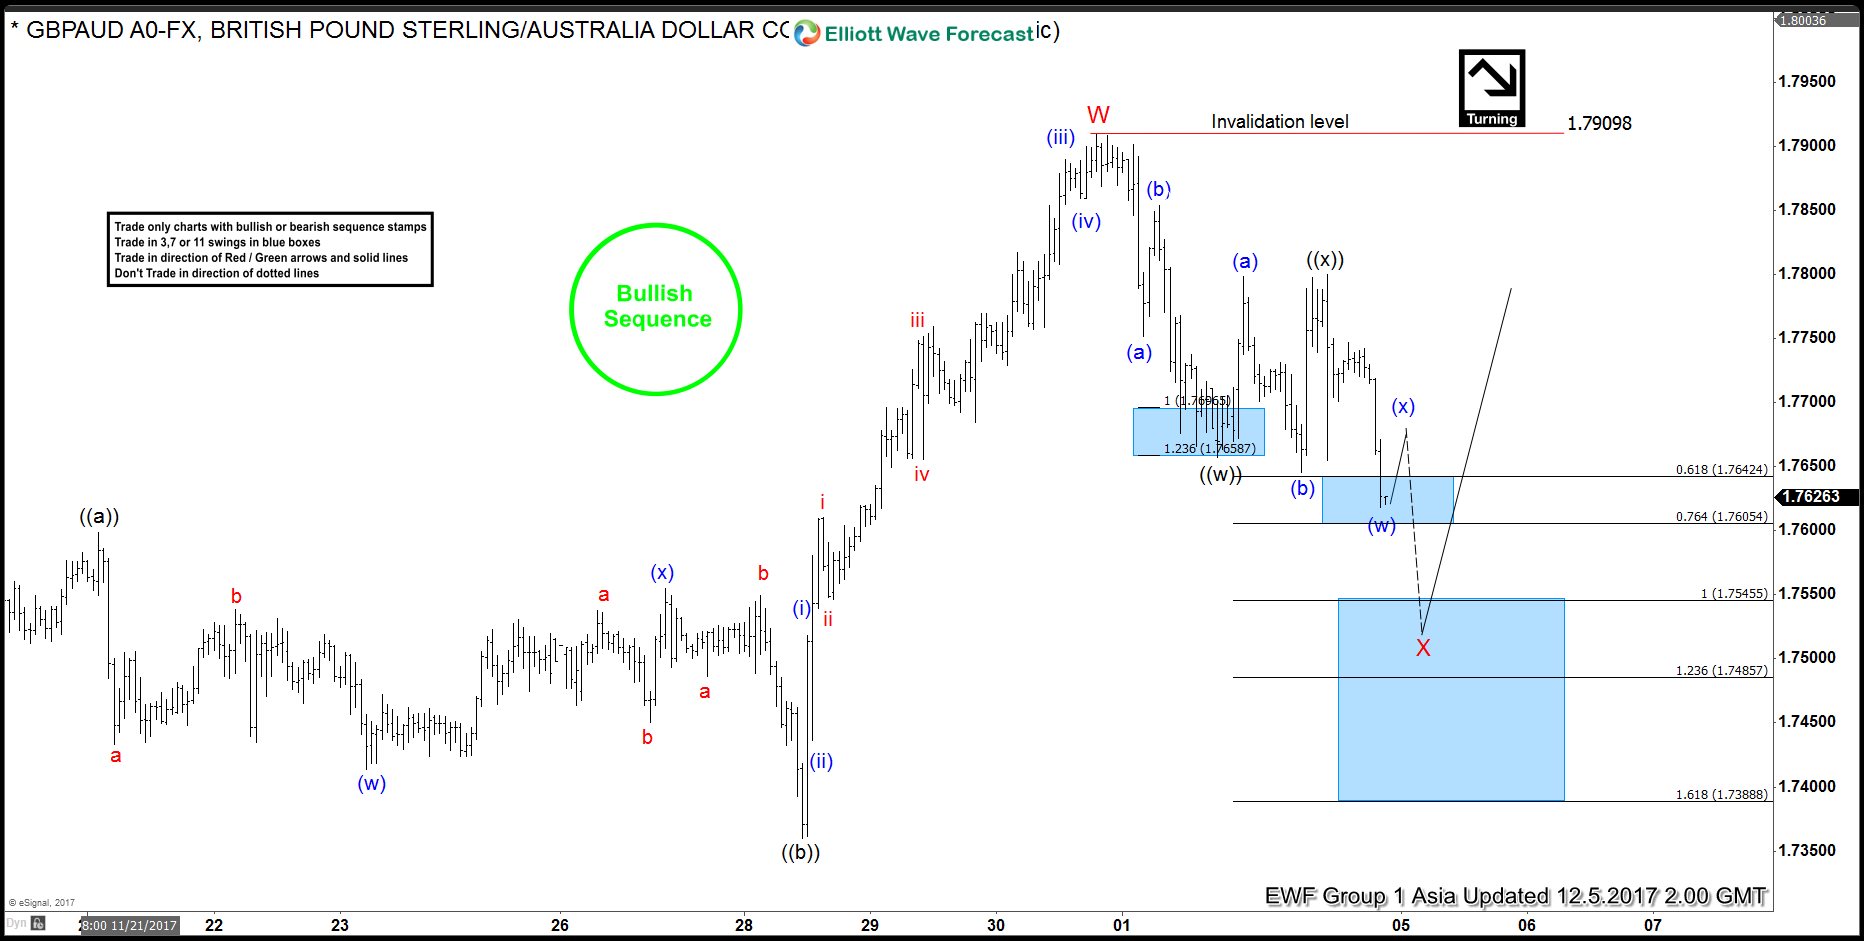
GBPAUD Buying The Dips After Double Three Correction
Read MoreHello fellow traders. In this technical blog we’re going to take a quick look at the past Elliott Wave charts of GBPAUD published in members area of www.elliottwave-forecast.com. We’re going to explain the Elliott Wave forecast and our trading strategy. As our members know , we were keep saying that GBPAUD is trading within larger bullish […]