
The Power of 3-7-11 and the Grand Super Cycle: How We Saw the Bullish Turn in April 2025 Back on April 9, 2025, while World Indices were dropping sharply and global sentiment had turned overwhelmingly bearish, we published an article that challenged the fear-driven narrative. We explained why selling was not the right approach and […]
-

Elliott Wave Analysis: Amazon Rally Should Fail for Yet Another Low
Read MoreShort term Elliott Wave View in Amazon (ticker: AMZN) suggests that the bounce to 1784 ended Cycle degree wave x. Cycle degree wave y is currently in progress lower as a double three Elliott Wave structure. Down from 1784, Primary wave ((W)) ended at 1420 and Primary wave ((X)) bounce is in progress towards 1631.54 […]
-

Elliott Wave Analysis: EURUSD 5 waves structure looking for more downside
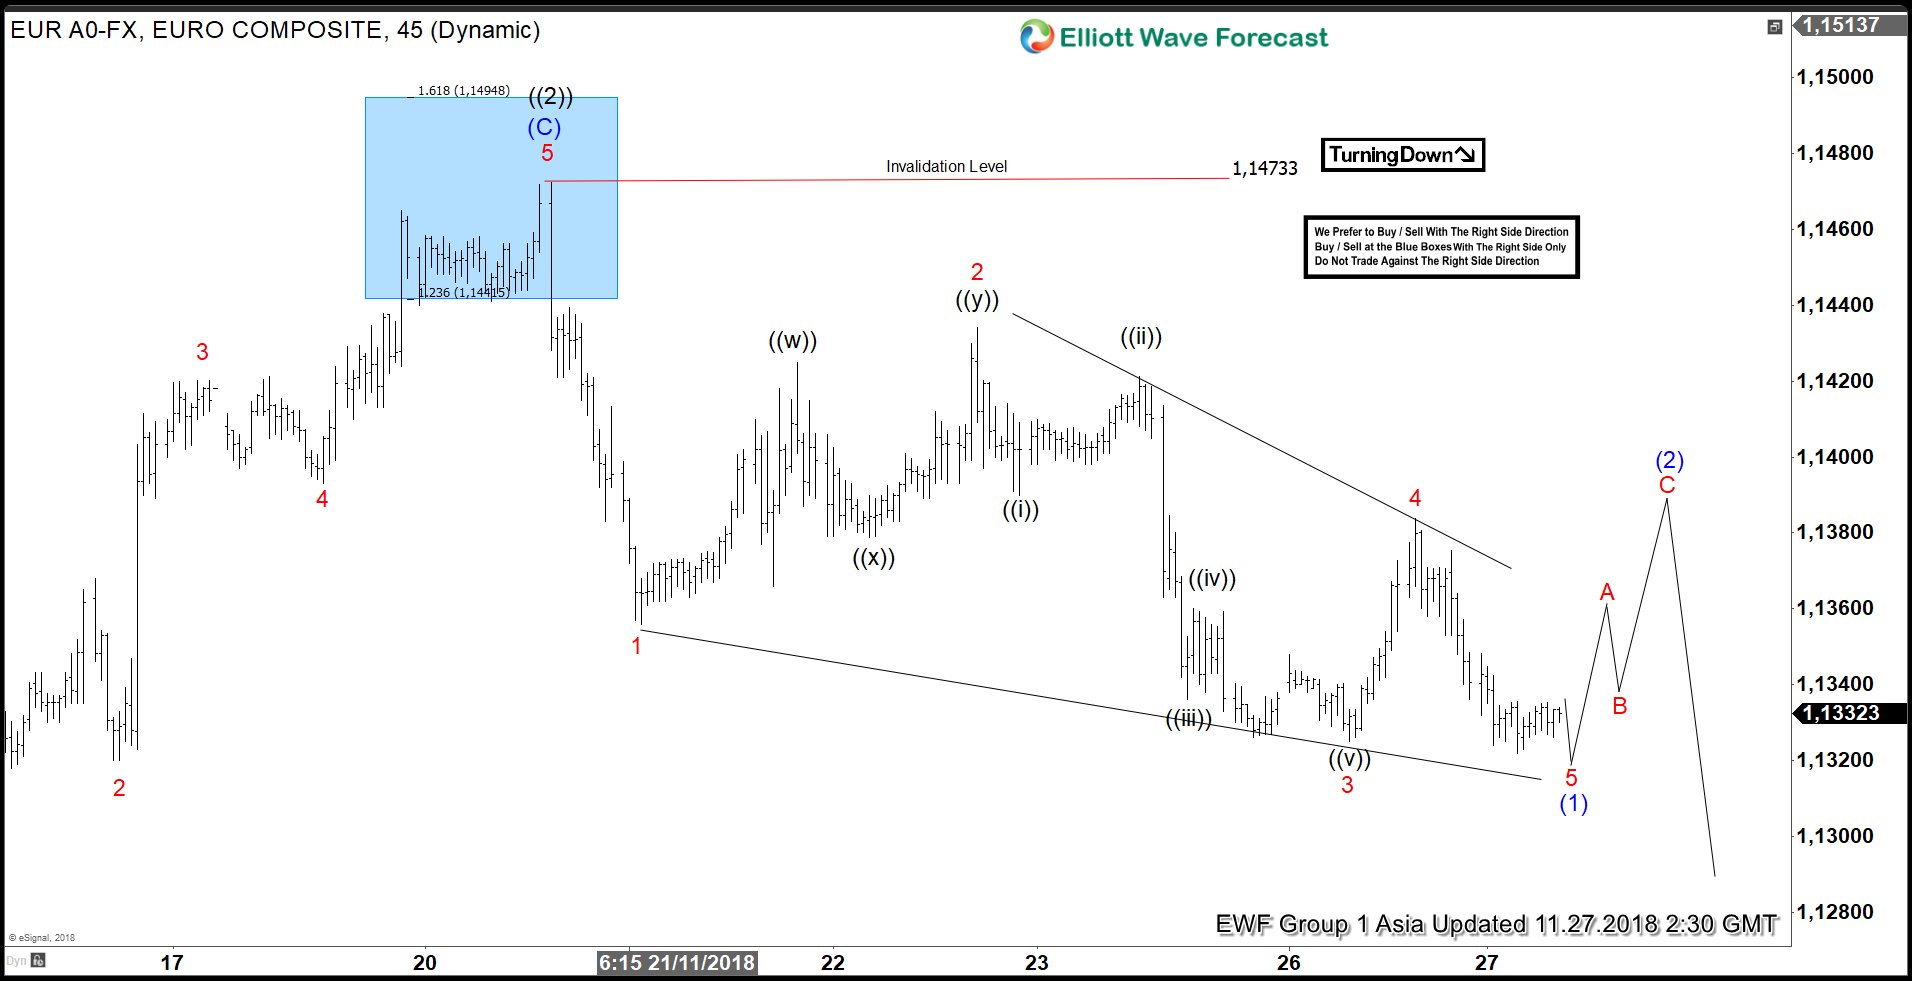
Read MoreCycle from Sept 24 high (1.182) in EURUSD remains in progress as an Elliott Wave impulse structure where Primary wave ((1)) ended at 1.1214 and Primary wave ((2)) is proposed complete at 1.147. Pair still needs to break below Primary wave ((1)) at 1.1214 to validate this view. Until then, we still can’t rule out […]
-

USDX Forecasting The Rally After Pull Back
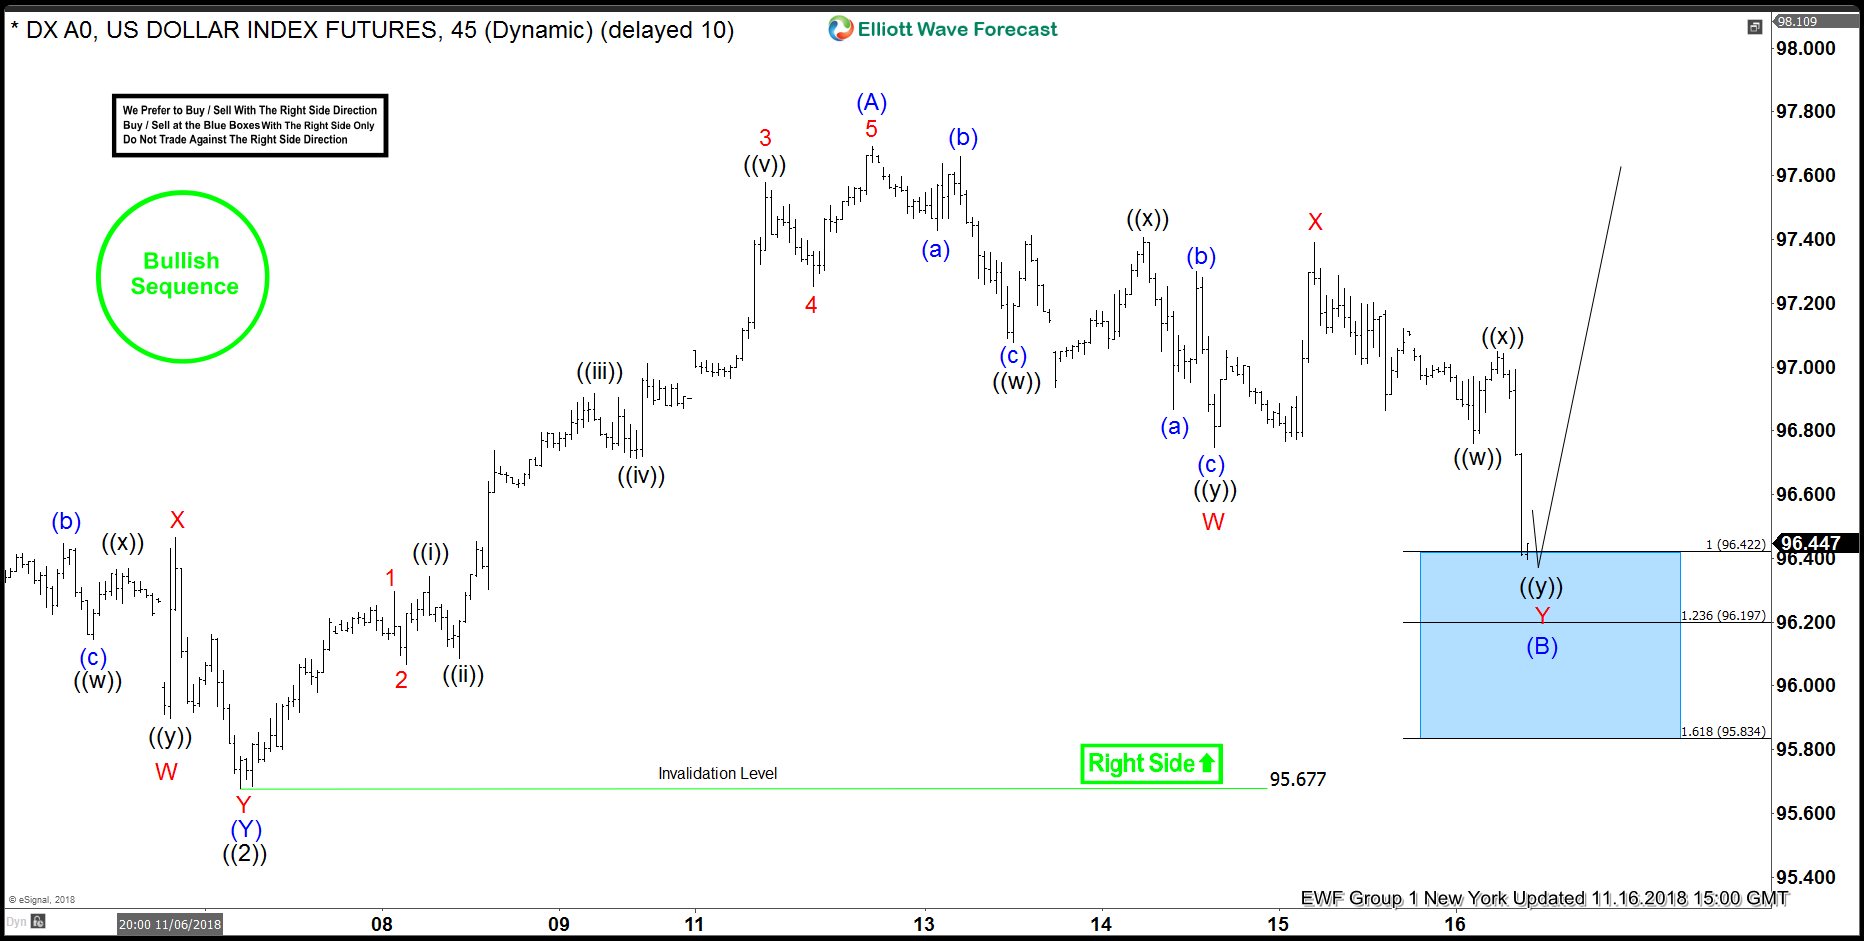
Read MoreHello fellow traders. In this technical blog we’re going to take a quick look at the Elliott Wave charts of USDX published in members area of The Website. As our members know, USDX has incomplete bullish sequences. Break of August 15th peak has made the structure incomplete to the upside, suggesting the USDX is bullish […]
-

G20 Meeting May Dictate Path of Stock Market for Rest of the Year
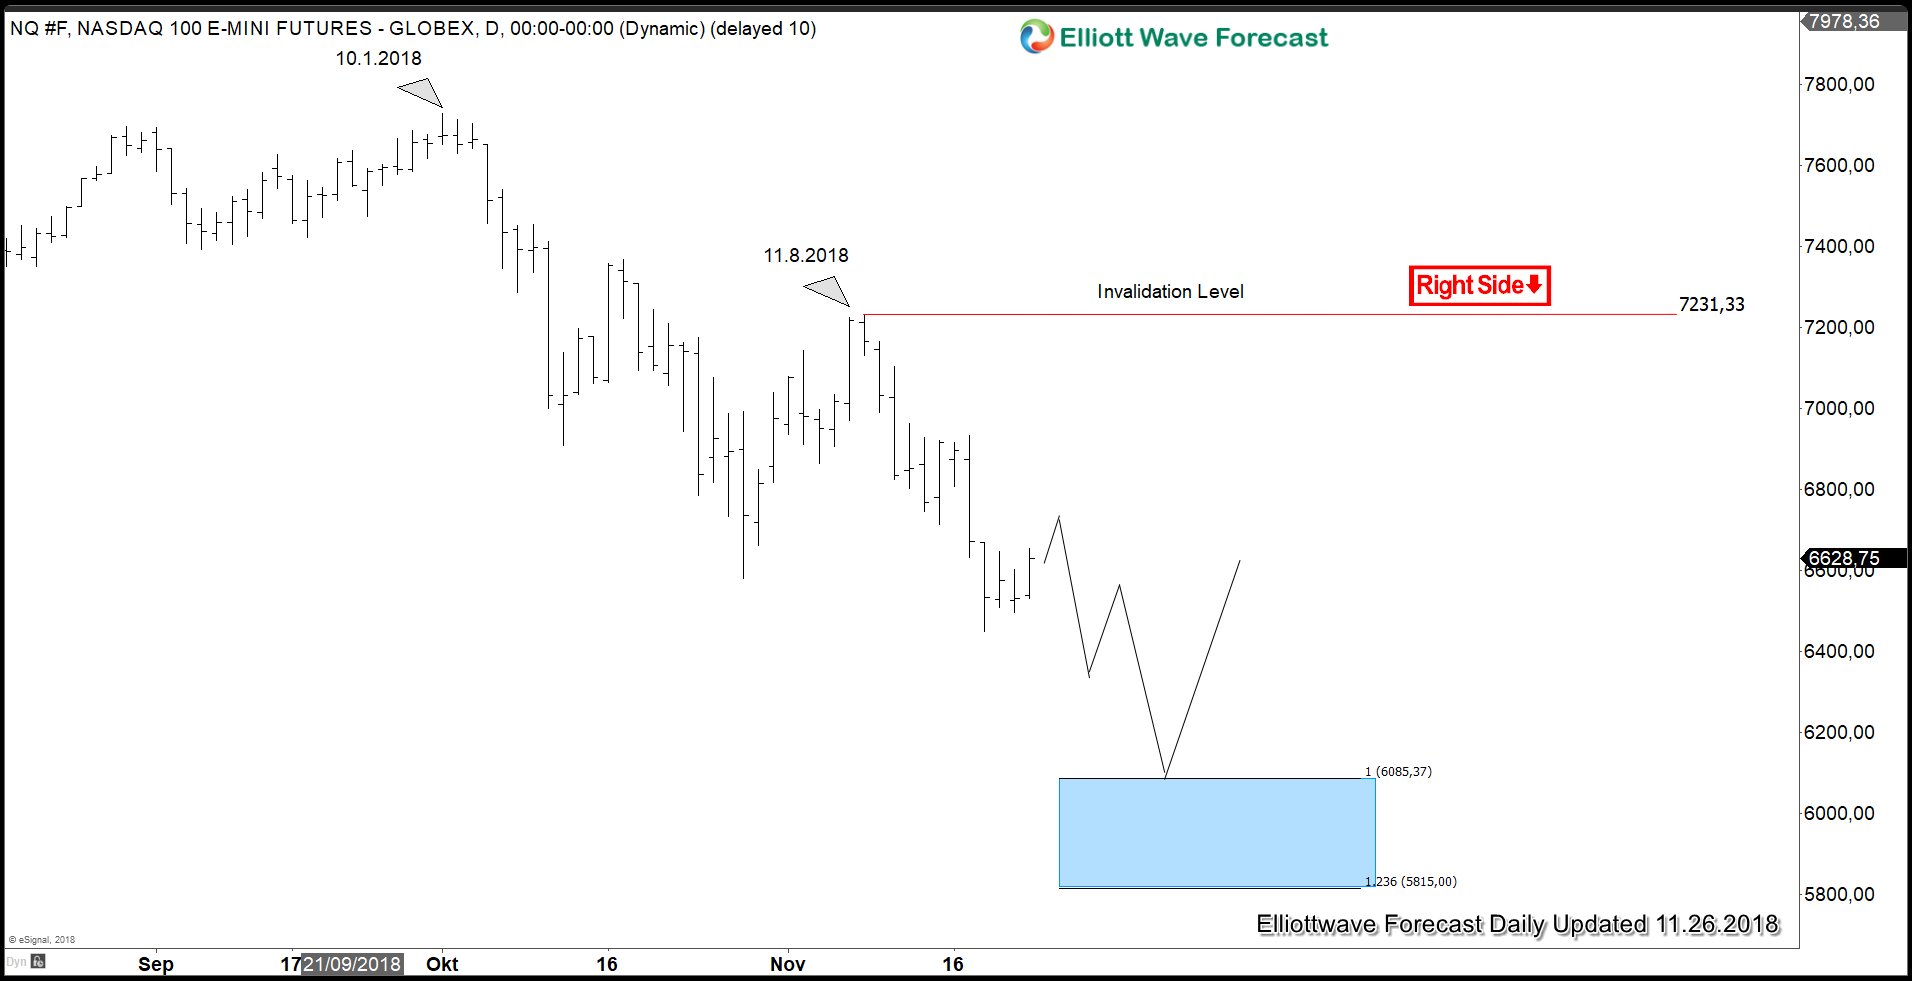
Read MoreGlobal Indices continue to retreat in the fourth quarter of this year as the combination of Fed’s quantitative tightening and escalating trade wars threatens to derail the 10 year bullish market. Below is the Year-to-Date return of the Global Indices as of Friday Nov 24: Next week, global Indices will have a chance to find […]