
The Power of 3-7-11 and the Grand Super Cycle: How We Saw the Bullish Turn in April 2025 Back on April 9, 2025, while World Indices were dropping sharply and global sentiment had turned overwhelmingly bearish, we published an article that challenged the fear-driven narrative. We explained why selling was not the right approach and […]
-

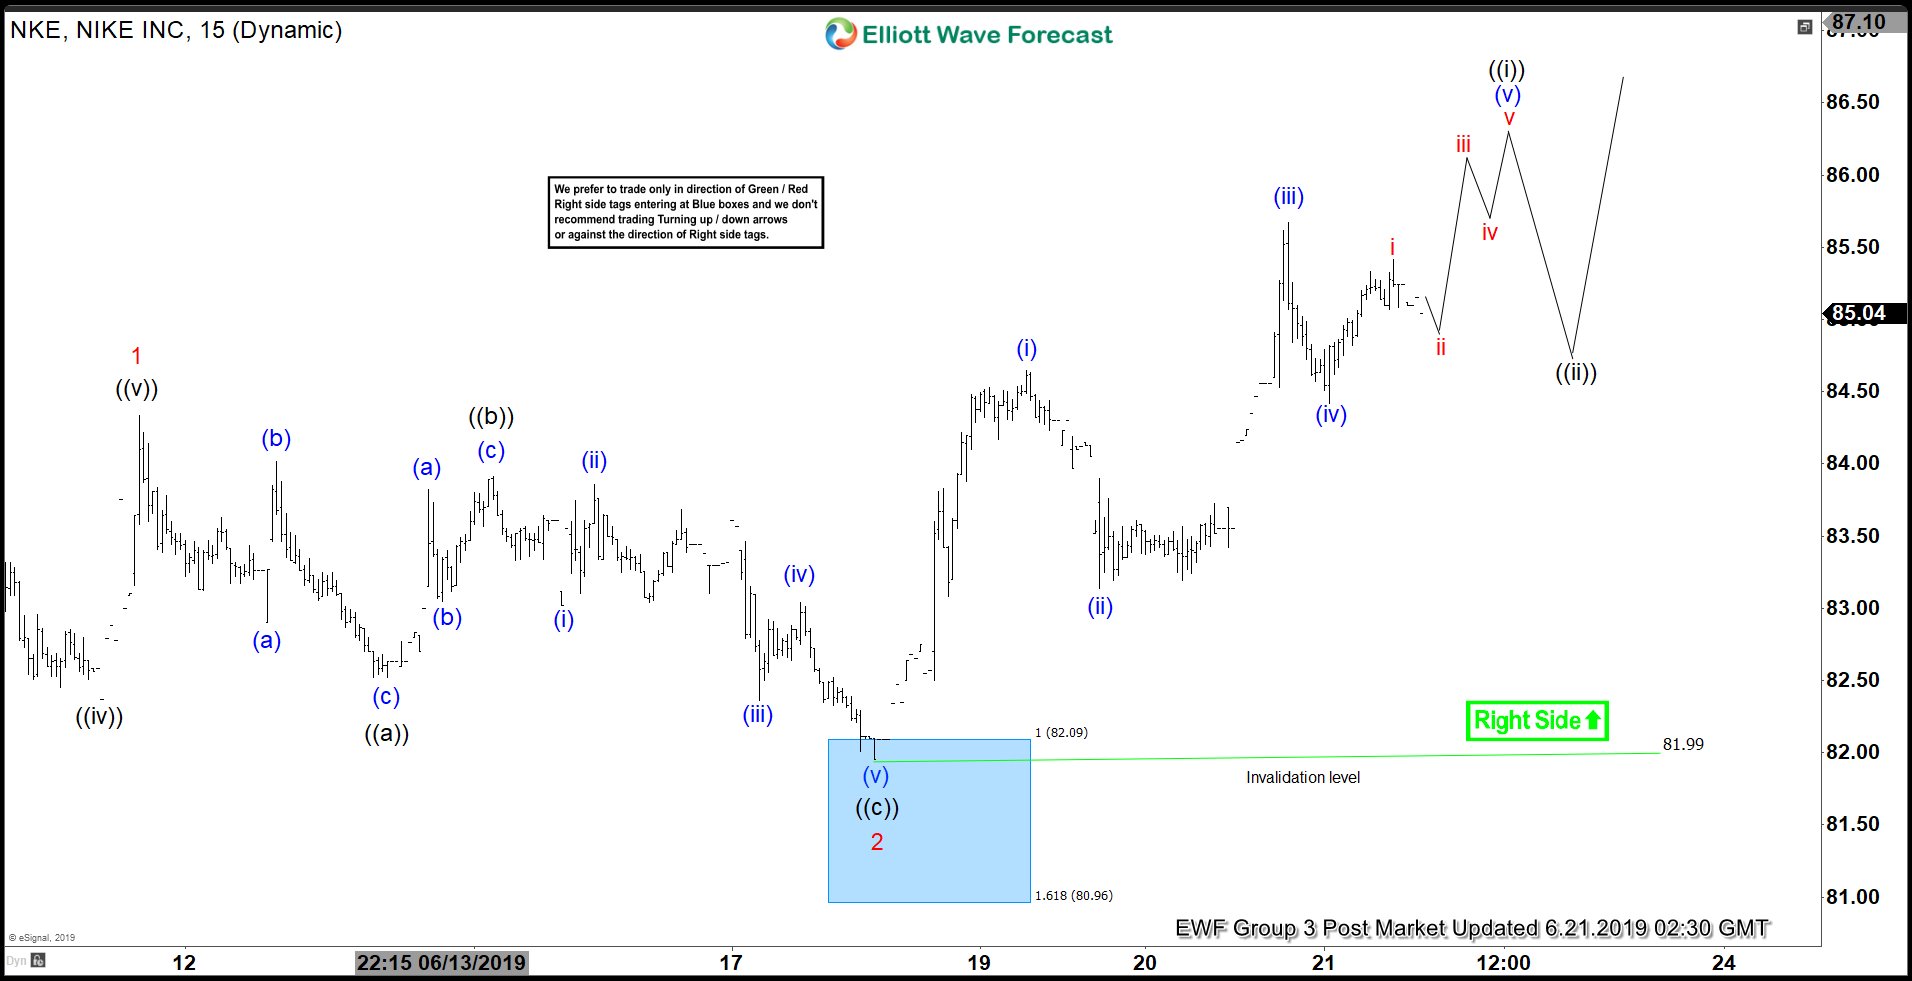
Elliott Wave View: Nike Resumes Rally Higher
Read MoreNike has resumed the rally higher. As far as dips stay above June 18, it can extend higher. This article & video looks at the short term Elliott Wave path.
-

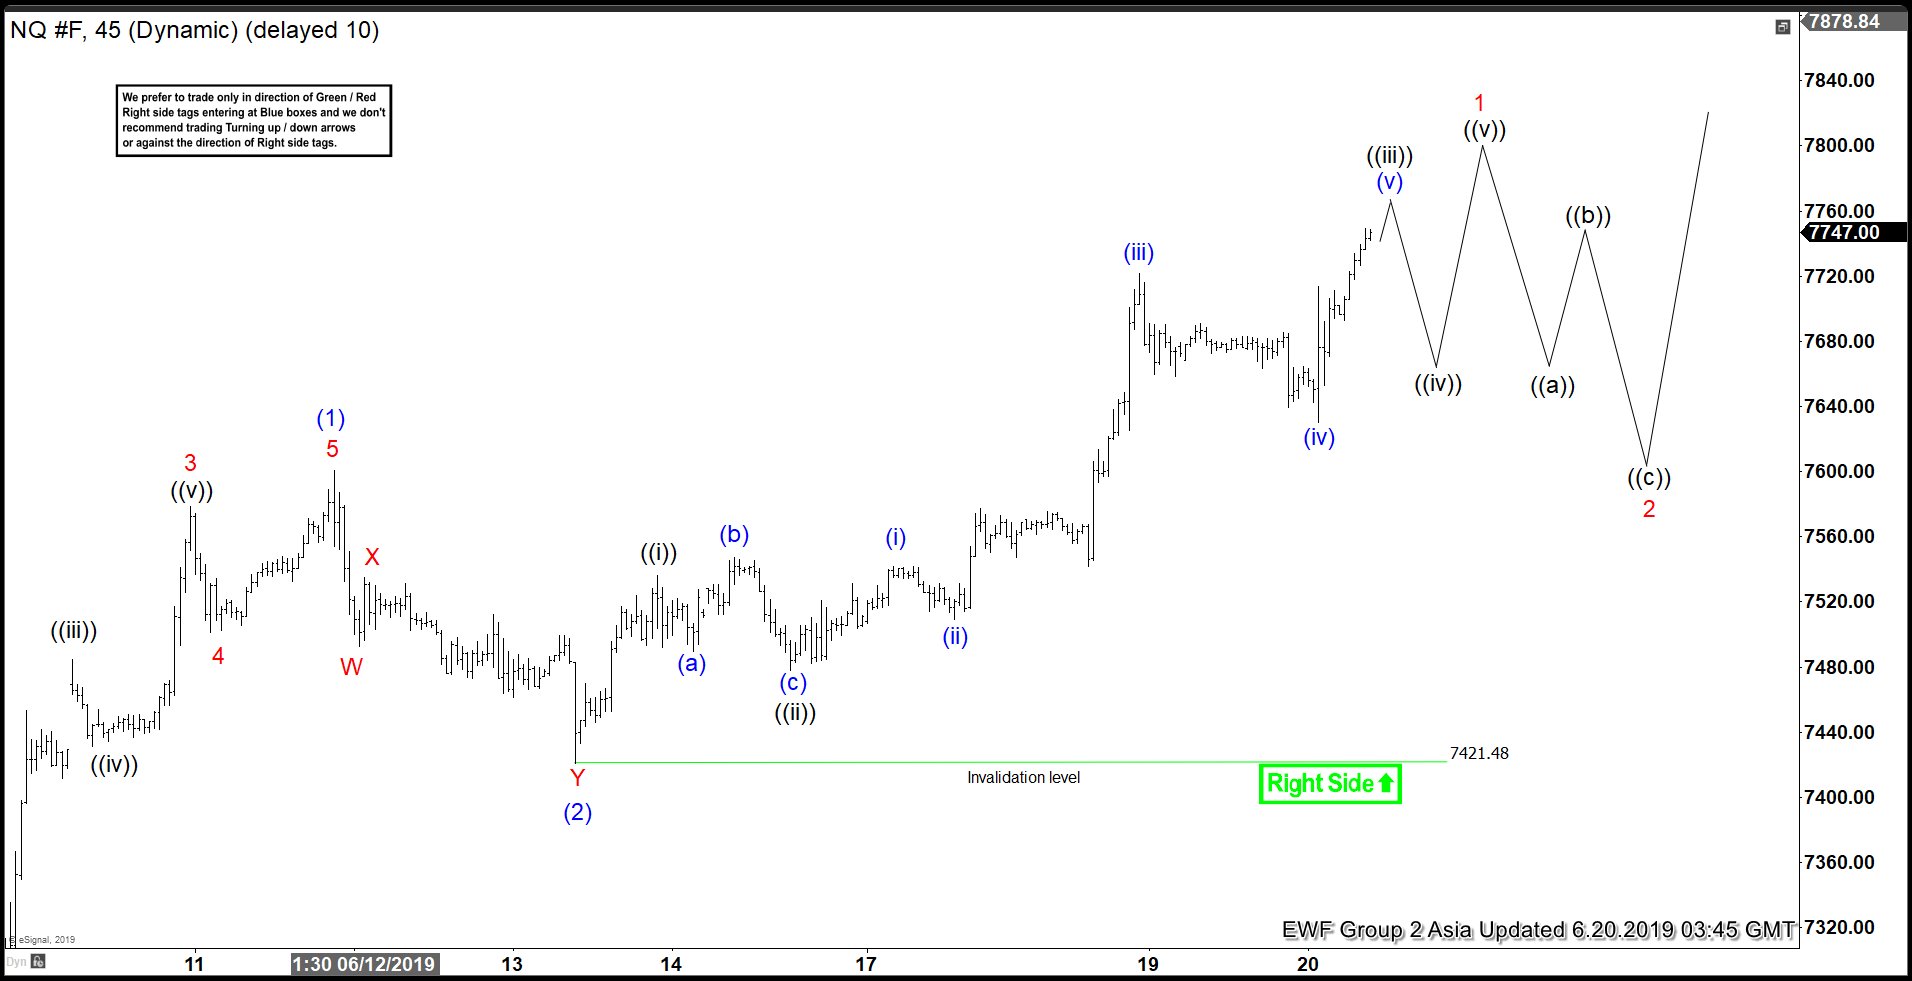
Elliott Wave View Calling for More Upside in Nasdaq
Read MoreNasdaq Futures (NQ_F) shows a higher high sequence from June 4 low, favoring further upside. Short term, rally to 7600.75 ended wave (1) and pullback to 7421.48 ended wave (2). Wave (3) rally is in progress as an impulse Elliott Wave structure. Up from 7421.48, wave ((i)) ended at 7536 and wave ((ii)) pullback ended […]
-

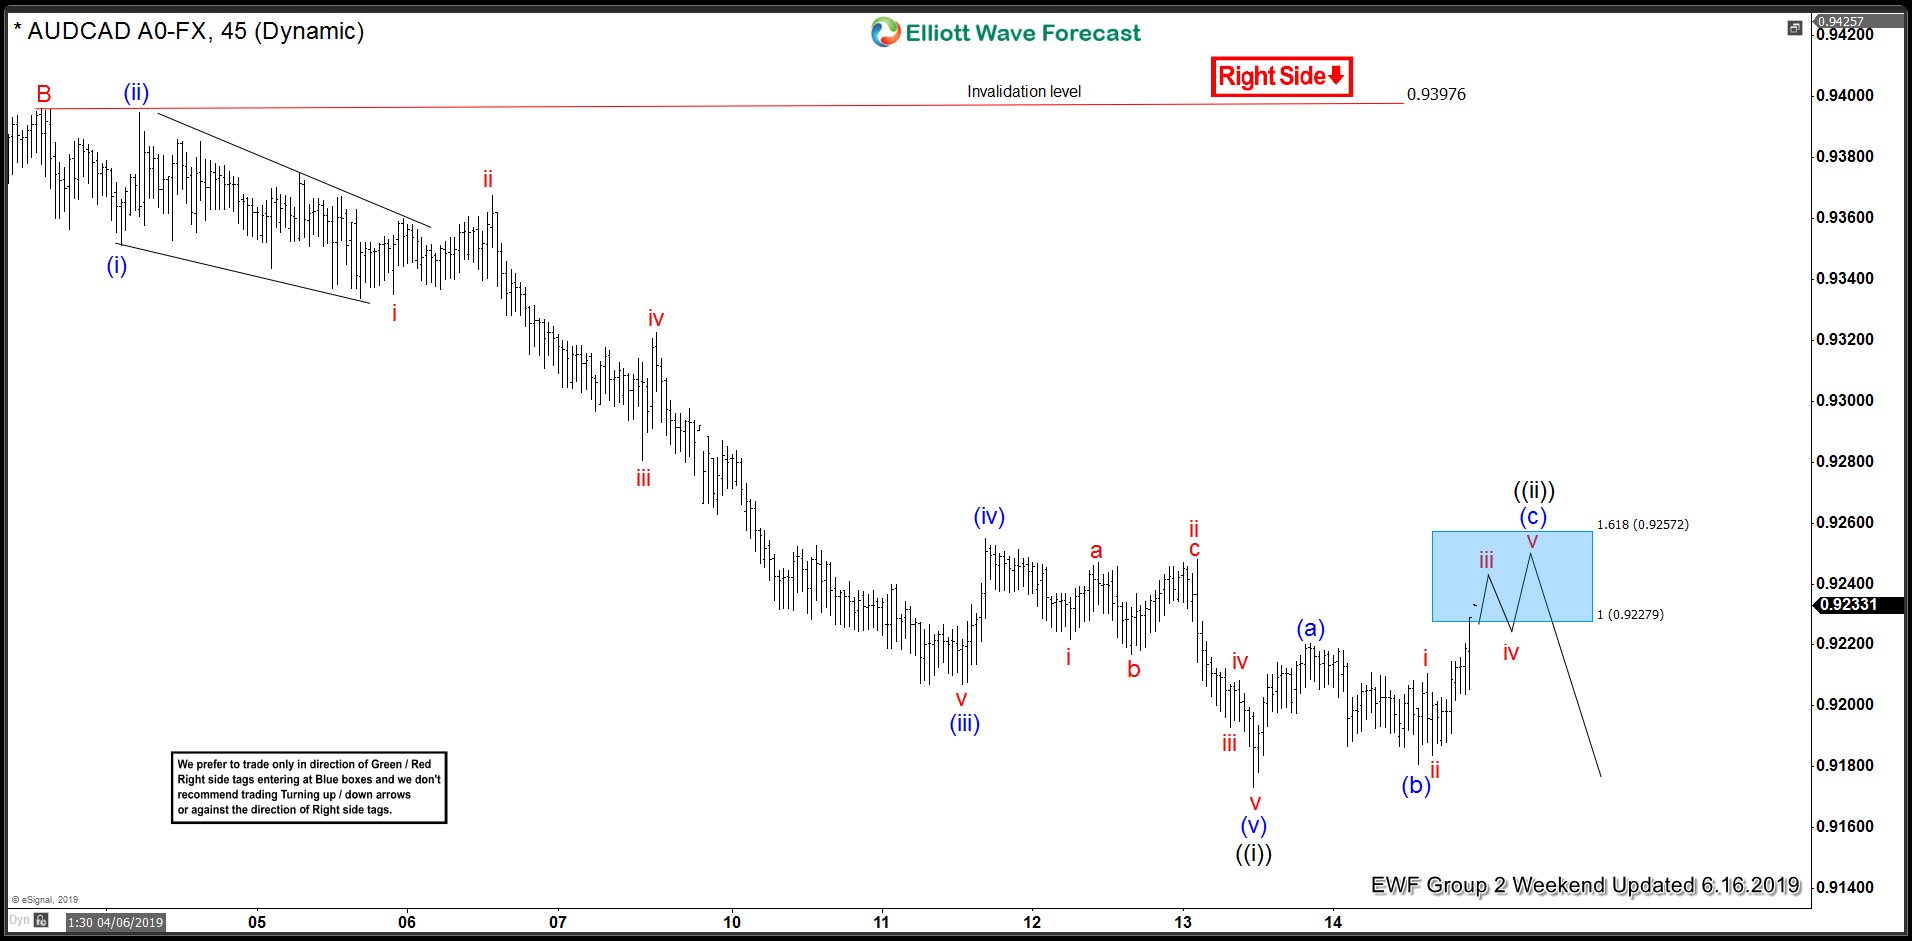
Elliott Wave: High Frequency Box Suggested AUDCAD Sell Off
Read MoreI want to share with you an Elliott Wave chart of AUDCAD which we presented on the weekend update in the past. You see the 1-hour updated chart presented to our clients on the 6/16/19. AUDCAD had a 1-hour right side tag against 0.9397 peak suggesting more downside. The pair ended the cycle from 06/04/19 peak in black […]
-

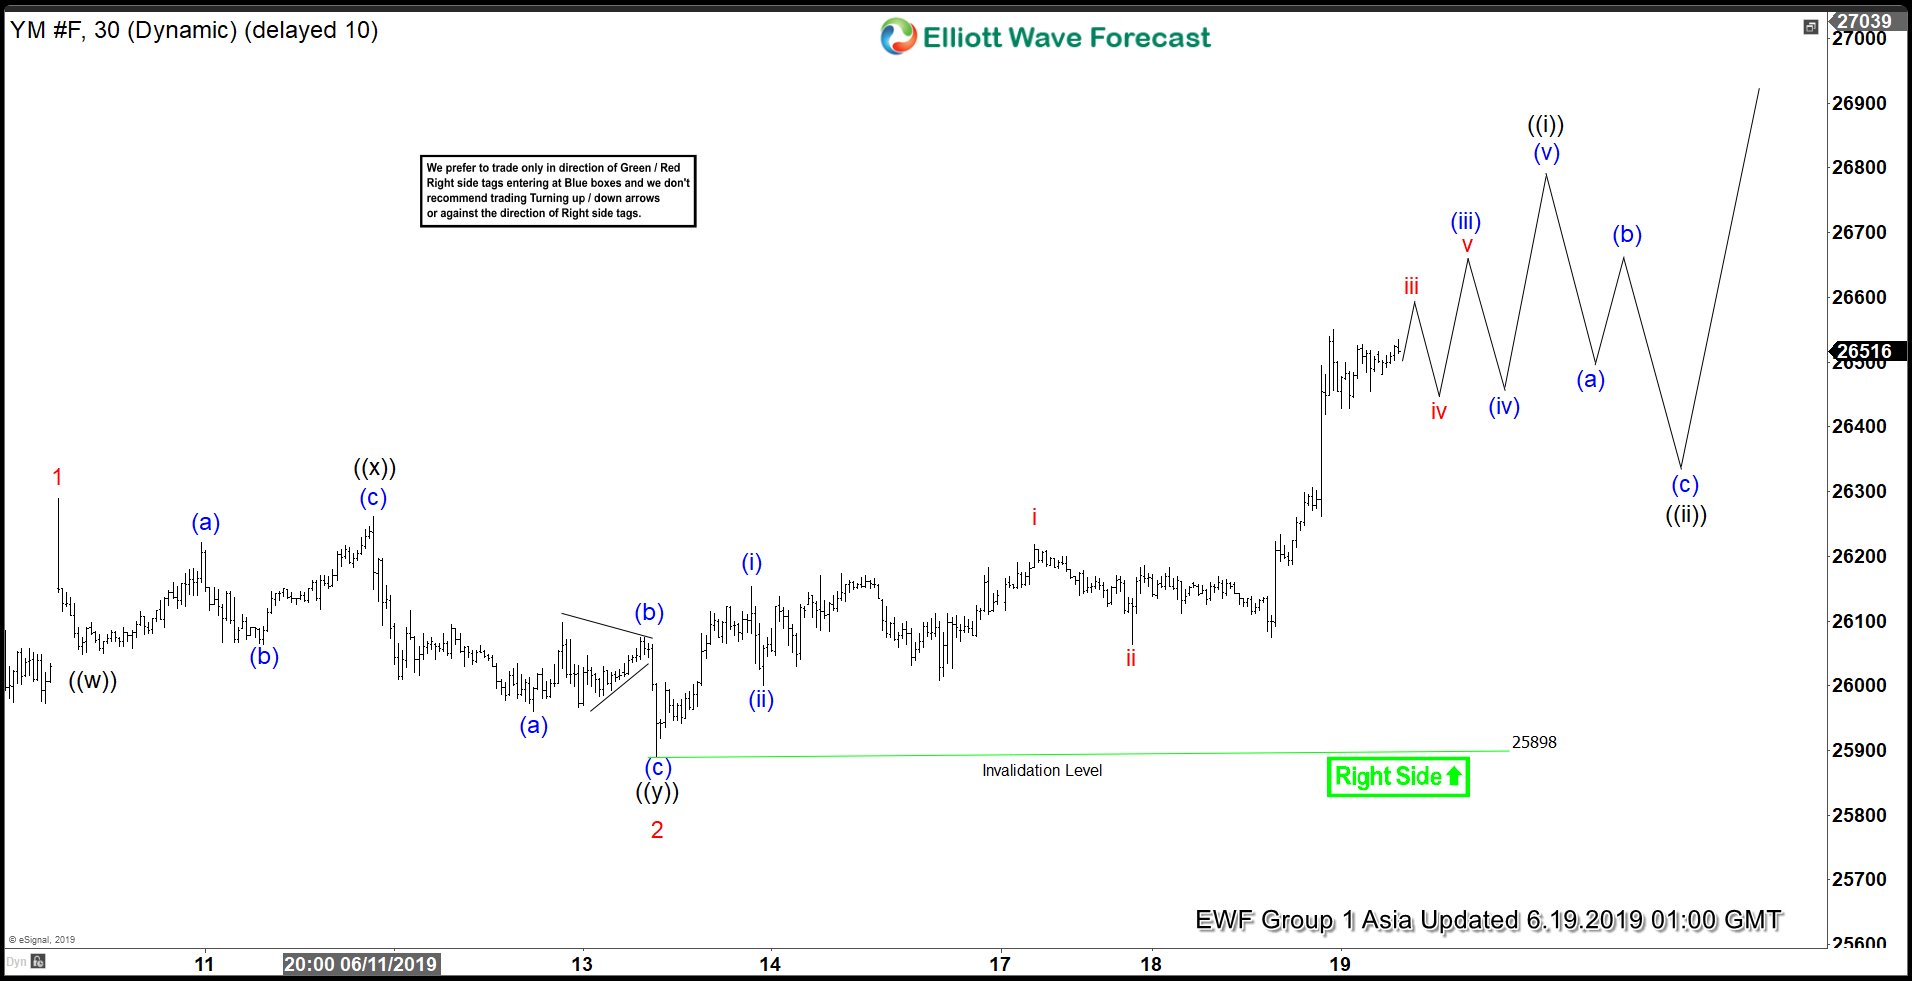
Elliott Wave View: Dow Jones Futures (YM_F) Has Resumed Higher
Read MoreDow Jones Futures (YM_F) shows incomplete sequence from June 3 low favoring more upside. This article and video shows the Elliott Wave path.