
-
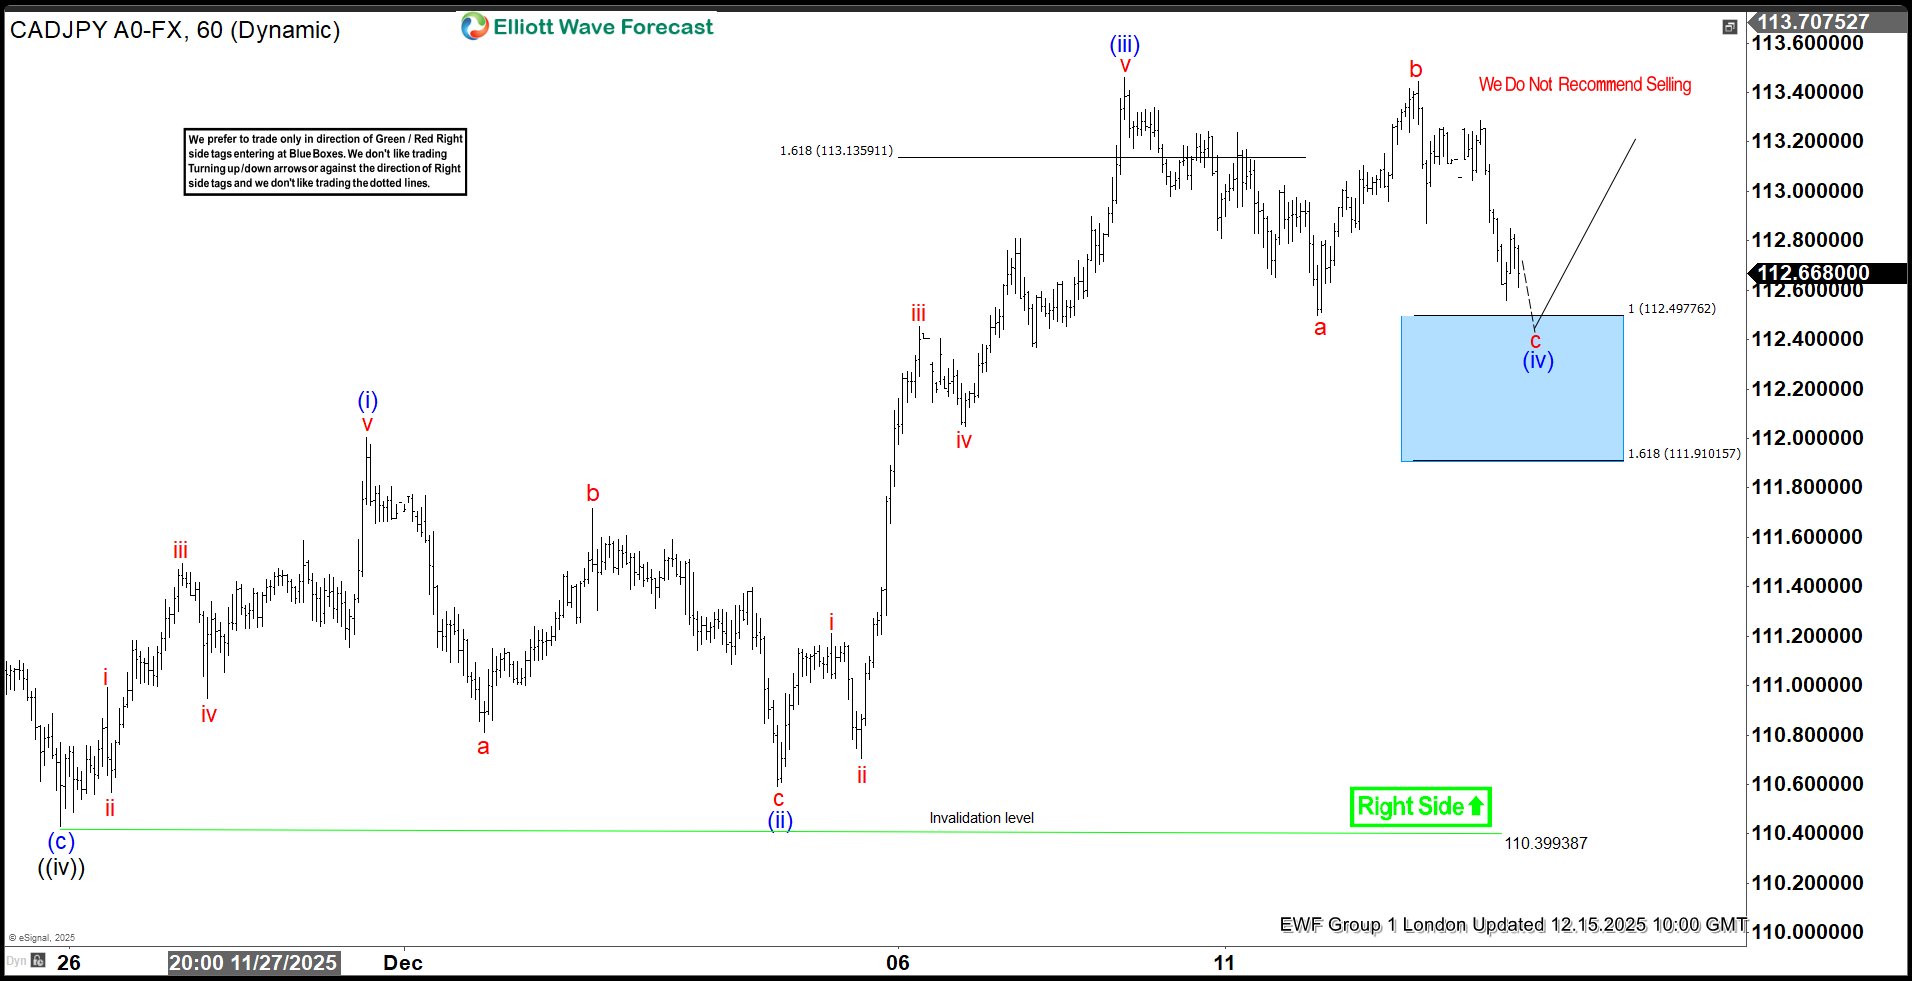
CADJPY Elliott Wave: Blue Box Buy Setup Explained
Read MoreHello fellow traders, As our members know we have had many profitable trading setups recently. In this technical article, we are going to present another Elliott Wave trading setup we got in CADJPY. The forex pair completed this correction precisely at the Equal Legs zone, referred to as the Blue Box Area. In the following […]
-
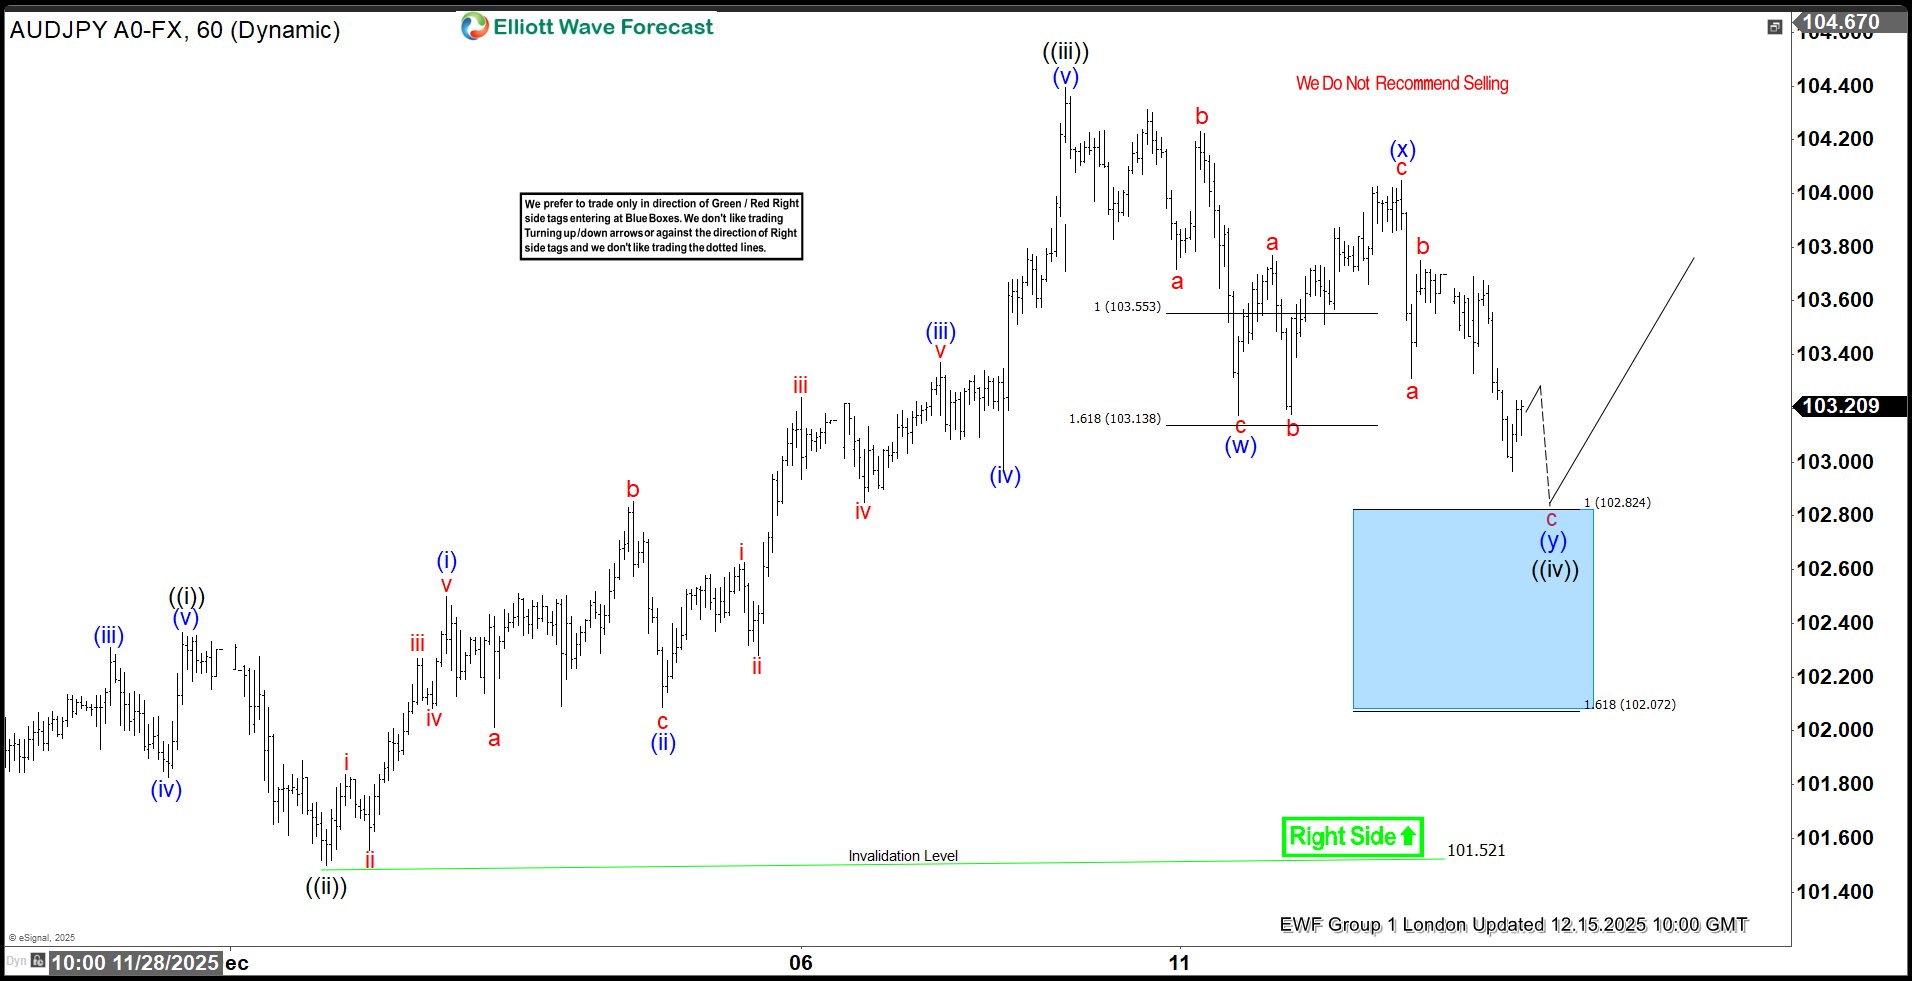
AUDJPY Elliott Wave: Buying the Dips in a Blue Box
Read MoreAs our members know we have had many profitable trading setups recently. In this technical article, we are going to talk about another Elliott Wave trading setup we got in AUDJPY. The pair has completed its correction exactly at the Equal Legs zone, also known as the Blue Box Area. In this article, we’ll break […]
-

NASDAQ (NQ_F) Elliott Wave: Buying the Dips in a Blue Box
Read MoreHello traders. As our members know we have had many profitable trading setups recently. In this technical article, we are going to talk about another Elliott Wave trading setup we got in E-mini Nasdaq-100 Futures. Recently NQ_F made a clear three-wave correction. The pull back completed as Elliott Wave Double Three pattern and made a […]
-
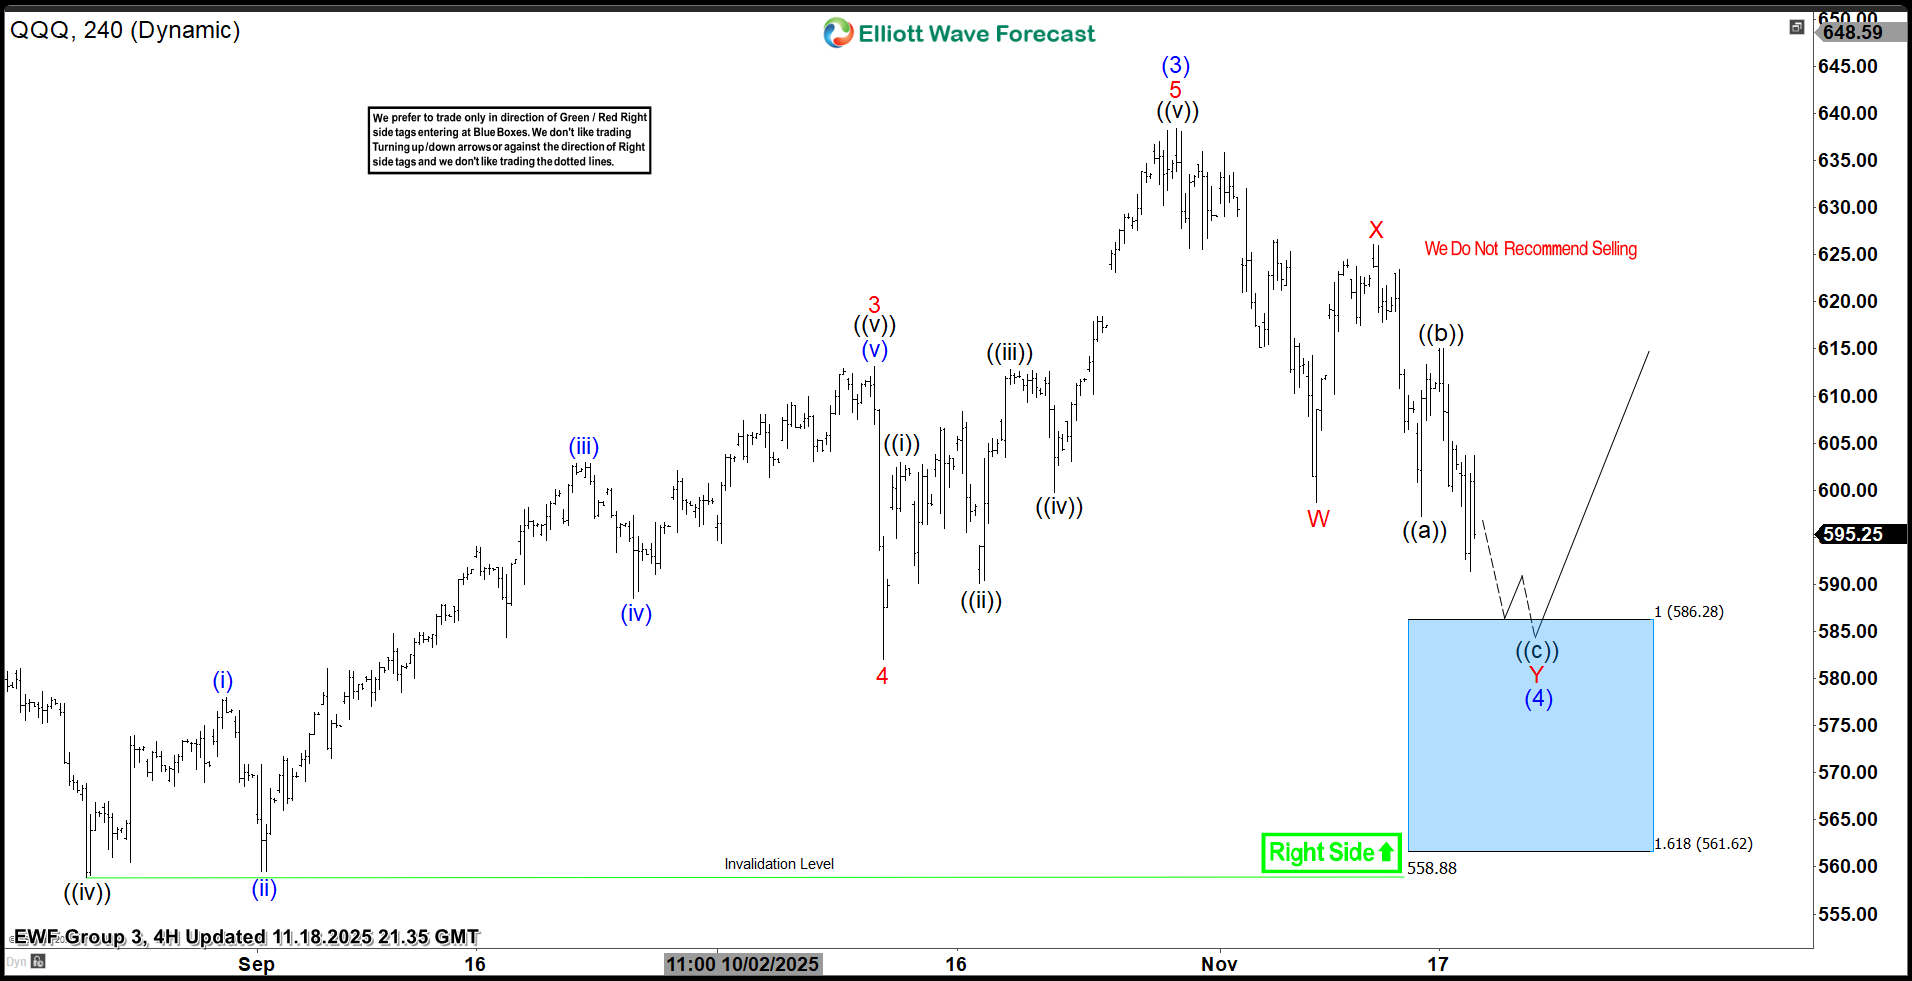
QQQ : Found Buyers After Double Three Pattern
Read MoreHello traders. As our members know we have had many profitable trading setups recently. In this technical article, we are going to talk about another Elliott Wave trading setup we got in Invesco NASDAQ ETF. Recently the ETF made a clear three-wave correction. The pull back completed as Elliott Wave Double Three pattern and made […]
-
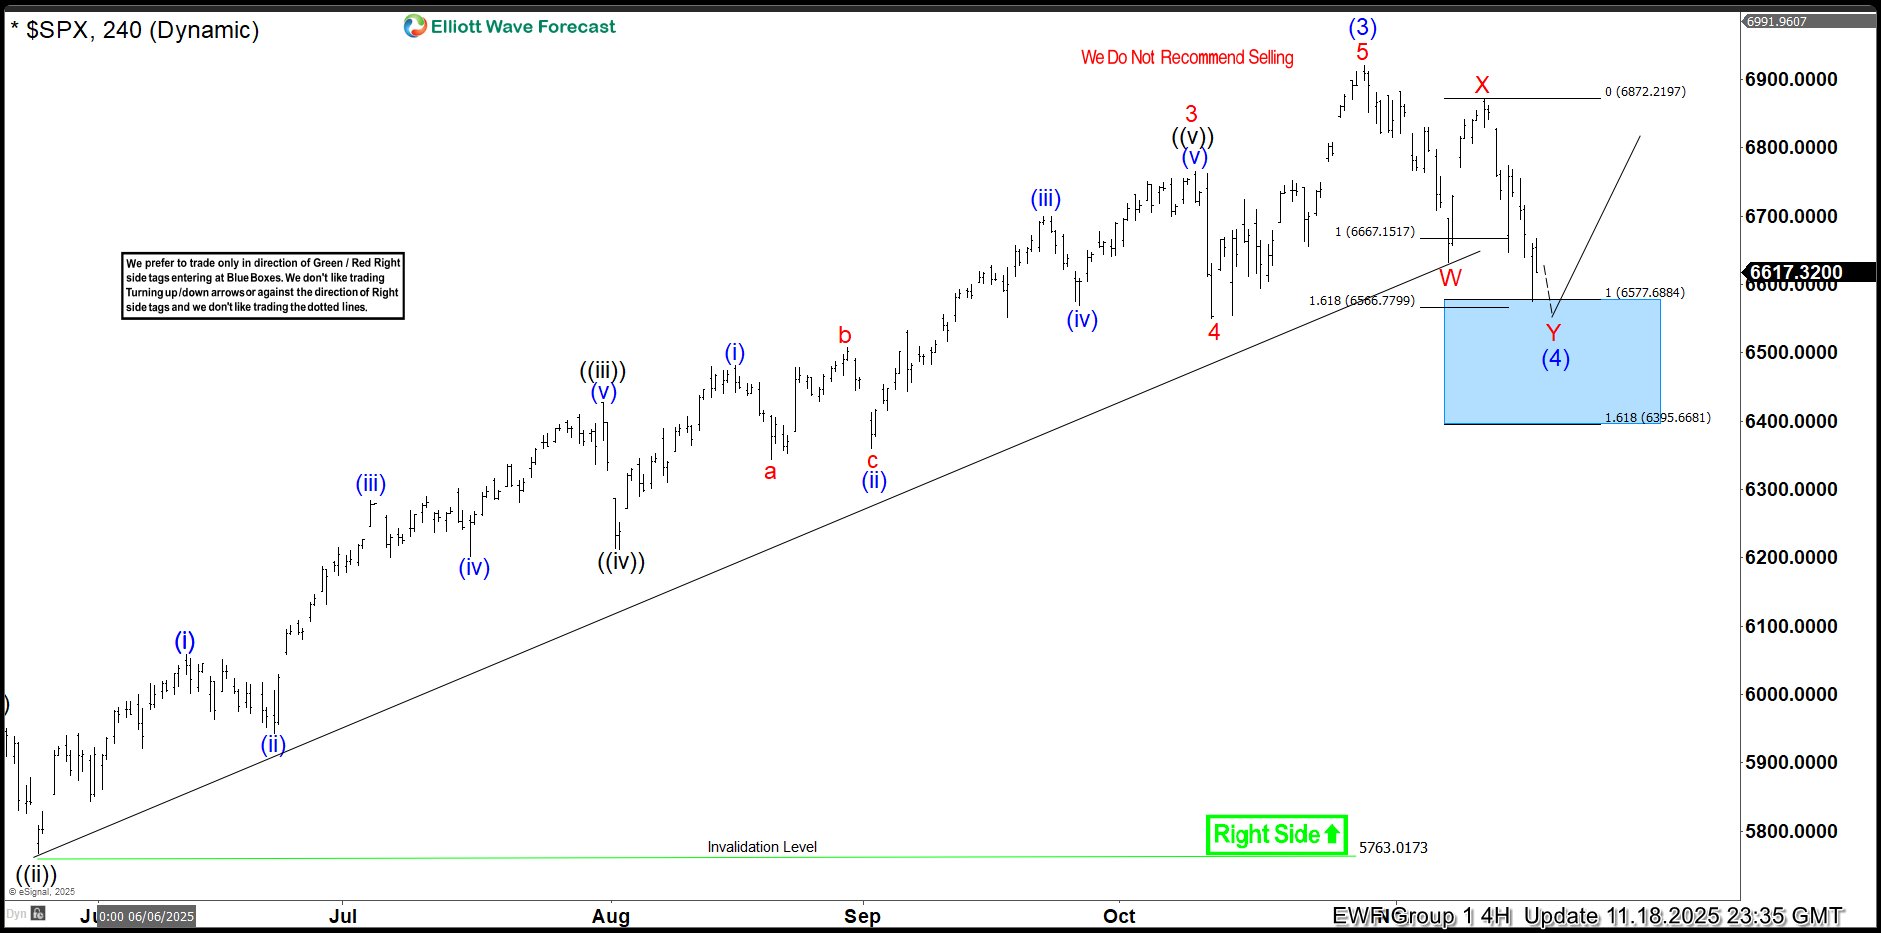
S&P 500 (SPX) Elliott Wave: Buying the Dips in a Blue Box
Read MoreHello fellow traders, As our members know we have had many profitable trading setups recently. In this technical article, we are going to present another Elliott Wave trading setup we got in S&P 500 Index . SPX completed this correction precisely at the Equal Legs zone, referred to as the Blue Box Area. In the […]
-
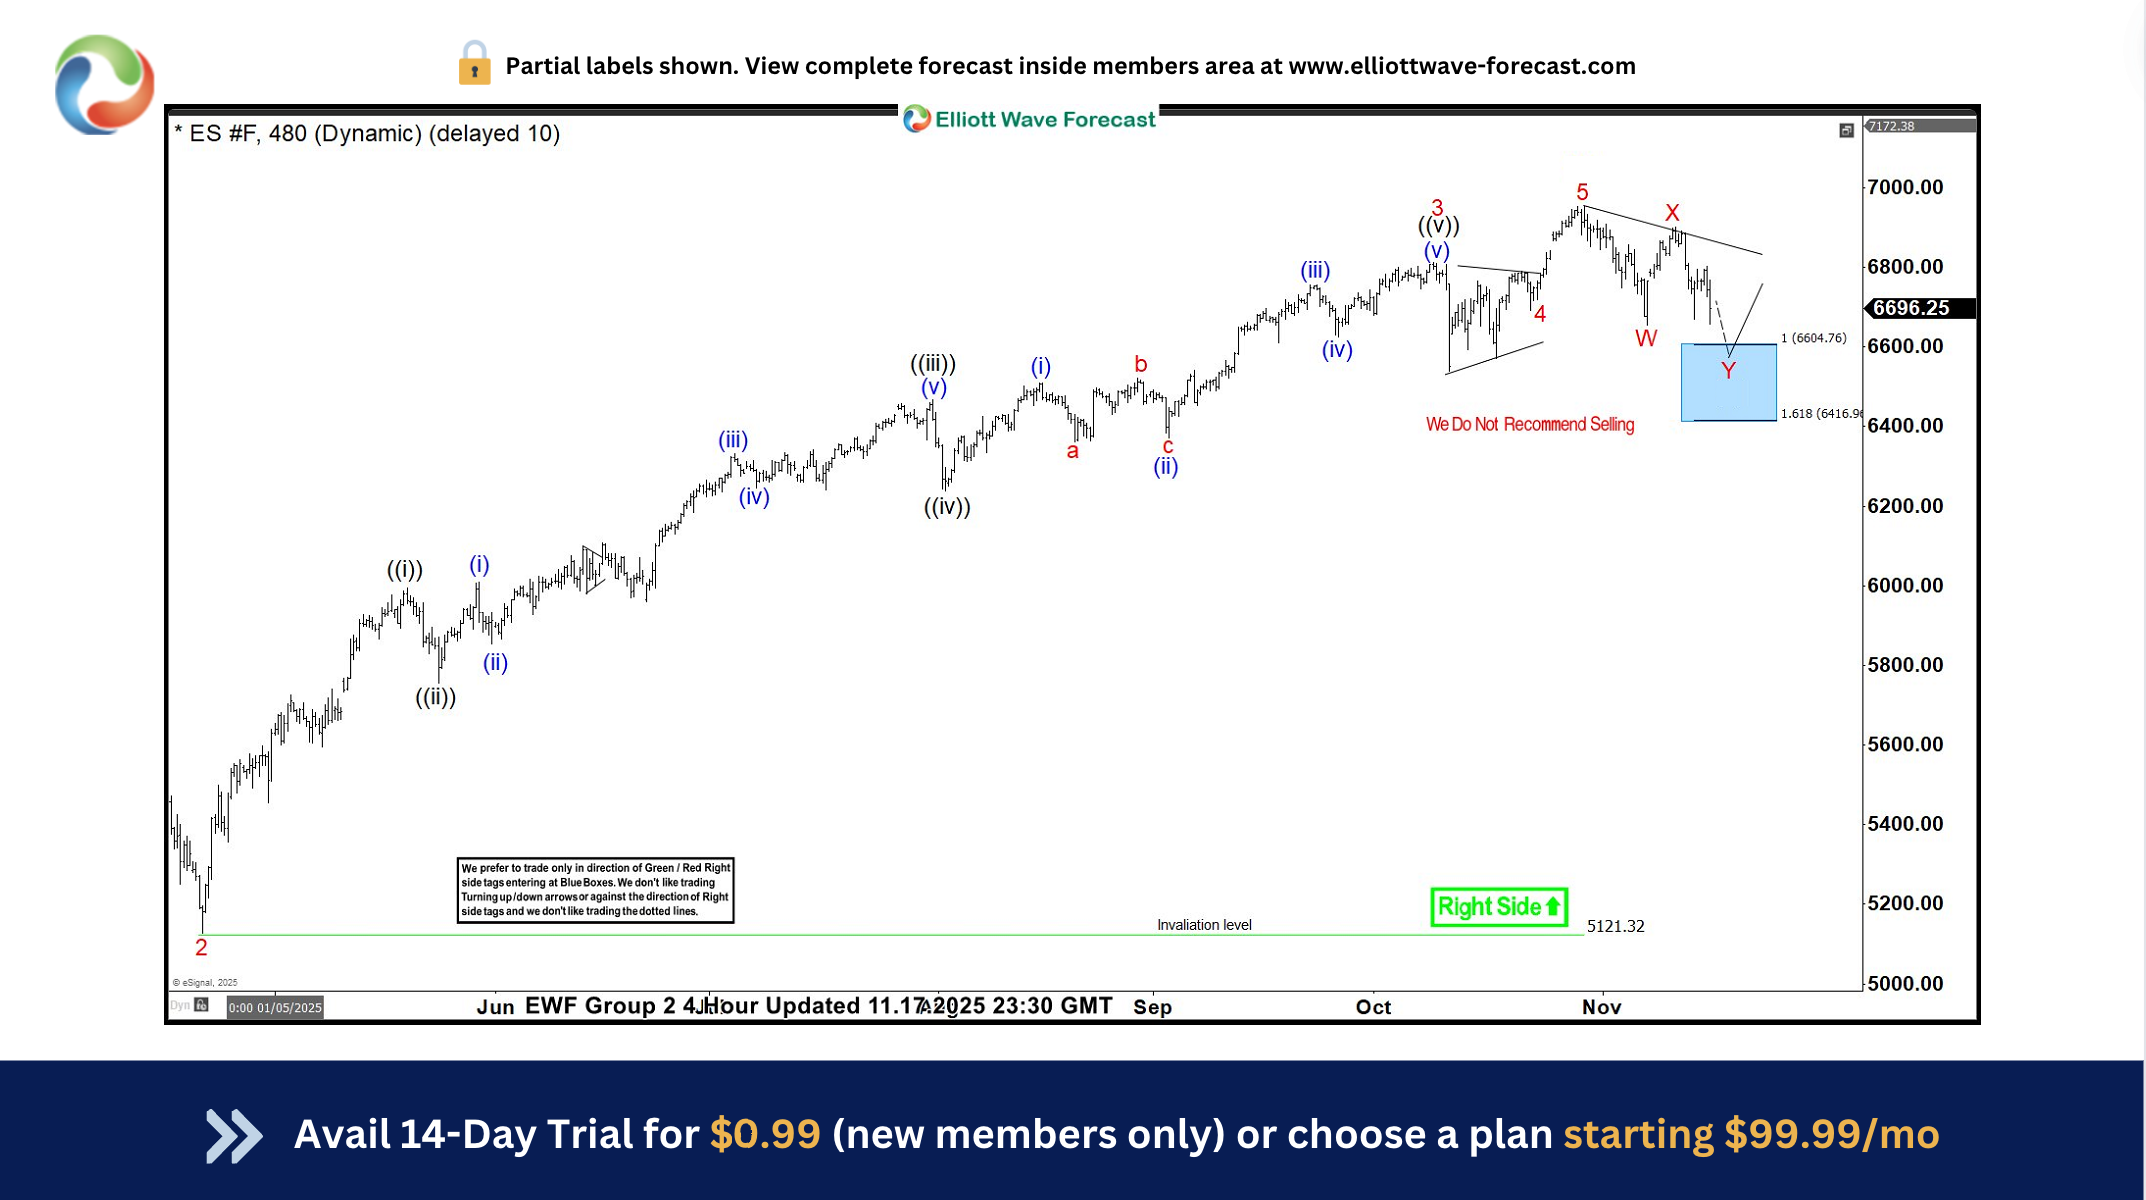
S&P 500 E-Mini (ES_F) Elliott Wave: Blue Box Buy Setup Explained
Read MoreHello fellow traders, As our members know we have had many profitable trading setups recently. In this technical article, we are going to present another Elliott Wave trading setup we got in SPX E-Mini ( ES_F ) . ES_F completed this correction precisely at the Equal Legs zone, referred to as the Blue Box Area. […]