
-
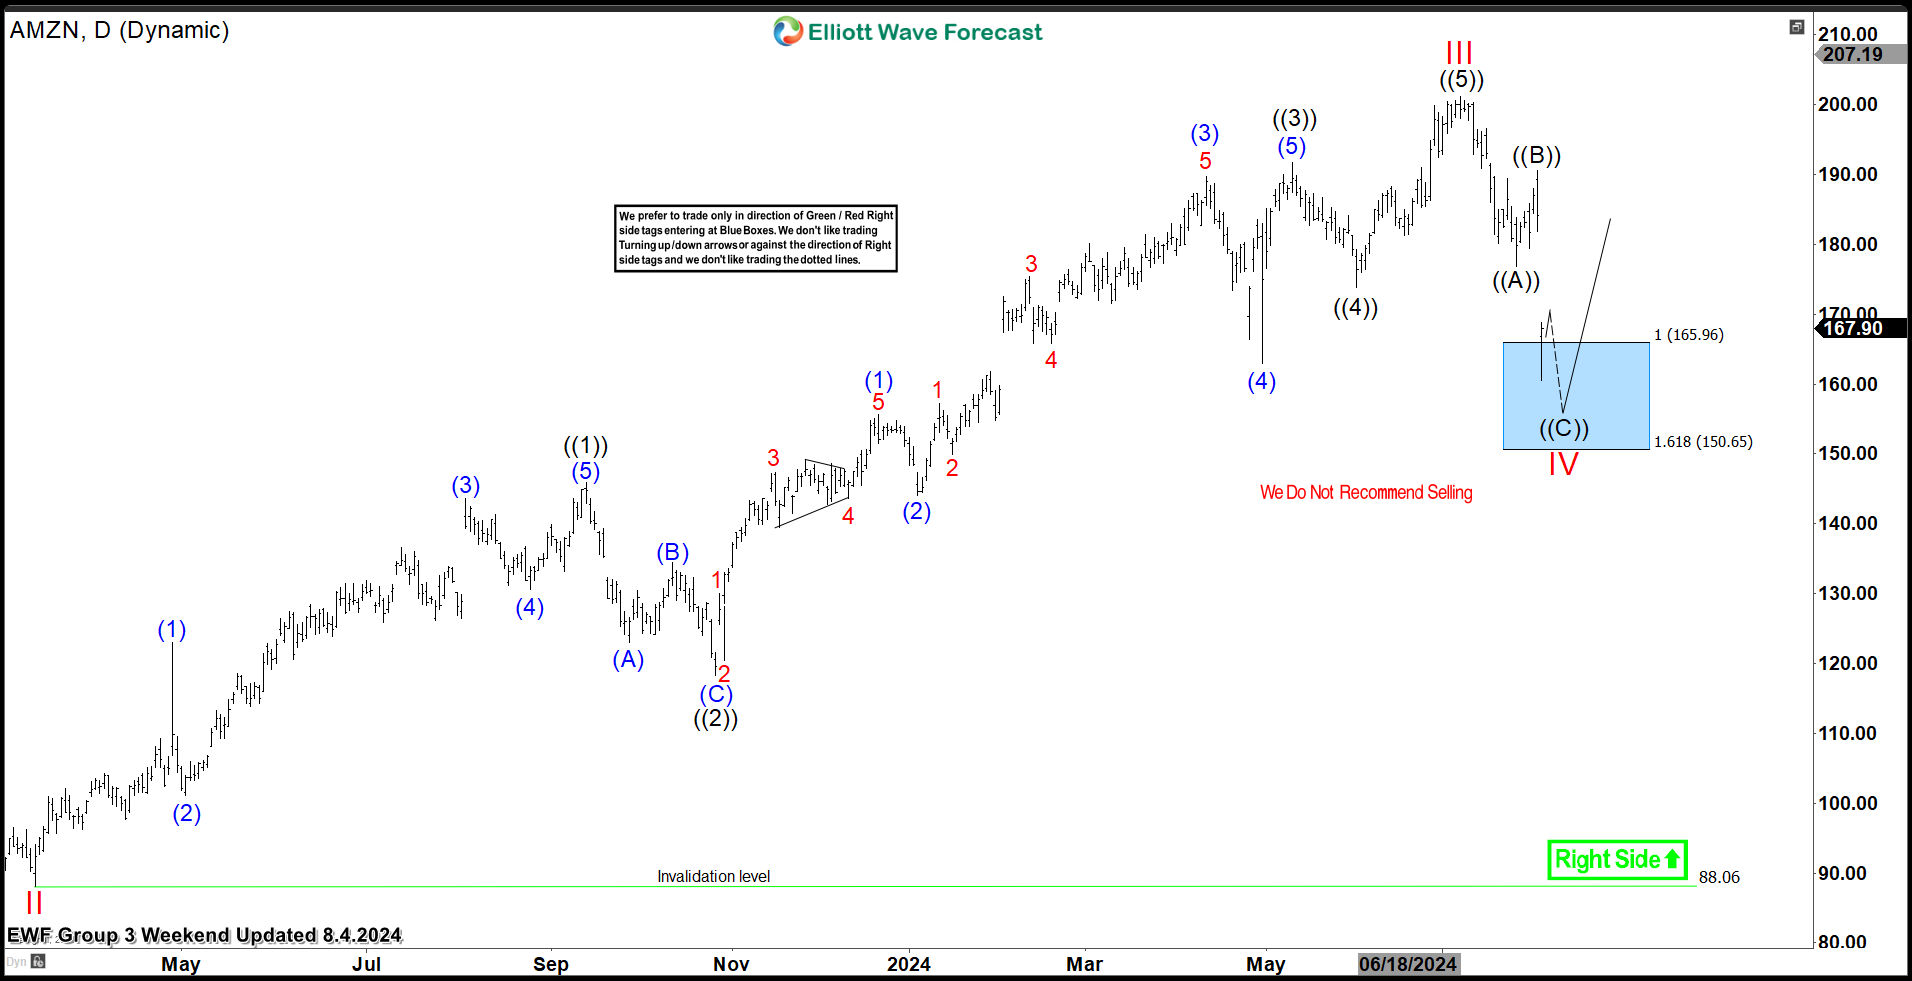
Amazon.com Inc. ( $AMZN) Found Buyers At The Blue Box Area As Expected.
Read MoreHello everyone. In today’s article, we will look at the past performance of the Daily Elliott Wave chart of Amazon.com Inc. ($AMZN) . The rally from 3.13.2023 low at $88.06 unfolded as 5 waves impulse. So, we expected the pullback to unfold in 3 swings and find buyers again. We will explain the structure & forecast […]
-
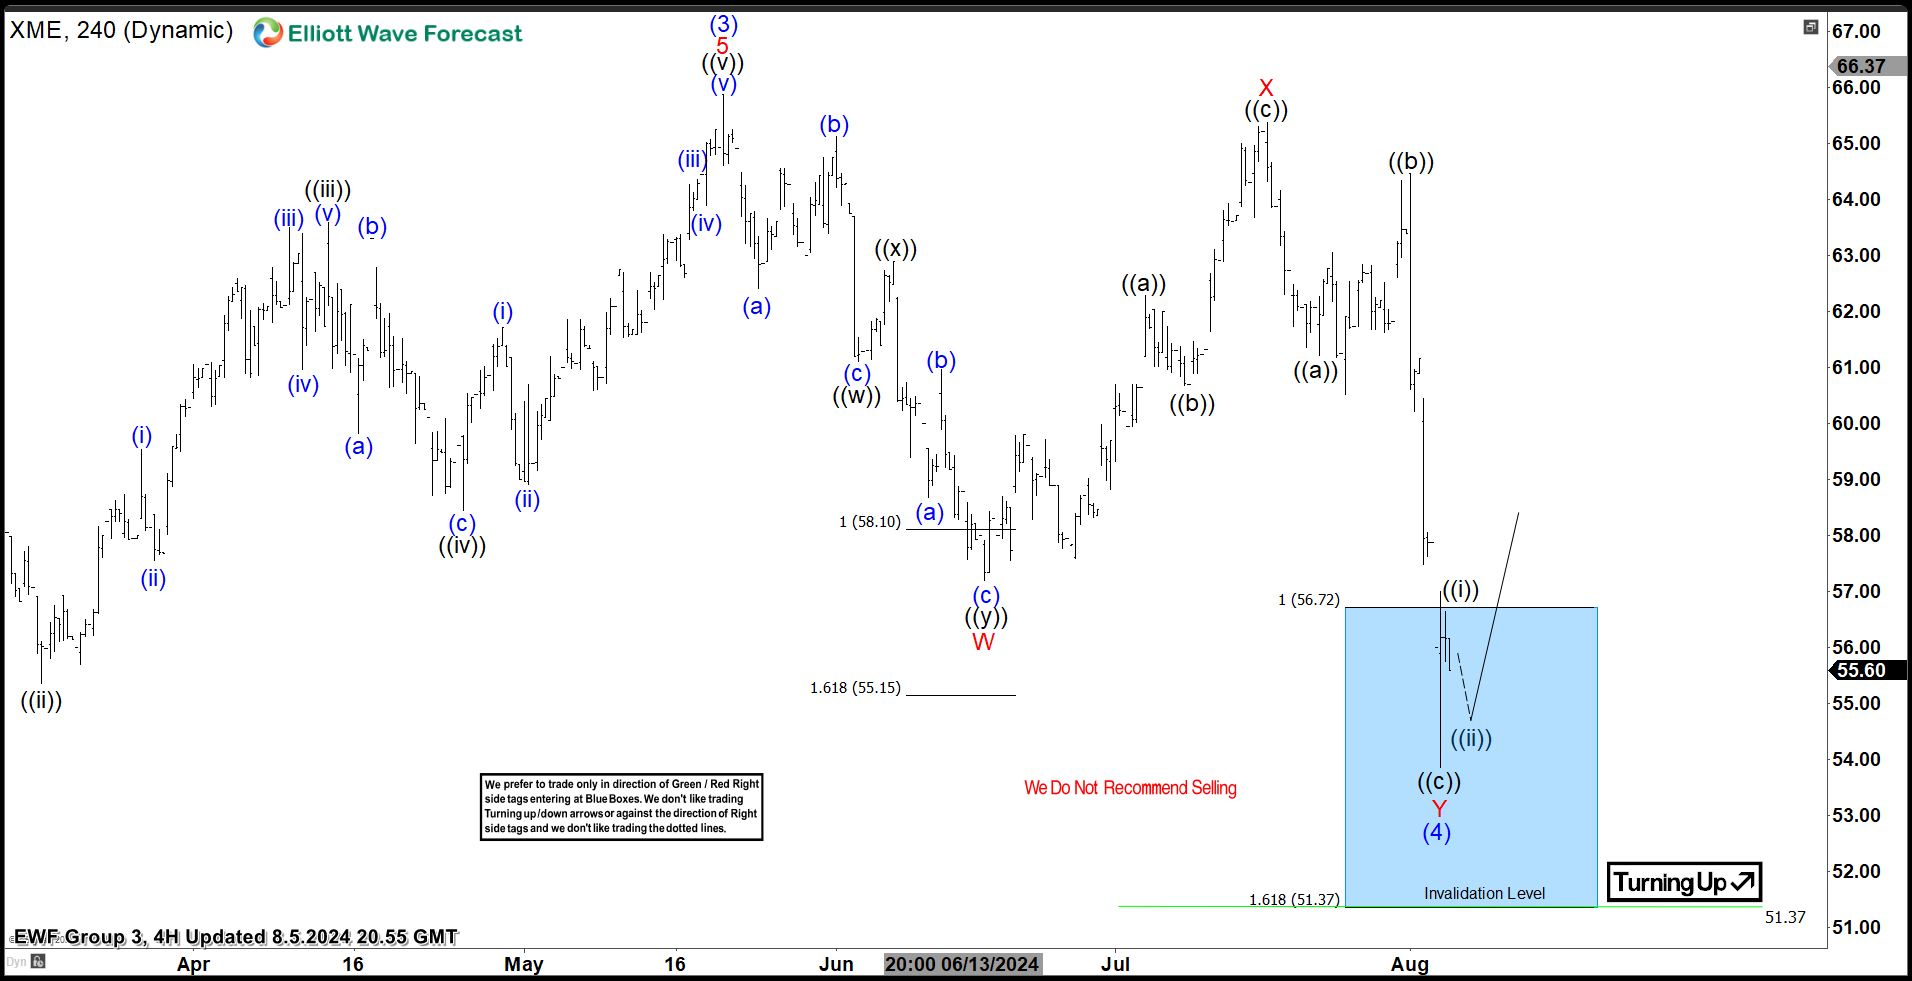
SPDR Metals & Mining ETF ( $XME ) Found Buyers At The Blue Box Area.
Read MoreHello everyone. In today’s article, we will look at the past performance of the 4H Hour Elliott Wave chart of SPDR Metals & Mining ETF ($XME). The rally from 5.31.2023 low unfolded as 5 waves impulse. So, we expected the pullback to unfold in 7 swings and find buyers again. We will explain the structure […]
-
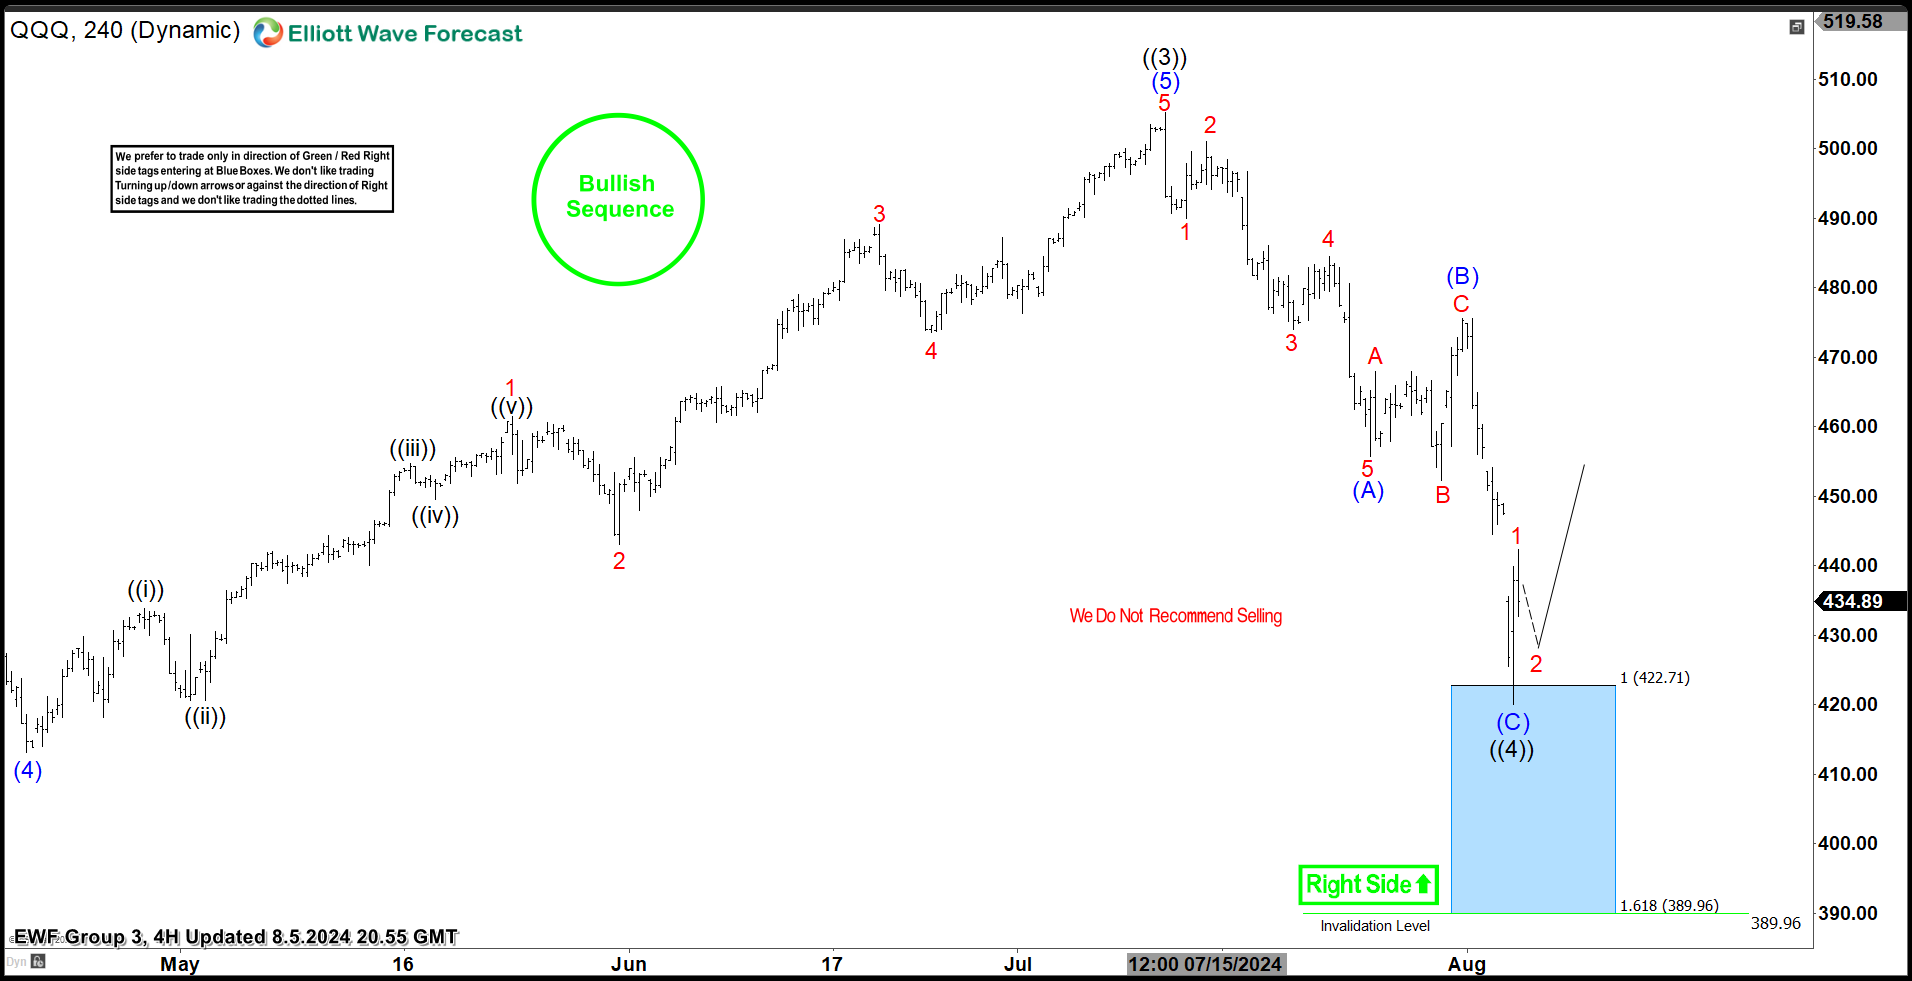
Invesco Nasdaq ETF ( $QQQ) Found Buyers At The Blue Box Area As Expected.
Read MoreHello everyone. In today’s article, we will look at the past performance of the 4H Hour Elliott Wave chart of Invesco Nasdaq ETF ($QQQ) . The rally from 10.23.2023 low unfolded as 5 waves impulse. So, we expected the pullback to unfold in 7 swings and find buyers again. We will explain the structure & […]
-
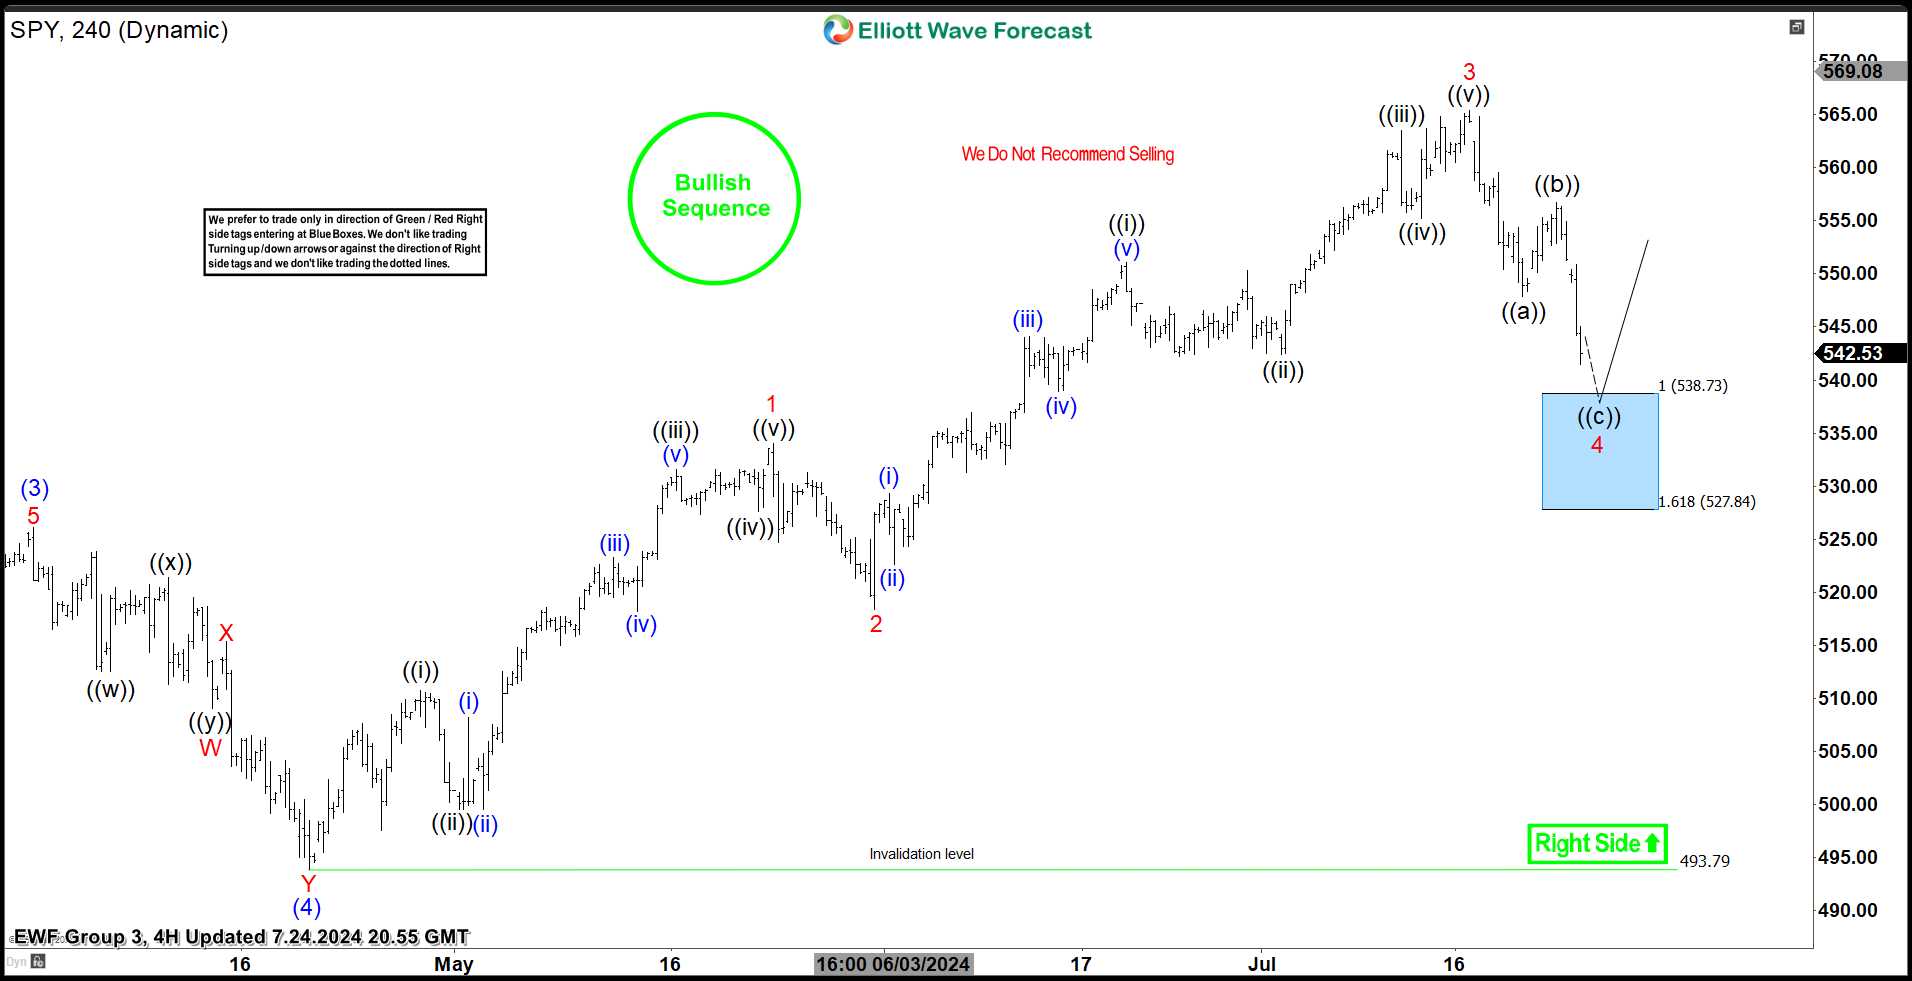
SPDR S&P 500 ETF ( $SPY) Found Buyers At The Blue Box Area As Expected.
Read MoreHello everyone. In today’s article, we will look at the past performance of the 4H Hour Elliott Wave chart of SPDR S&P 500 ETF ($SPY) . The rally from 4.19.2024 low at $493.79 unfolded as 5 waves impulse. So, we expected the pullback to unfold in 3 swings and find buyers again. We will explain […]
-

Riding the Wave: ($IYR)’s Impressive Rally and What’s Coming Next
Read MoreHello everyone! In today’s article, we will follow up on the past performance of the Real Estate ETF ($IYR) forecast. We will also review the latest weekly count. First, let’s take a look at how we analyzed it back in March 2023. $IYR Weekly Elliott Wave View – March 2023: In our last article, we said that […]
-

Riding the Wave: ($ADBE)’s Impressive Rally and What’s Coming Next
Read MoreHello everyone! In today’s article, we will follow up on the past performance of Adobe Inc. ($ADBE) forecast. We will also review the latest daily count. First, let’s take a look at how we analyzed it back in March 2024. $ADBE Daily Elliott Wave View – March 2024: In our last article, we explained that $ADBE was […]