
-
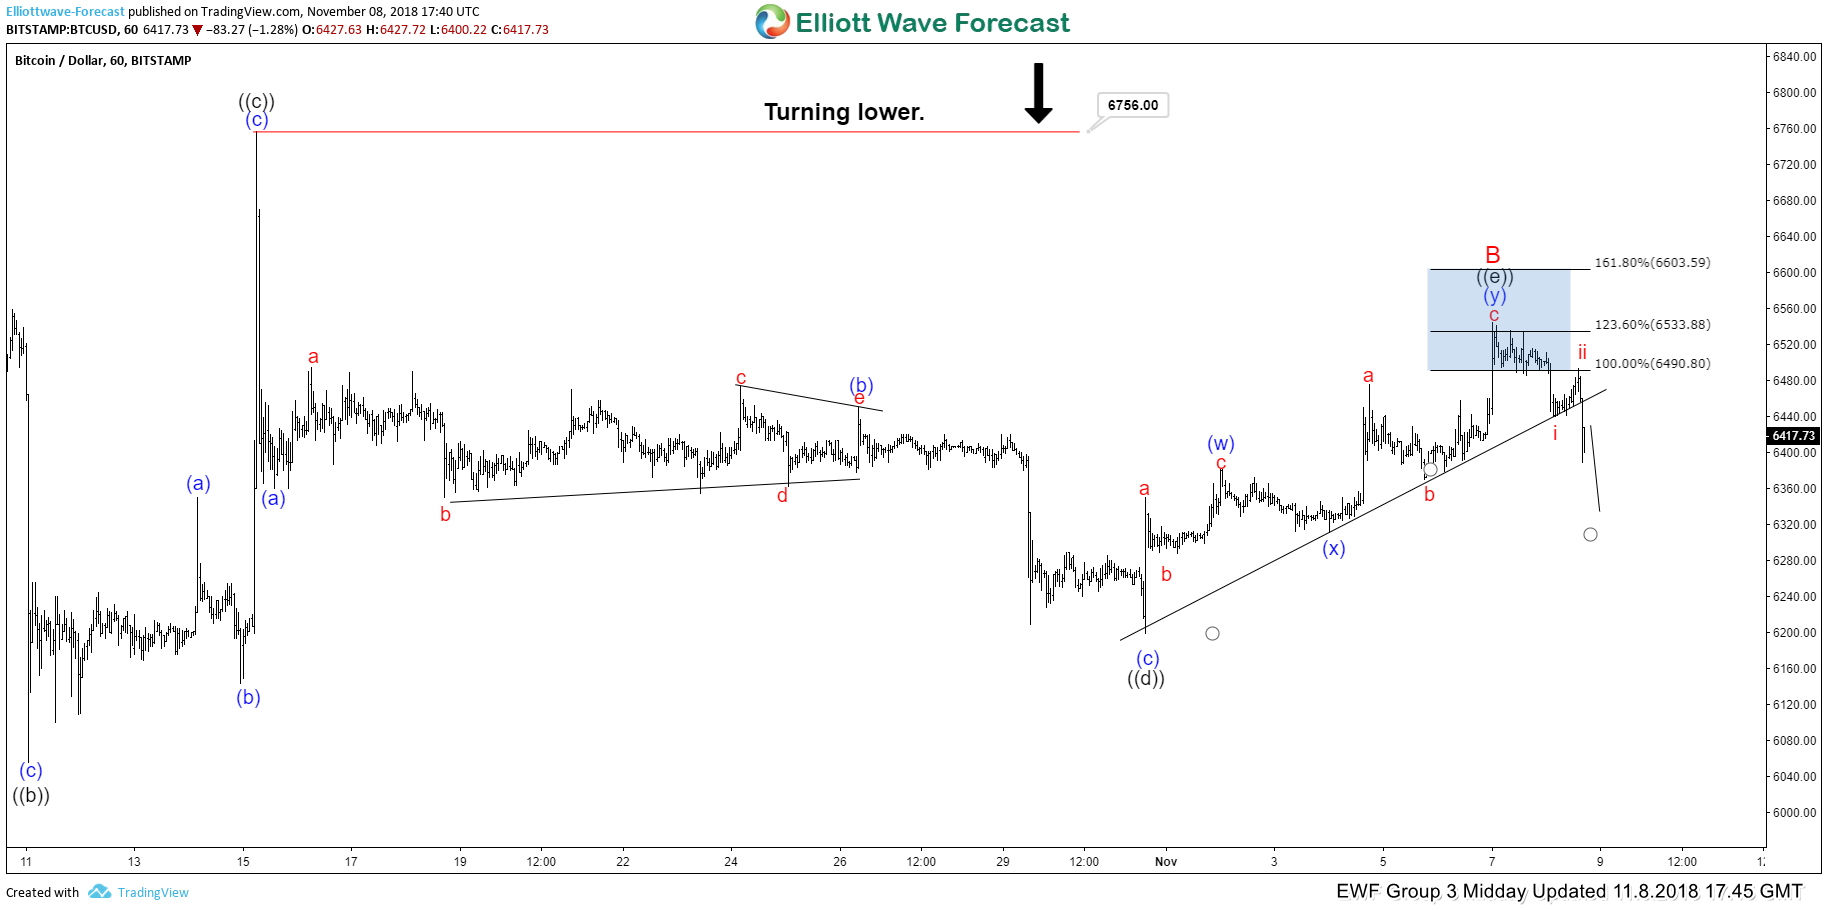
Bitcoin Elliott Wave View: Reacting lower From Blue Box
Read MoreIn this blog, I want to share some short-term Elliott Wave charts of Bitcoin which we presented to our members in the past. Below, you see the 1-hour updated chart presented to our clients on the 11/06/18 showing Bitcoin in an Elliott wave Tringle structure in red wave B pullback. Bitcoin ended the cycle from 10/15/18 peak in […]
-
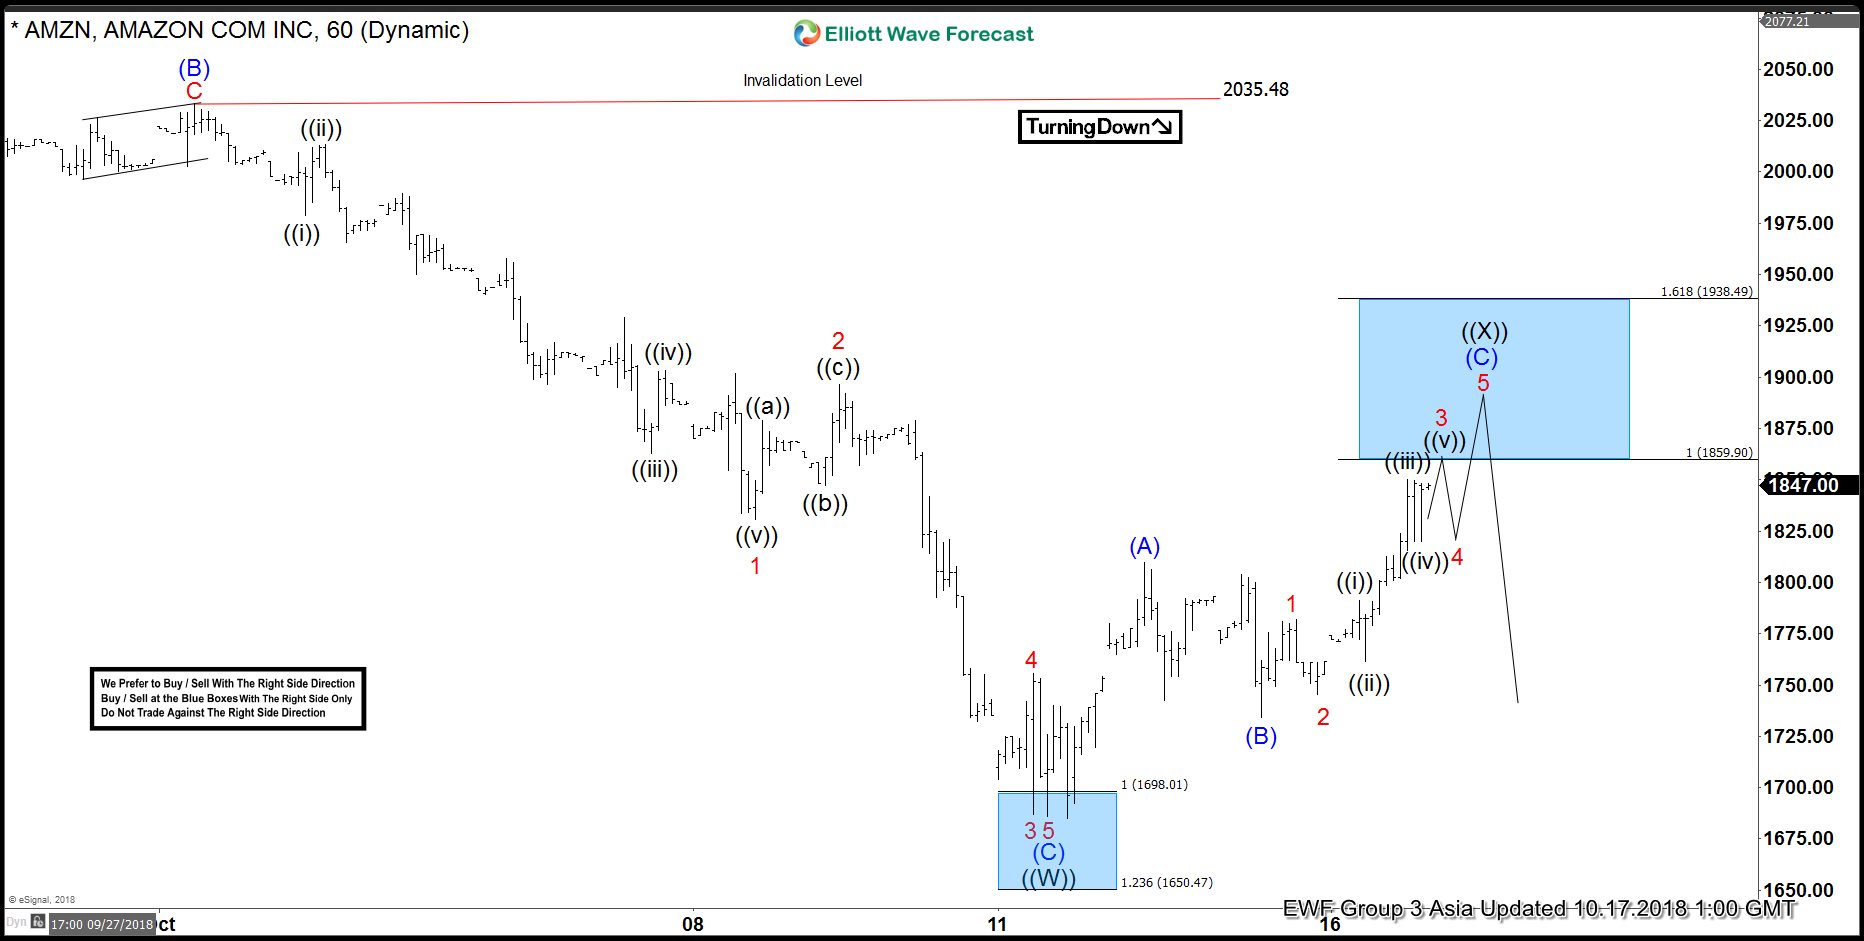
Amazon Elliott Wave View: Found Sellers in Blue Box
Read MoreIn this blog, I want to share some short-term Elliott Wave charts of Amazon which we presented to our members in the past. Below, you see the 1-hour updated chart presented to our clients on the 10/17/18 indicating that Amazon ended the cycle from 10/01/18 low in black wave ((W)). As Amazon ended the cycle from 10/01/18 peak, […]
-
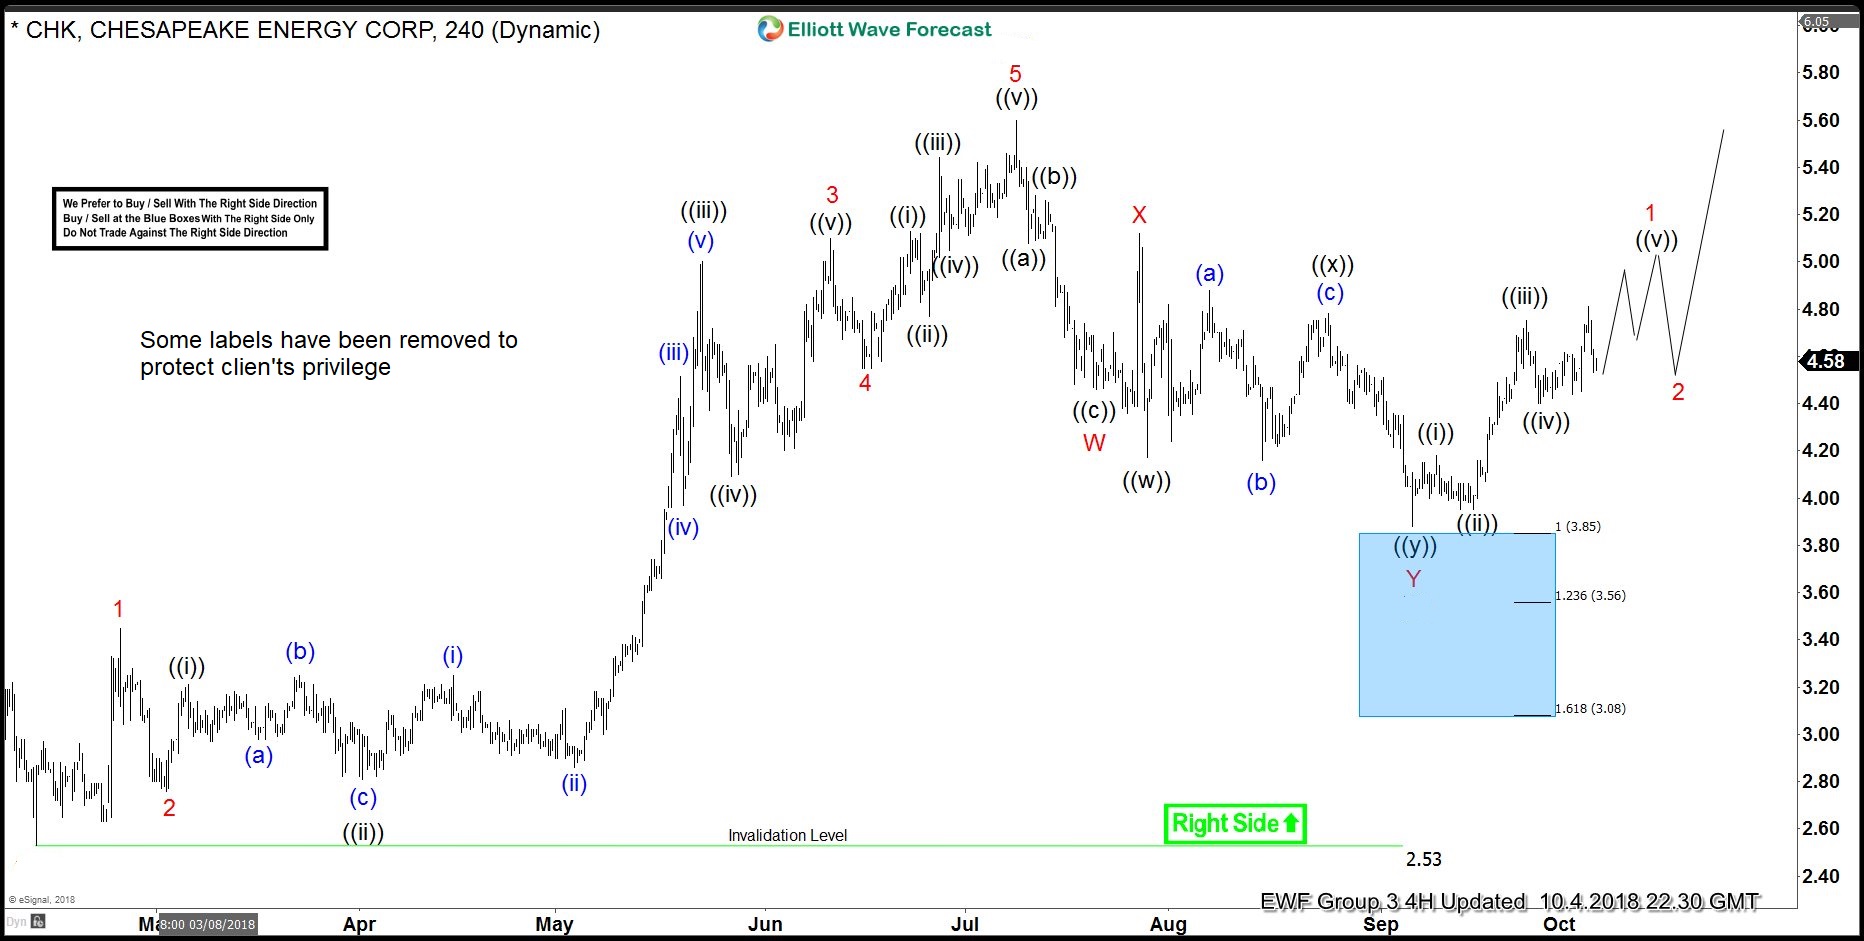
CHK Elliott Wave View: Found Buyers in Blue Box and Rallied
Read MoreHello fellow traders. Today, I want to share some Elliott Wave charts of the CHK stock which we presented to our members in the past. Below, you see the 4-hour updated chart presented to our clients on the 09/09/18. showing that CHK ended the cycle from 02/09/18 low (2.52) at the peak of 07/10/18 (5.59) Below from there, […]
-
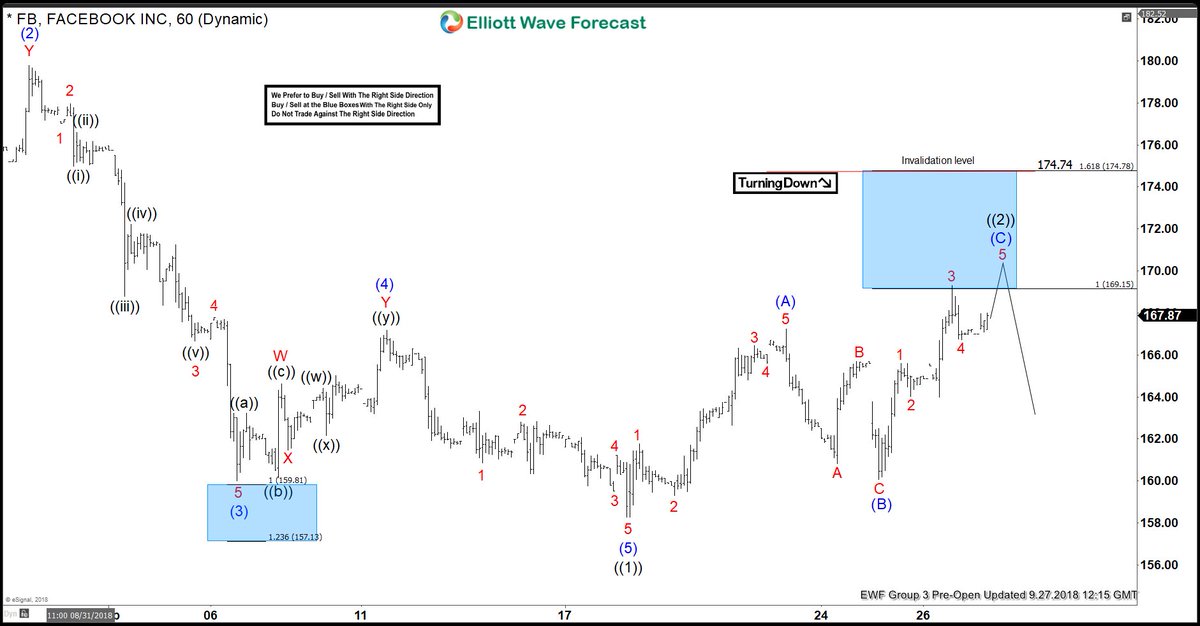
Facebook Elliott Wave View: Found Sellers in Blue Box Area
Read MoreIn this blog, I want to share some short-term Elliott Wave charts of the Facebook stock which we presented to our members in the past. Below, you see the 1-hour updated chart presented to our clients on the 09/27/18 indicating that FB ended the cycle from 8/07/2018 peak low in black wave ((1)). The internals of that move […]
-
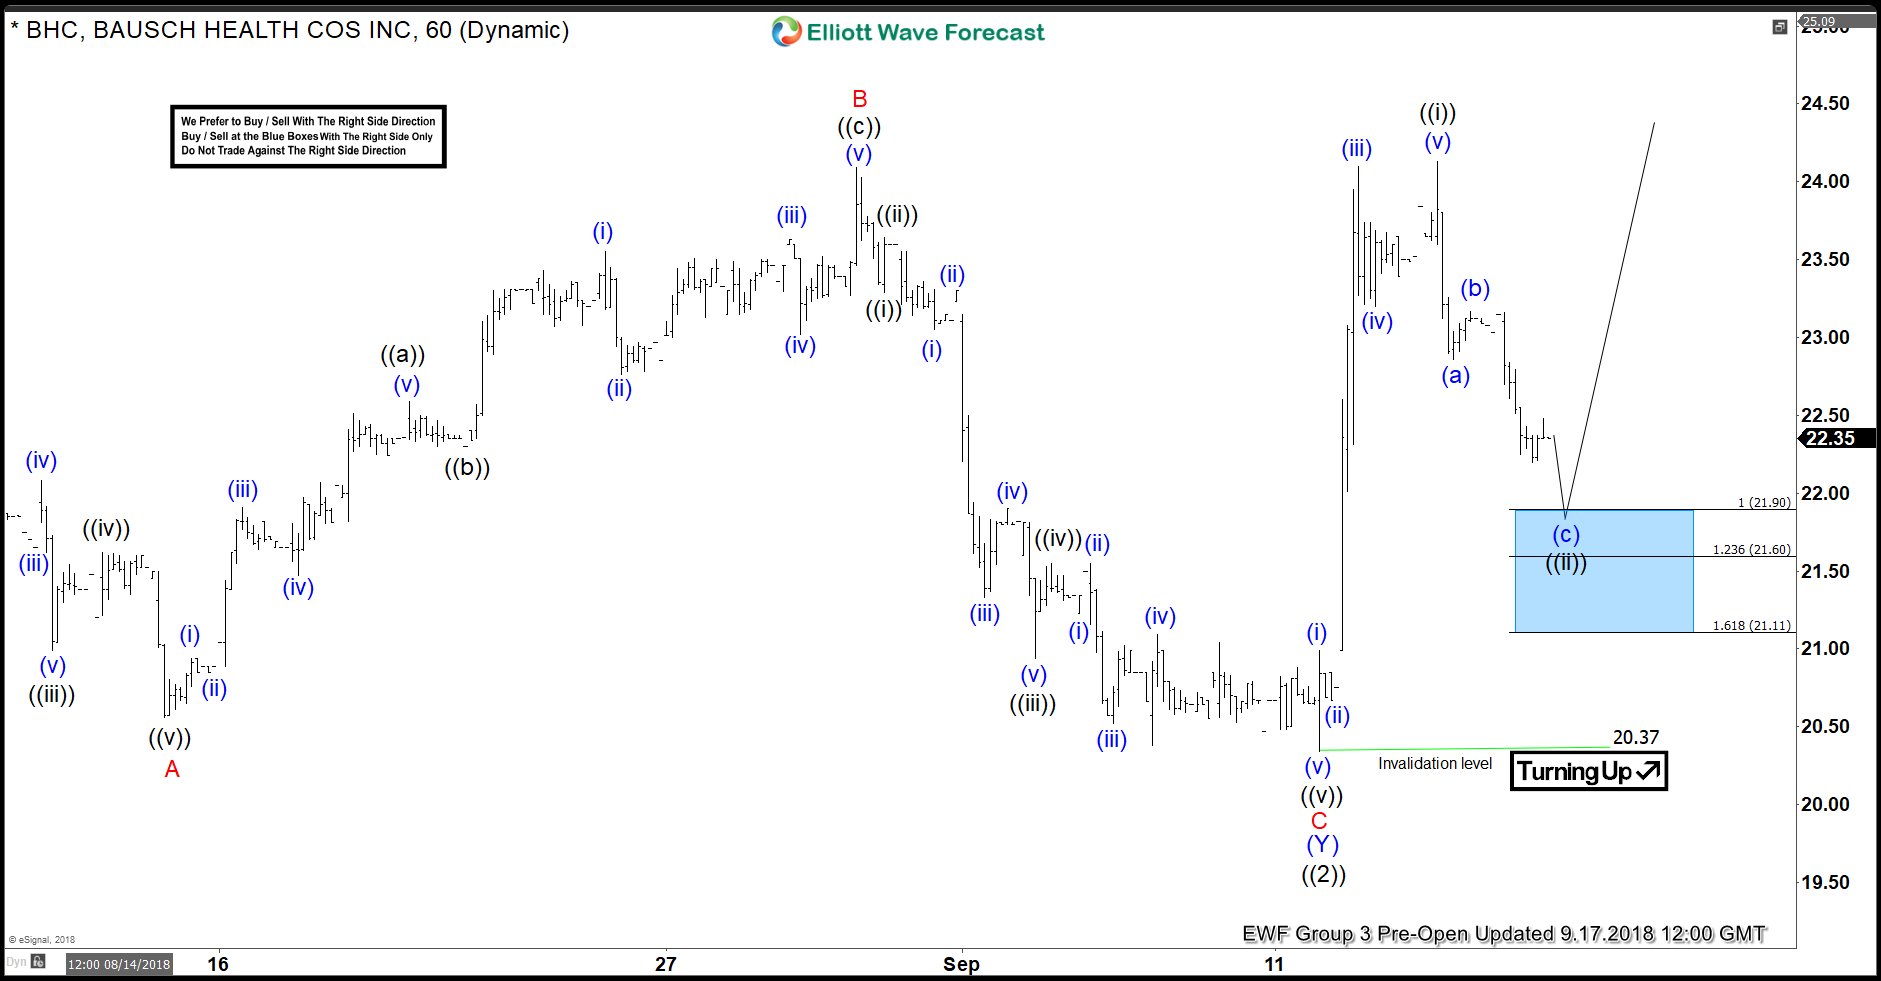
BHC Elliott Wave Analysis: Inflection Area Called The Bounce
Read MoreIn this blog, I want to share some short-term Elliott Wave charts of the BAUSCH Health stock which we presented to our members in the past. Below, you see the 1-hour updated chart presented to our clients on the 09/17/18 indicating that BHC ended the cycle from 06/13 peak low in black wave ((2)). As BHC ended the […]
-
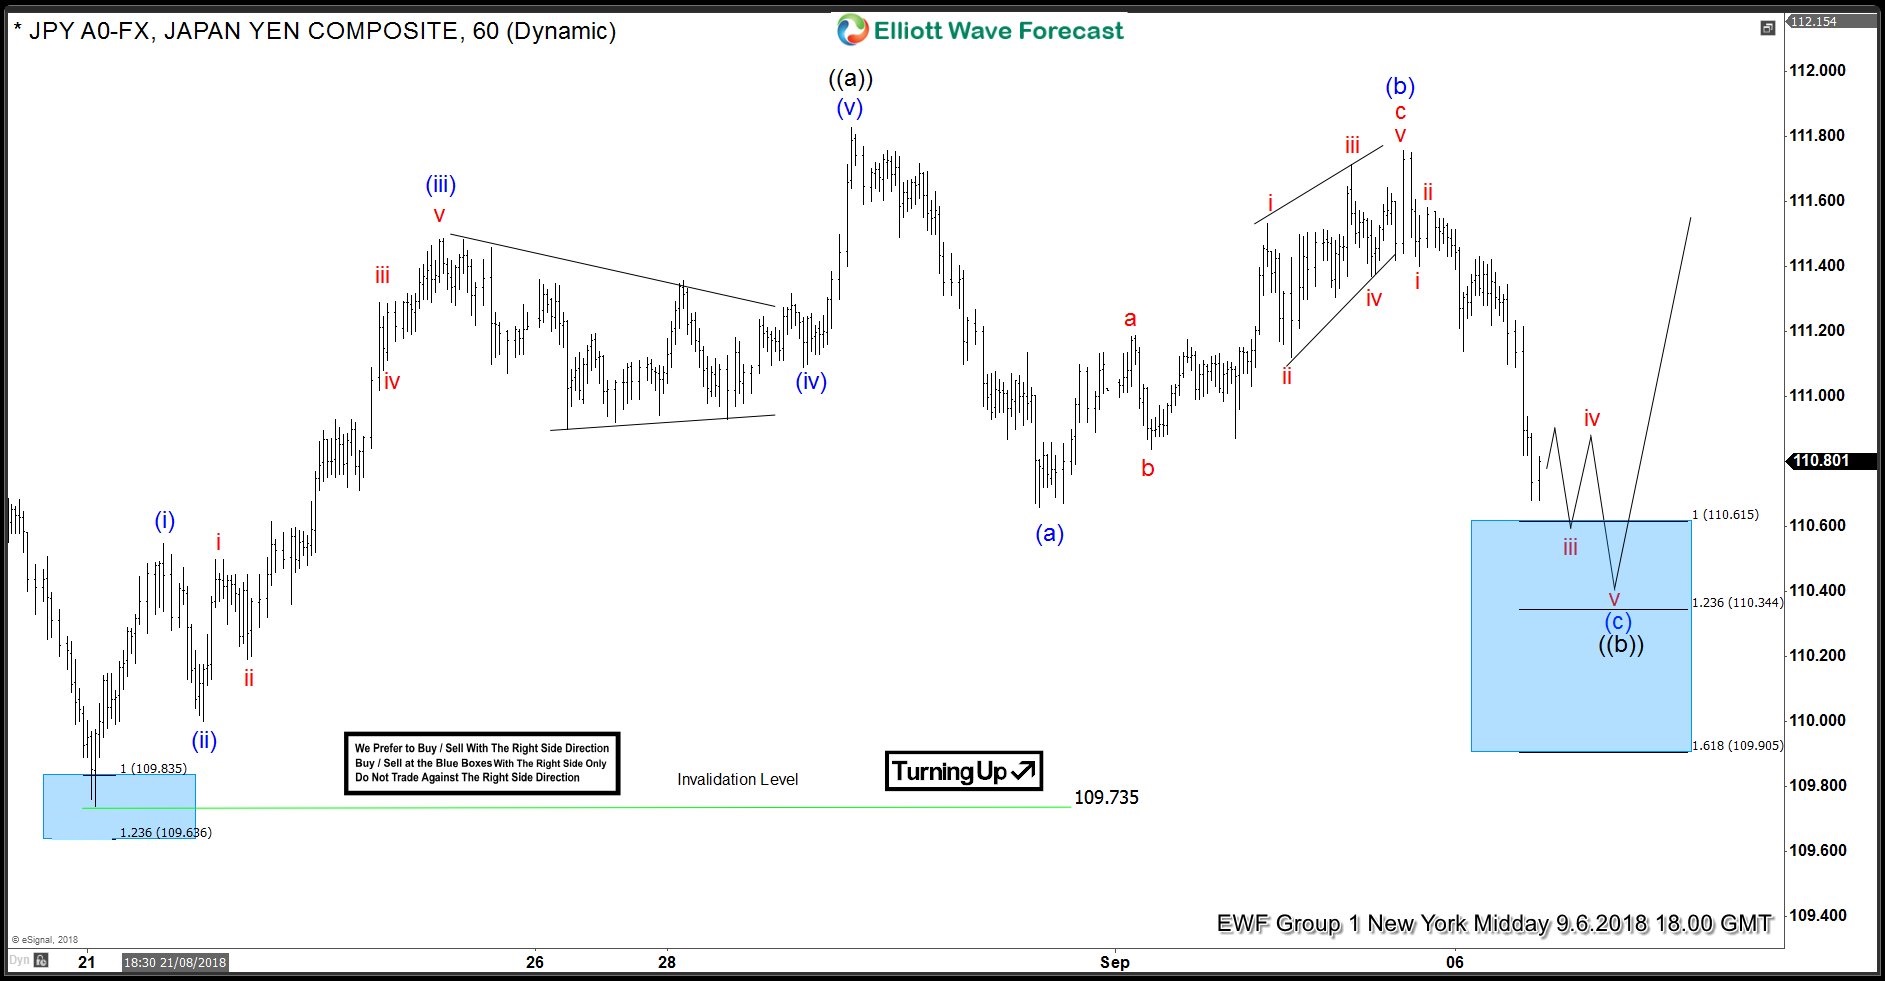
USDJPY: Elliott Wave Forecasting The Rally
Read MoreIn this blog, we will have a look at some past Elliott Wave charts of USDJPY which we presented to our members. You see the 1-hour updated chart presented on the 09/06/18 showing that USDJPY ended the cycle from 08/21 low in black wave ((a)). From that peak. It started a pullback lower in black wave ((b)). […]