
-
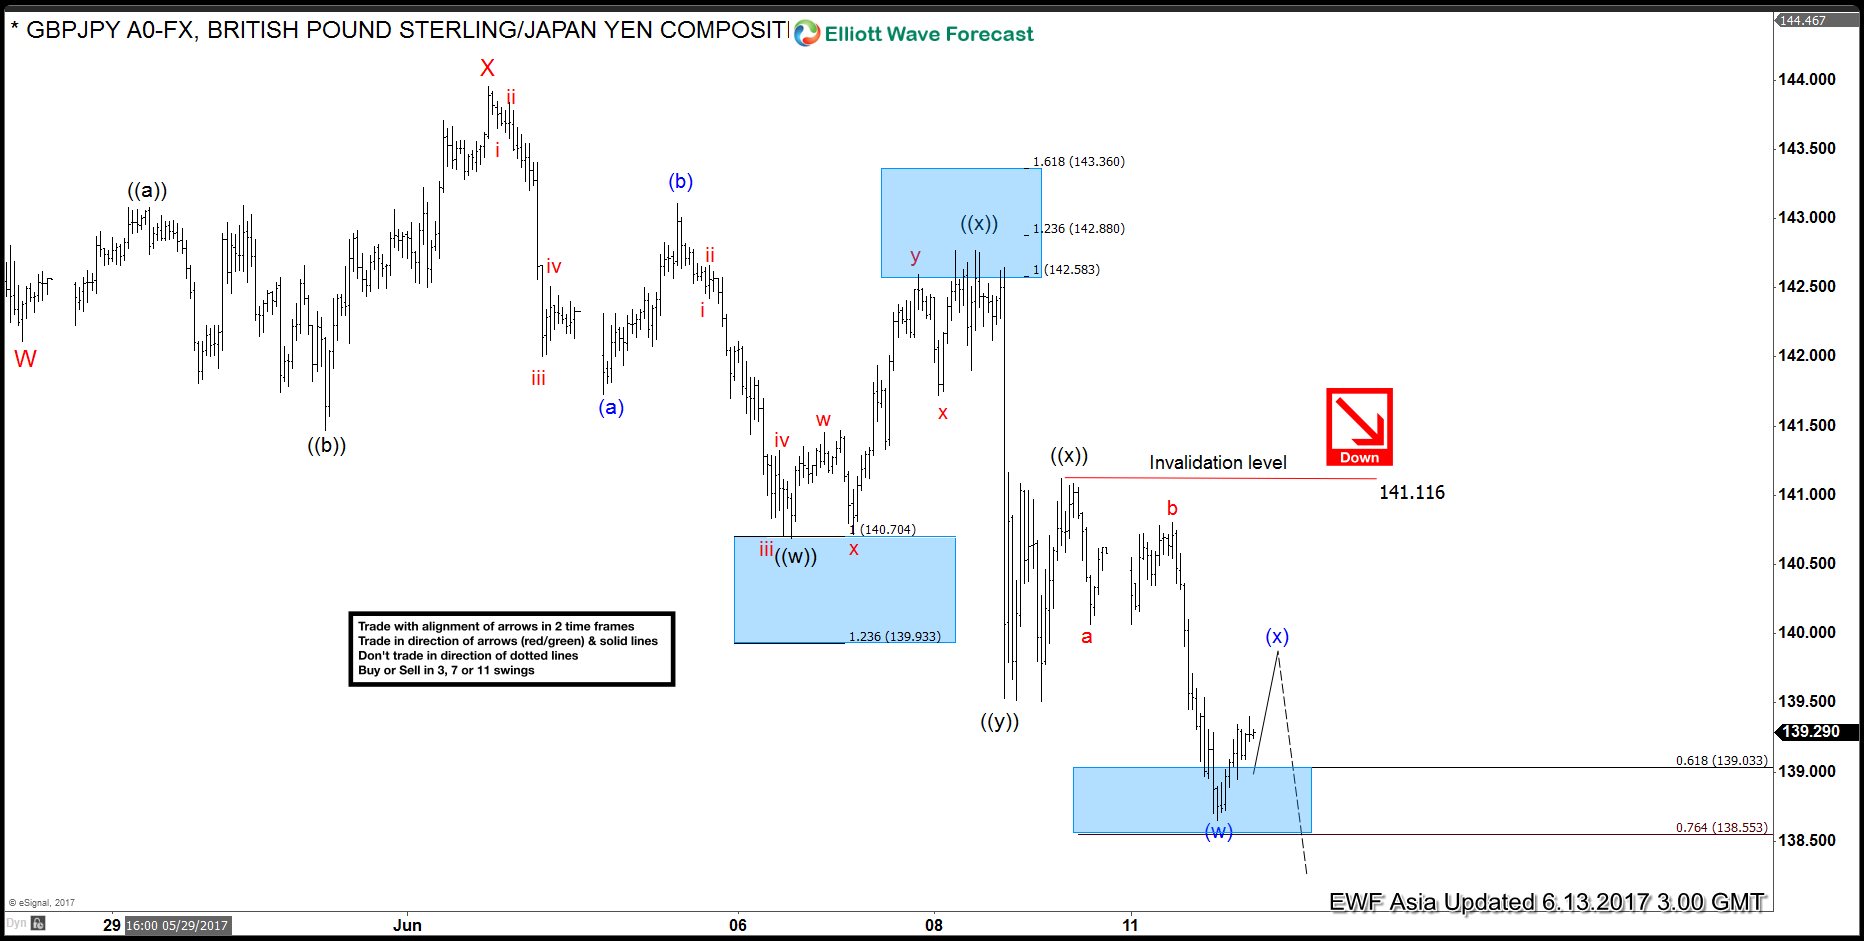
GBPJPY Elliott Wave Analysis : Extension Lower
Read MoreShort term GBPJPY Elliott Wave view suggests the decline from 5/10 high shows a 5 swing sequence, thus favoring more downside. Decline from 5/10 high is unfolding as a double three Elliott Wave structure. Down from 5/10 peak (148.11), Minor wave W ended at 141.47 and Minor wave X ended at 143.96. Minor wave Y is currently in progress and has […]
-
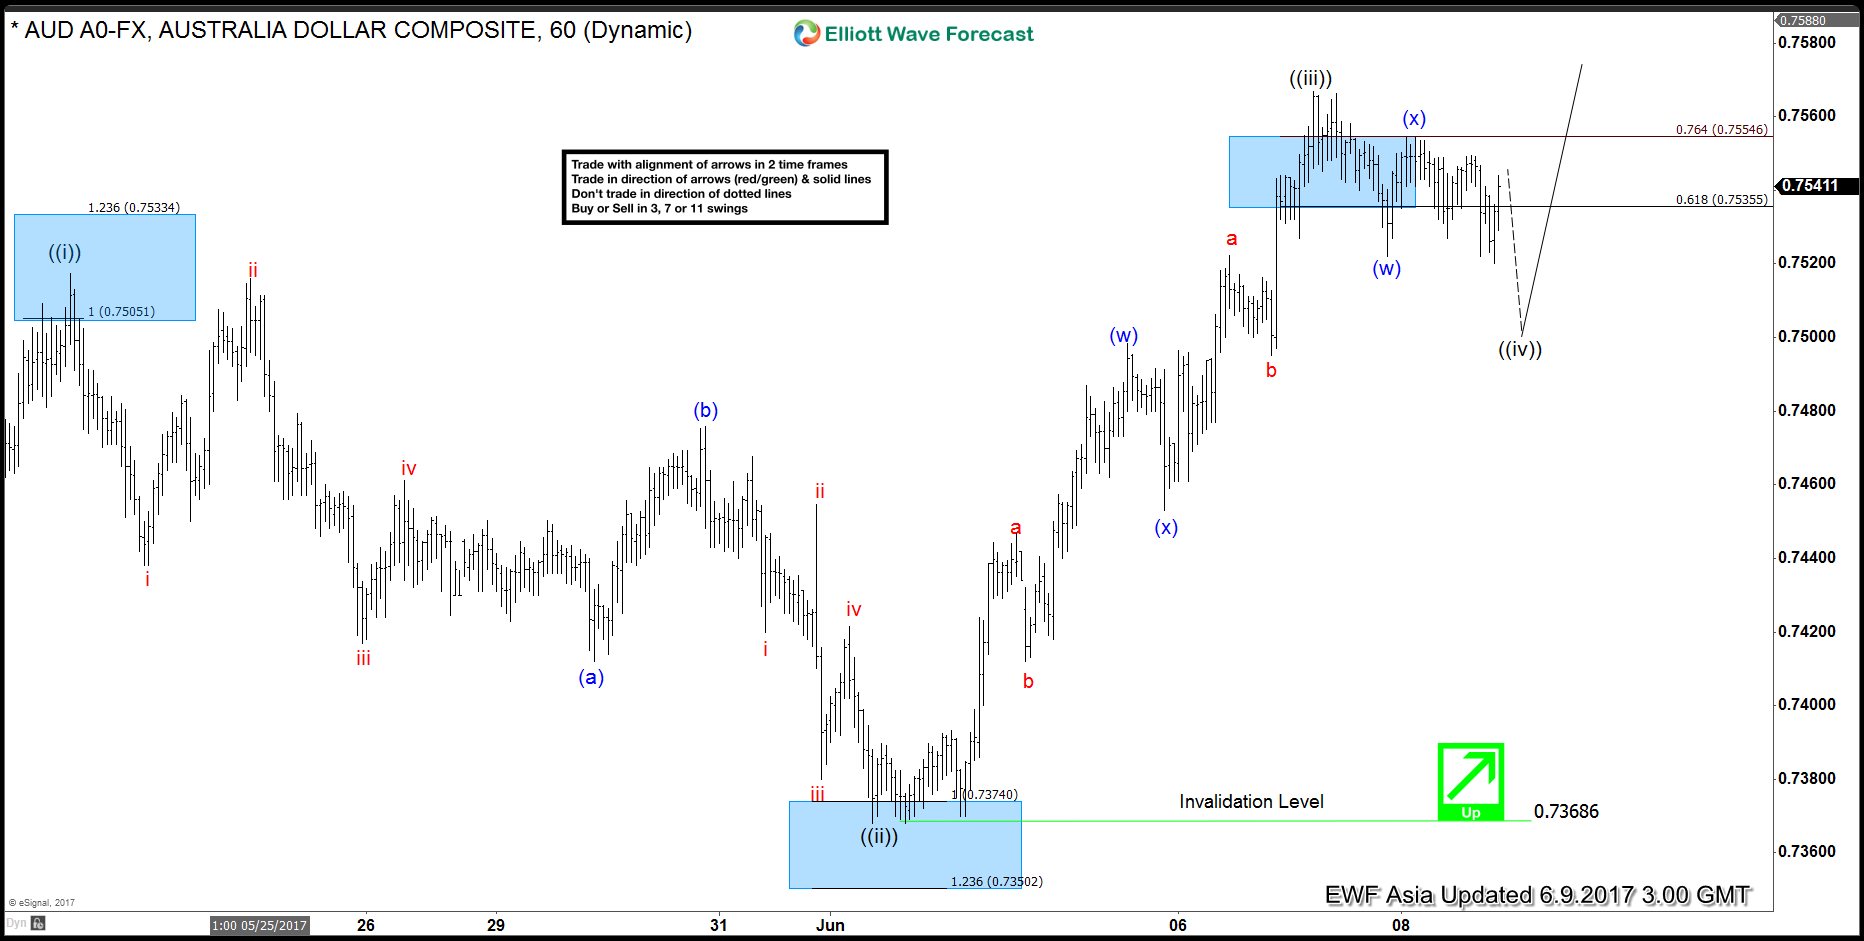
AUDUSD Elliott Wave Analysis 6.9.2017
Read MoreRevised short term AUDUSD Elliott Wave view suggests the rally from 5/9 low is unfolding as a leading diagonal Elliott Wave structure. Up from 5/9 (0.7325) low, Minute wave ((i)) ended at 0.7517, Minute wave ((ii)) ended at 0.7368, and Minute wave ((iii)) ended at 0.7566. Minute wave ((iv)) pullback is currently in progress to correct cycle from 6/1 […]
-
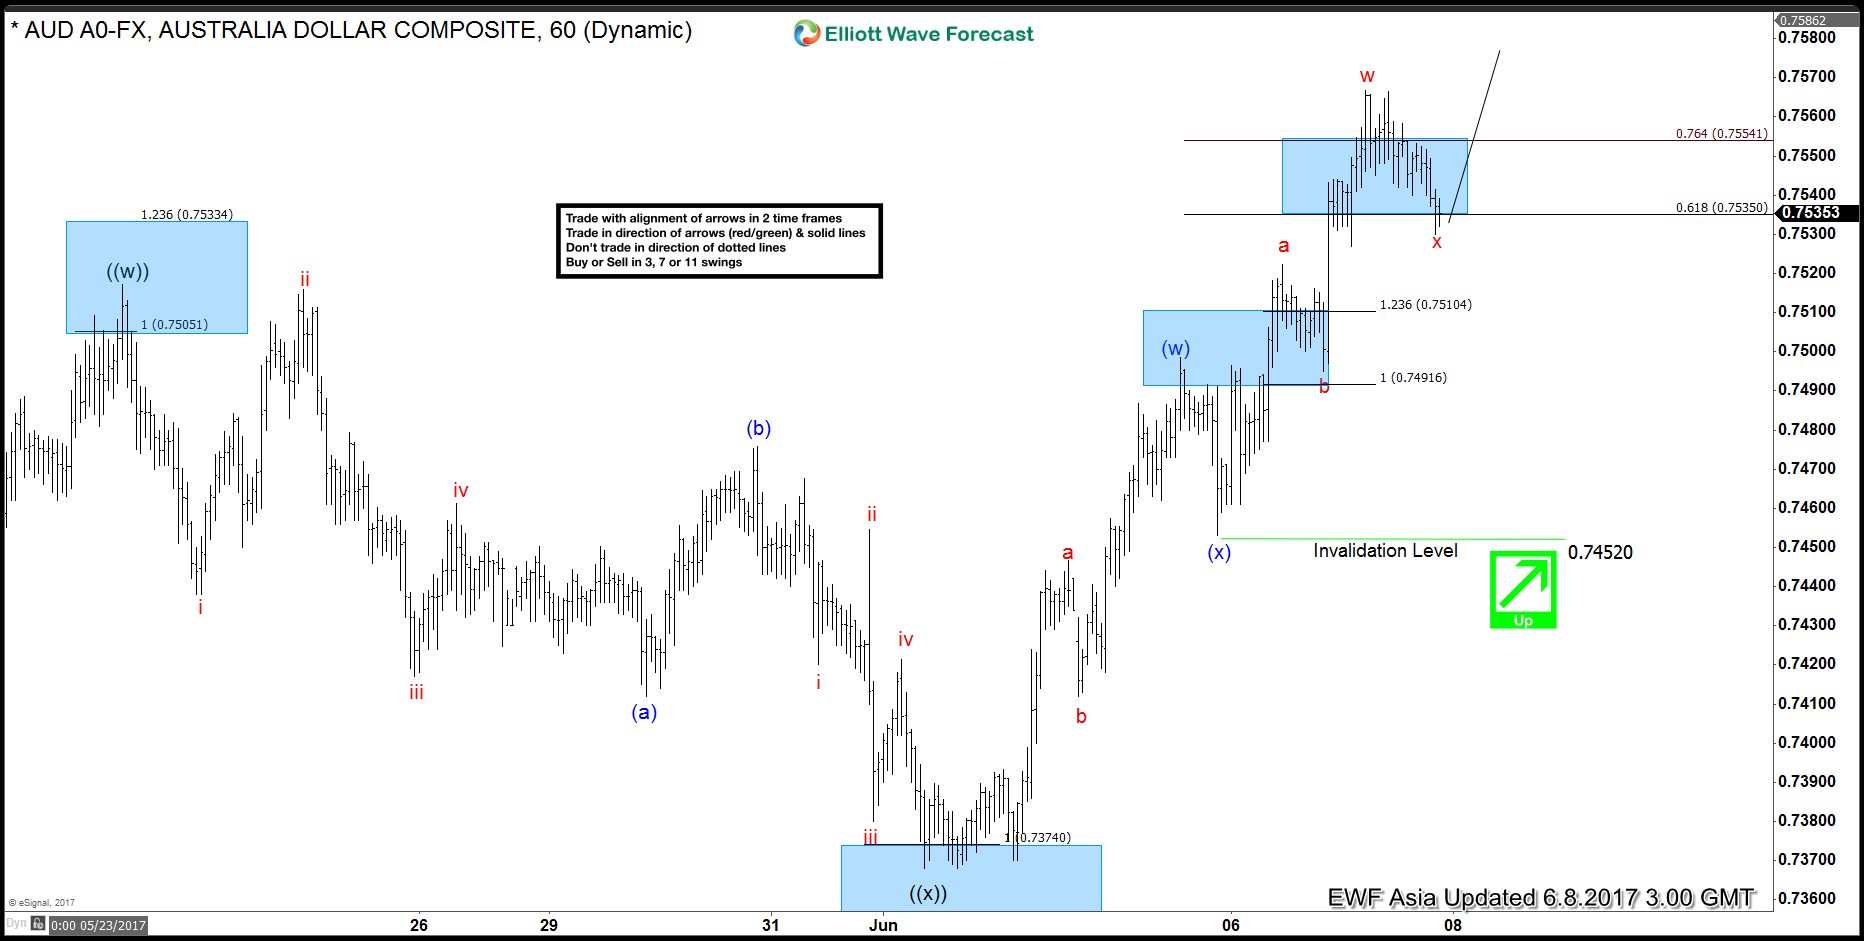
AUDUSD Elliott Wave View: Near Pullback
Read MoreShort Term AUDUSD Elliott Wave view suggests the rally from 5/9 low is unfolding as a double three Elliott Wave structure. Up from 5/9 (0.7325) low, Minute wave ((w)) ended at 0.7517 and Minute wave ((x)) ended at 0.7368. Pair has since broken above 0.7517, adding validity that the next leg higher has started. From 0.7368 low, the rally is […]
-
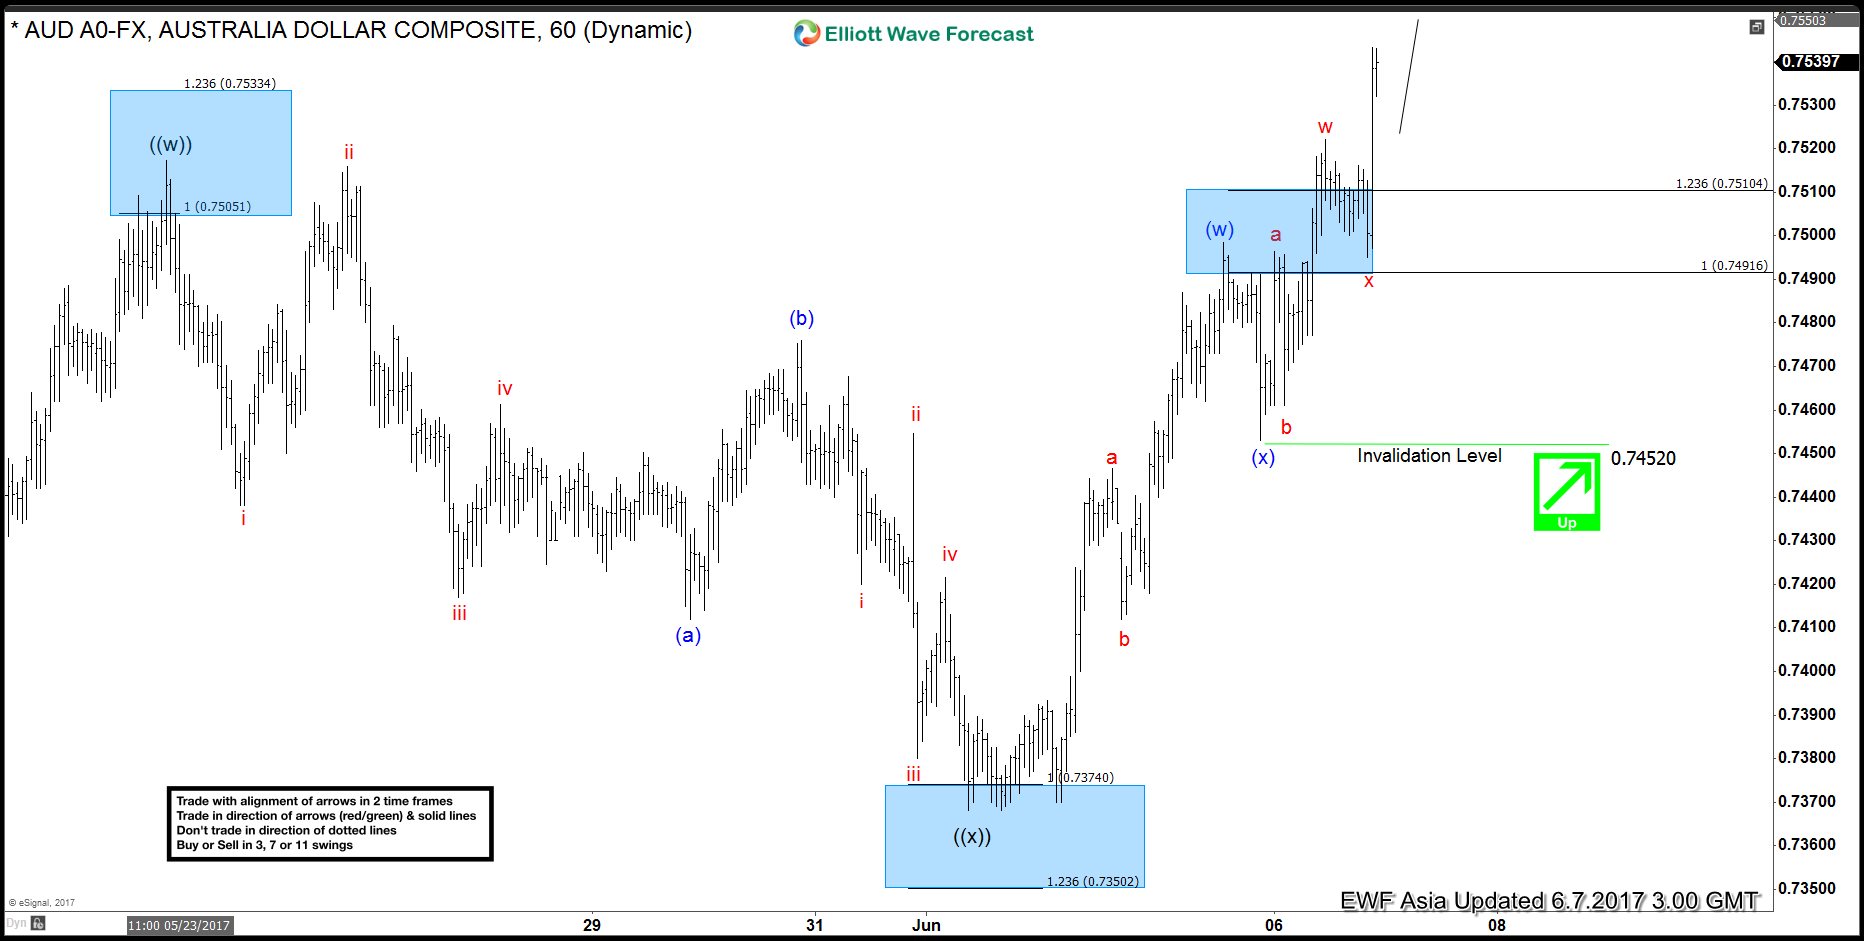
AUDUSD Elliott Wave View: More Upside
Read MoreShort Term Elliott Wave view in AUDUSD suggests the rally from 5/9 low is unfolding as a double three Elliott Wave structure. Up from 5/9 (0.7325) low, Minute wave ((w)) ended at 0.7517 and Minute wave ((x)) ended at 0.7368. Pair has since broken above 0.7517, adding validity that the next leg higher has started. From 0.7368 low, the rally […]
-
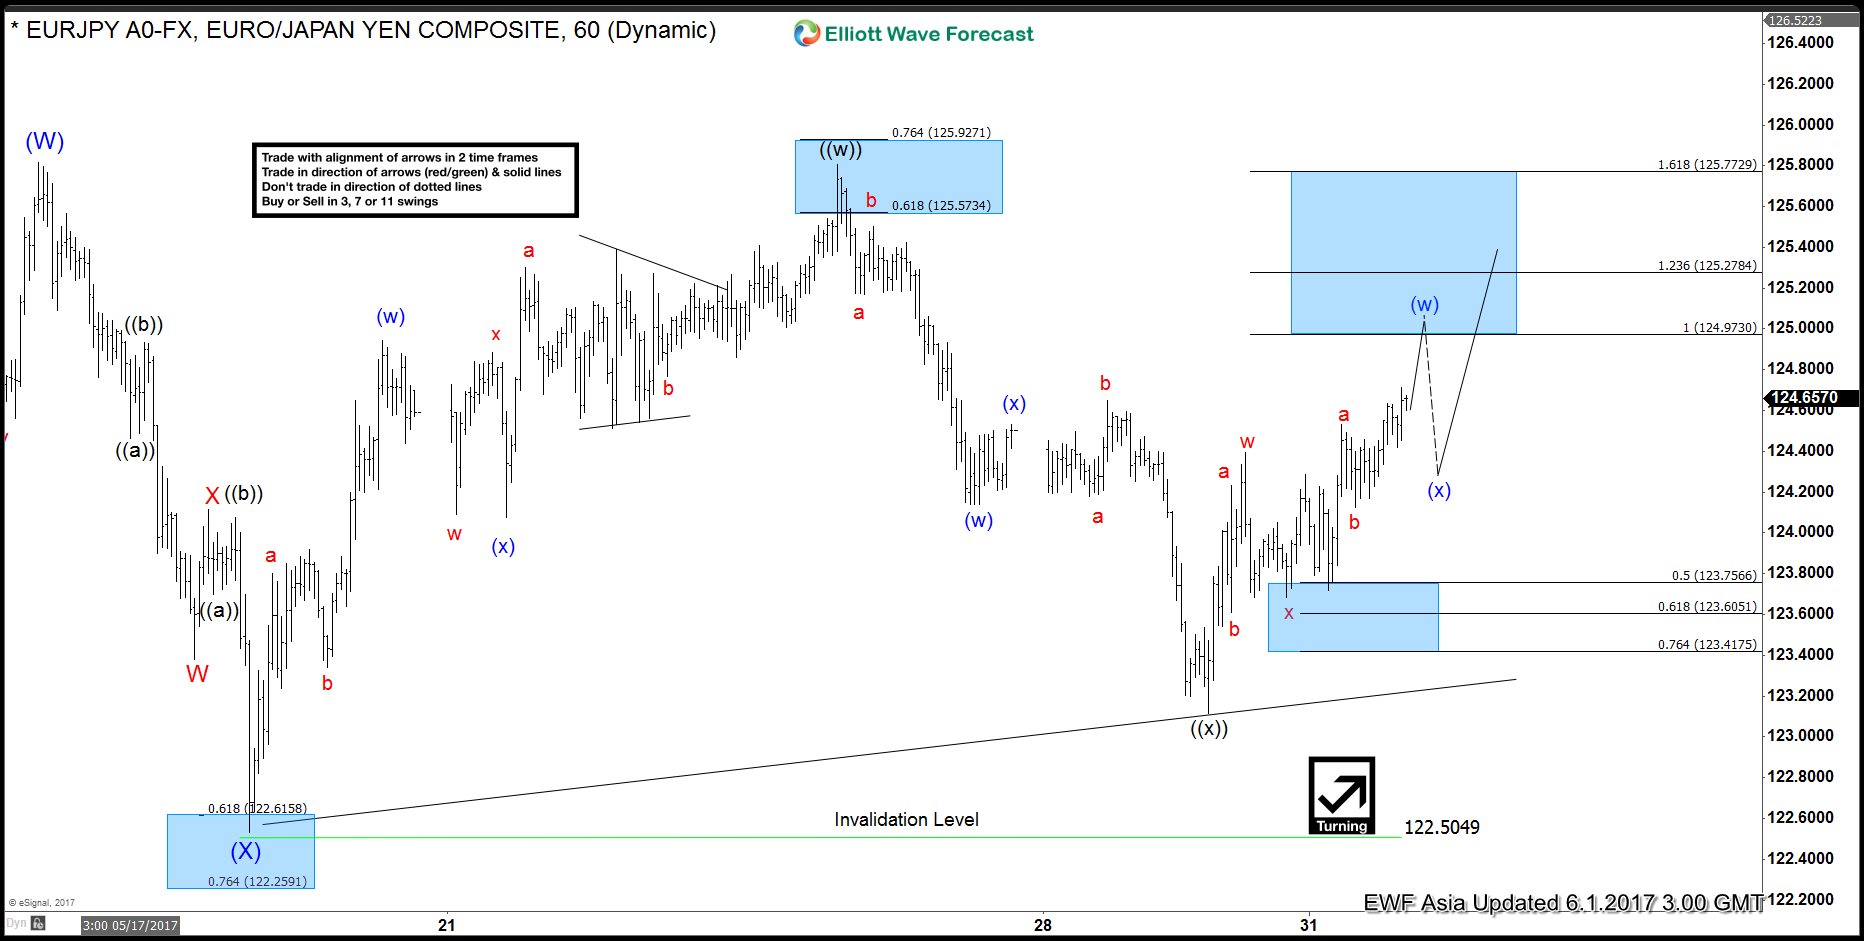
EURJPY Elliott Wave: Short term Pullback
Read MoreShort Term EURJPY Elliott Wave view suggests the rally from 4/16 low is unfolding as a double three Elliott Wave structure. Up from 4/16 (114.8) low, Intermediate wave (W) ended at 125.81 and Intermediate wave (X) ended at 122.53. A break above 125.81 however is still needed to add conviction that the next leg higher has started. […]
-
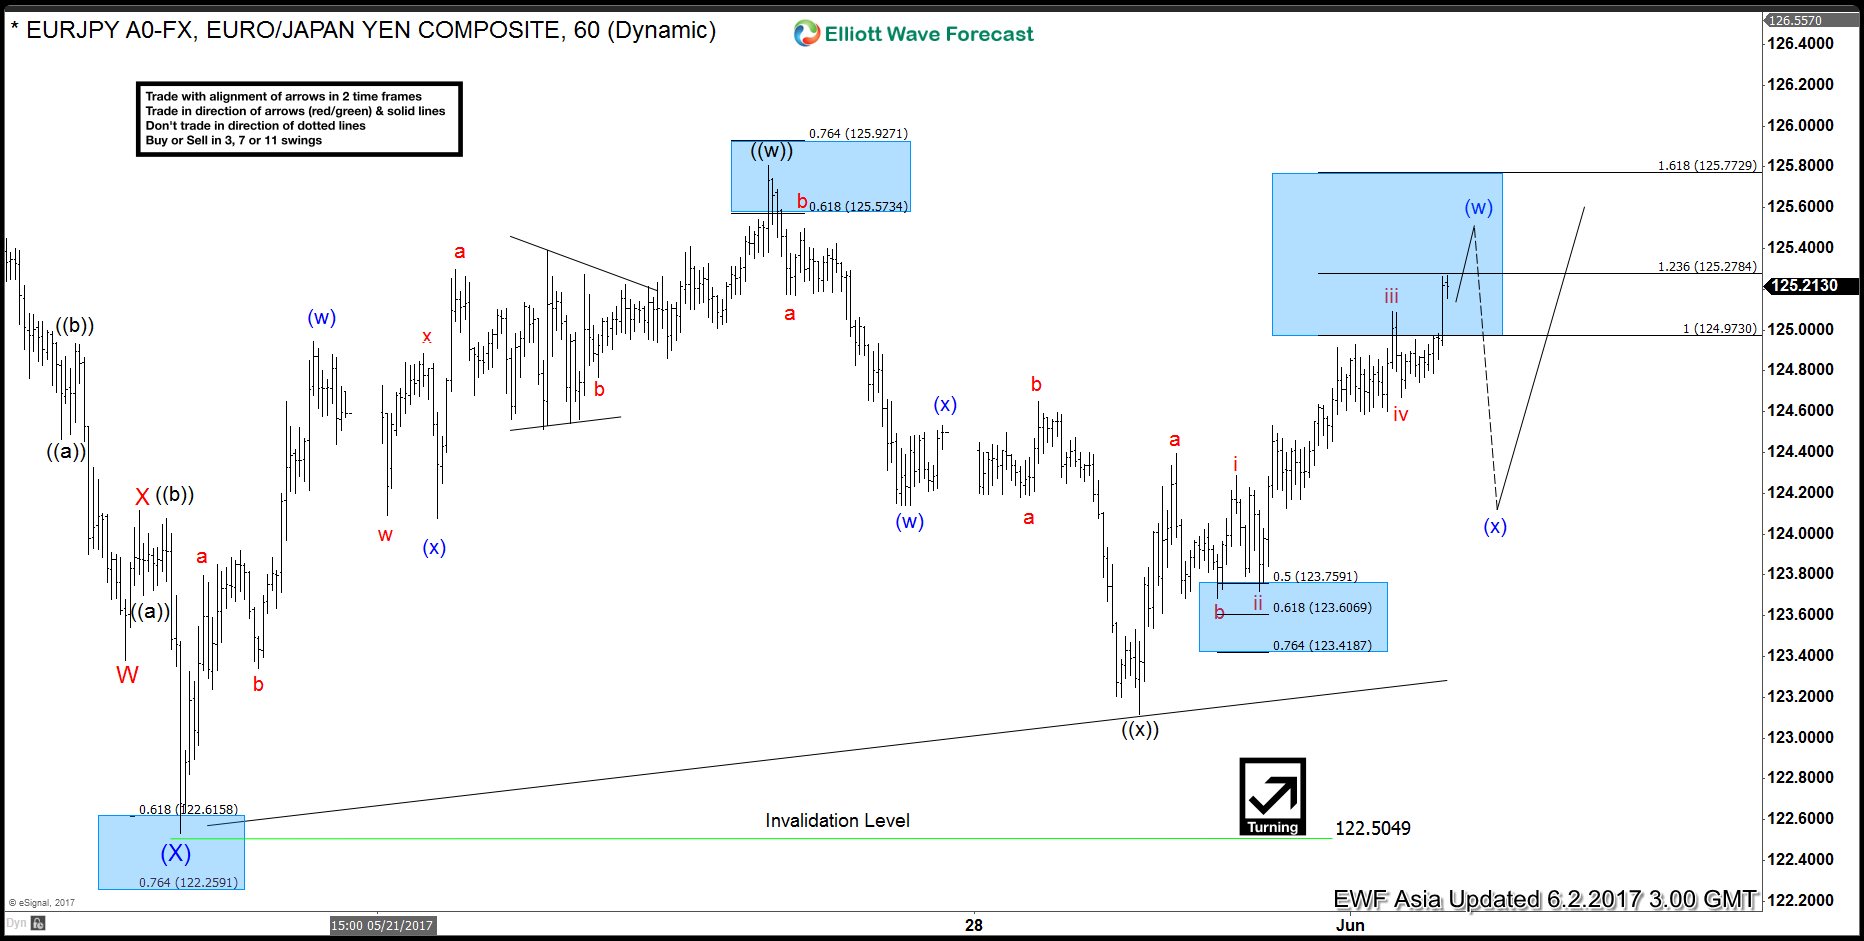
EURJPY Elliott Wave: Bullish against May 30th low
Read MoreShort Term EURJPY Elliott Wave view suggests the rally from 4/16 low is unfolding as a double three Elliott Wave structure. Up from 4/16 (114.8) low, Intermediate wave (W) ended at 125.81 and Intermediate wave (X) ended at 122.53. A break above 125.81 however is still needed to add conviction that the next leg higher has started. […]