
-
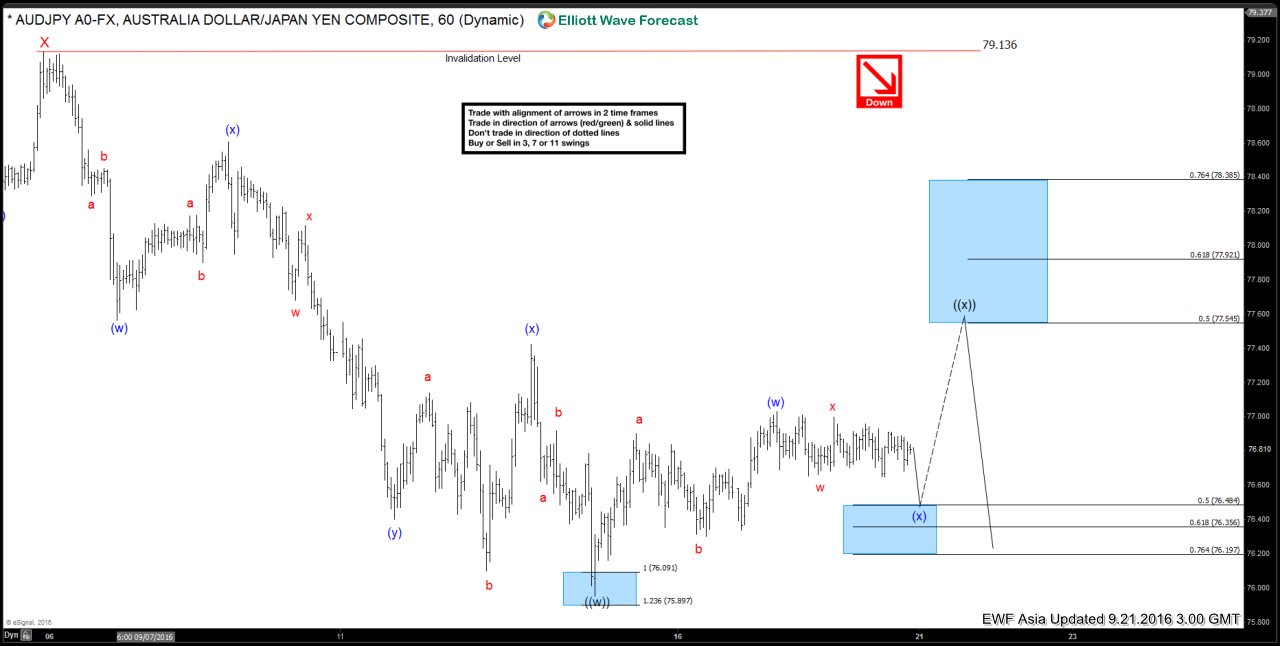

$AUDJPY Short-term Elliott Wave Analysis 9.21.2016
Read MoreShort term Elliott wave count suggests that rally to 79.12 ended wave X. Decline from there is unfolding as a double three where wave ((w)) ended at 75.95 and wave ((x)) bounce is currently in progress to correct the cycle from 9/6 (79.13) peak towards 77.6 – 78 area before the decline resumes. As far as pivot at 79.13 […]
-
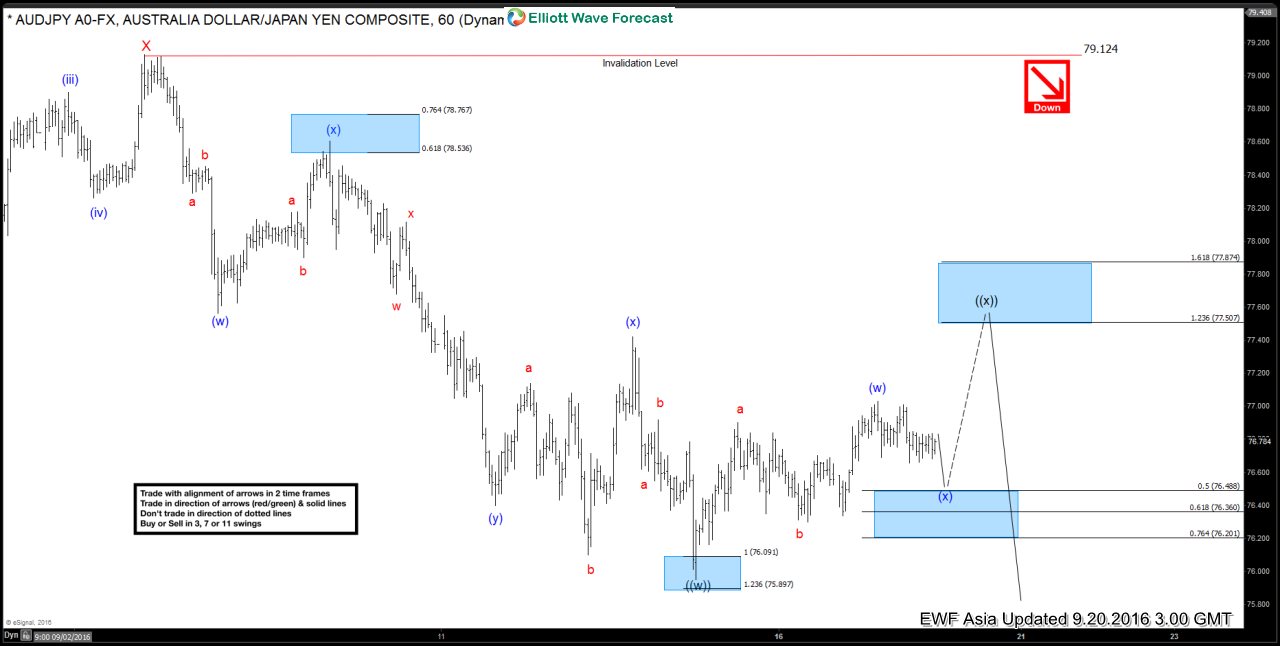
$AUDJPY Short-term Elliott Wave Analysis 9.20.2016
Read MoreShort term Elliott wave count suggests that rally to 79.12 ended wave X. Decline from there is unfolding as a double three where wave ((w)) ended at 75.95 and wave ((x)) bounce is currently in progress to correct the cycle from 9/6 (79.12) peak with potential target of 77.5 – 77.87 area before the decline resumes. As far as […]
-
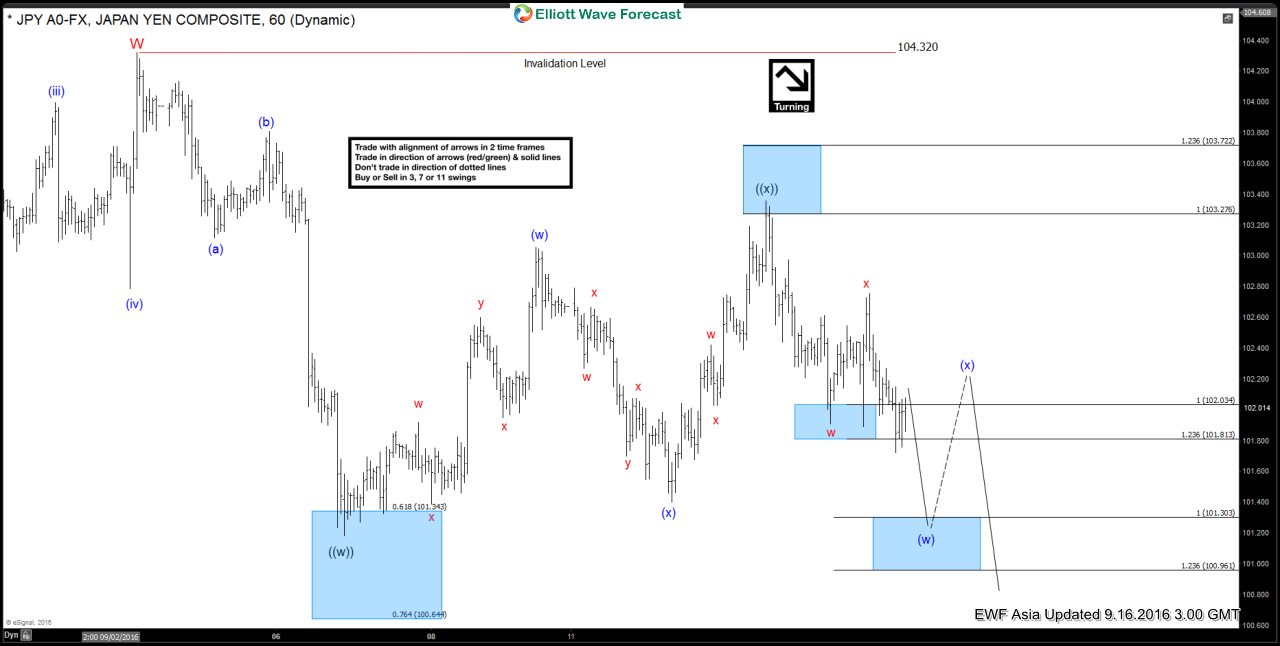
$USDJPY Short-term Elliott Wave Analysis 9.16.2016
Read MoreShort term Elliott wave count suggests that rally to 104.33 ended wave W. Decline from there is unfolding as a double three where wave ((w)) ended at 101.18 and wave ((x)) ended at 103.35. Short term, while bounces stay below 103.35, and more importantly below 104.33, expect more downside towards 100.94 – 101.4 area initially, followed by 99.47 […]
-
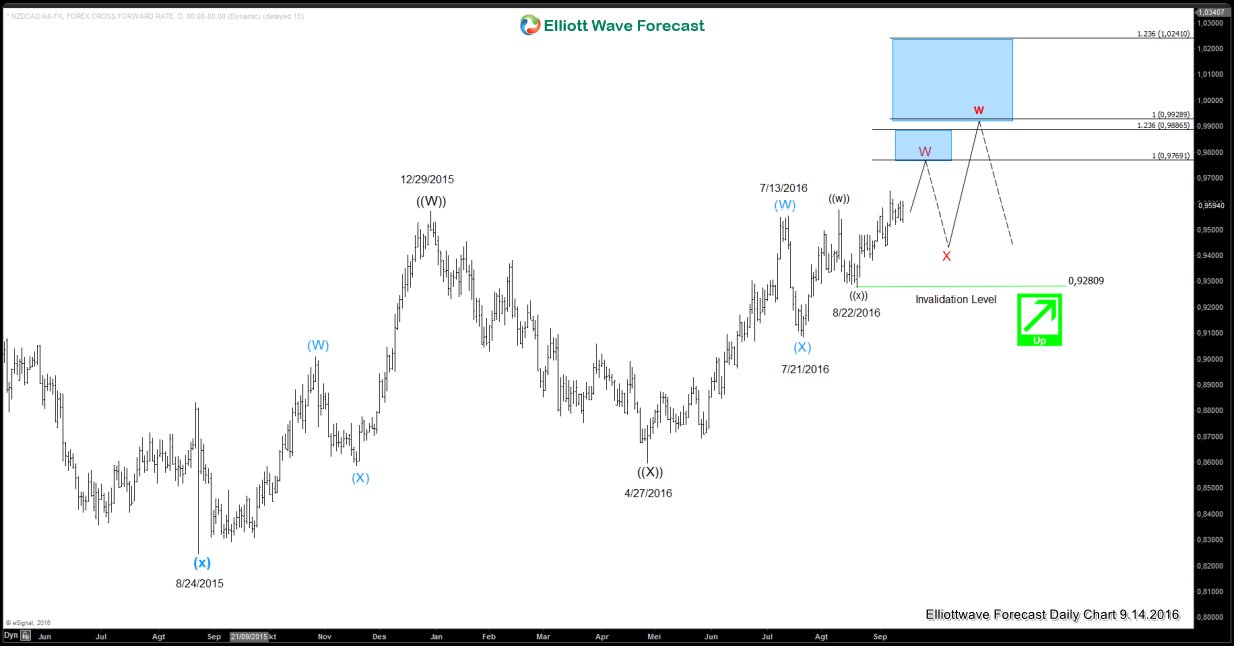
$NZDCAD may extend higher
Read More$NZDCAD Daily chart is showing that the instrument has broken above ((W)) peak on 12/29/2015 at 0.9573, suggesting that further upside is favored. From 8/24/2015 low, the instrument is showing a 7 swing sequence but the 7th swing has not reached the target at 1.005 – 1.0276 area. Furthermore, rally from 8/19/2016 low is showing what looks to be a […]
-
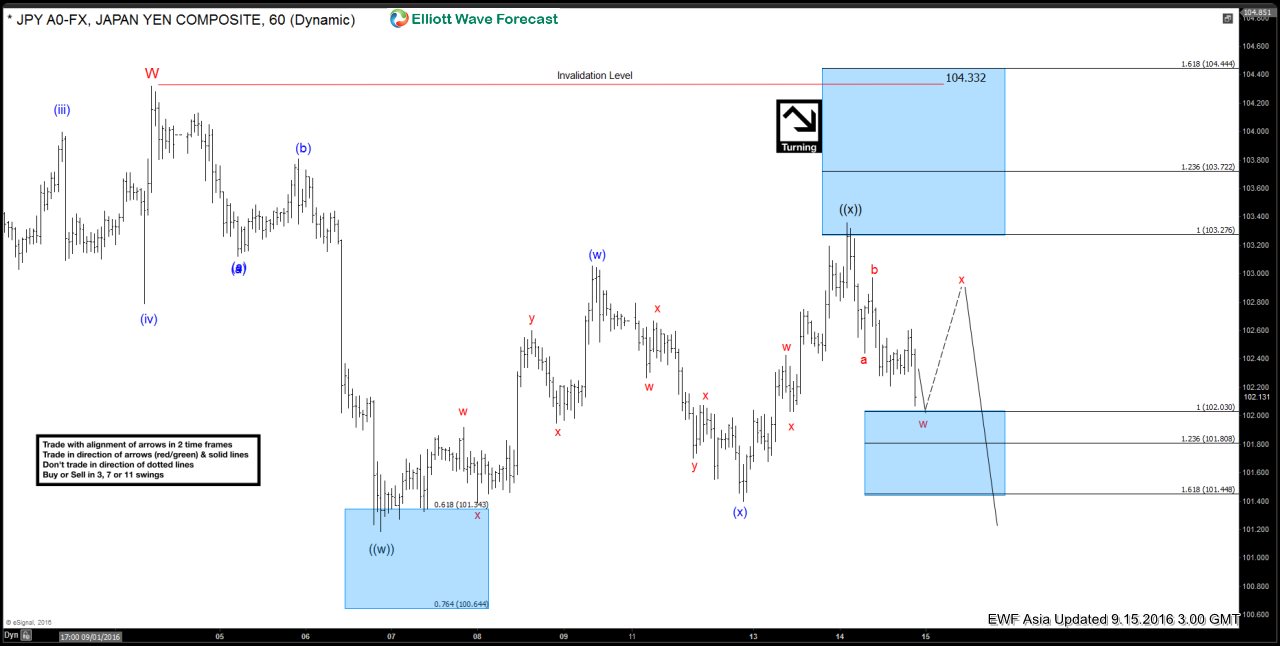
$USDJPY Short-term Elliott Wave Analysis 9.15.2016
Read MoreShort term Elliott wave count suggests that rally to 104.33 ended wave W. Decline from there is unfolding as a double three where wave ((w)) ended at 101.18 and wave ((x)) ended at 103.35. Short term, while bounces stay below 103.35, and more importantly below 104.33, expect more downside towards 100.94 – 101.4 area initially, followed by 99.47 […]
-
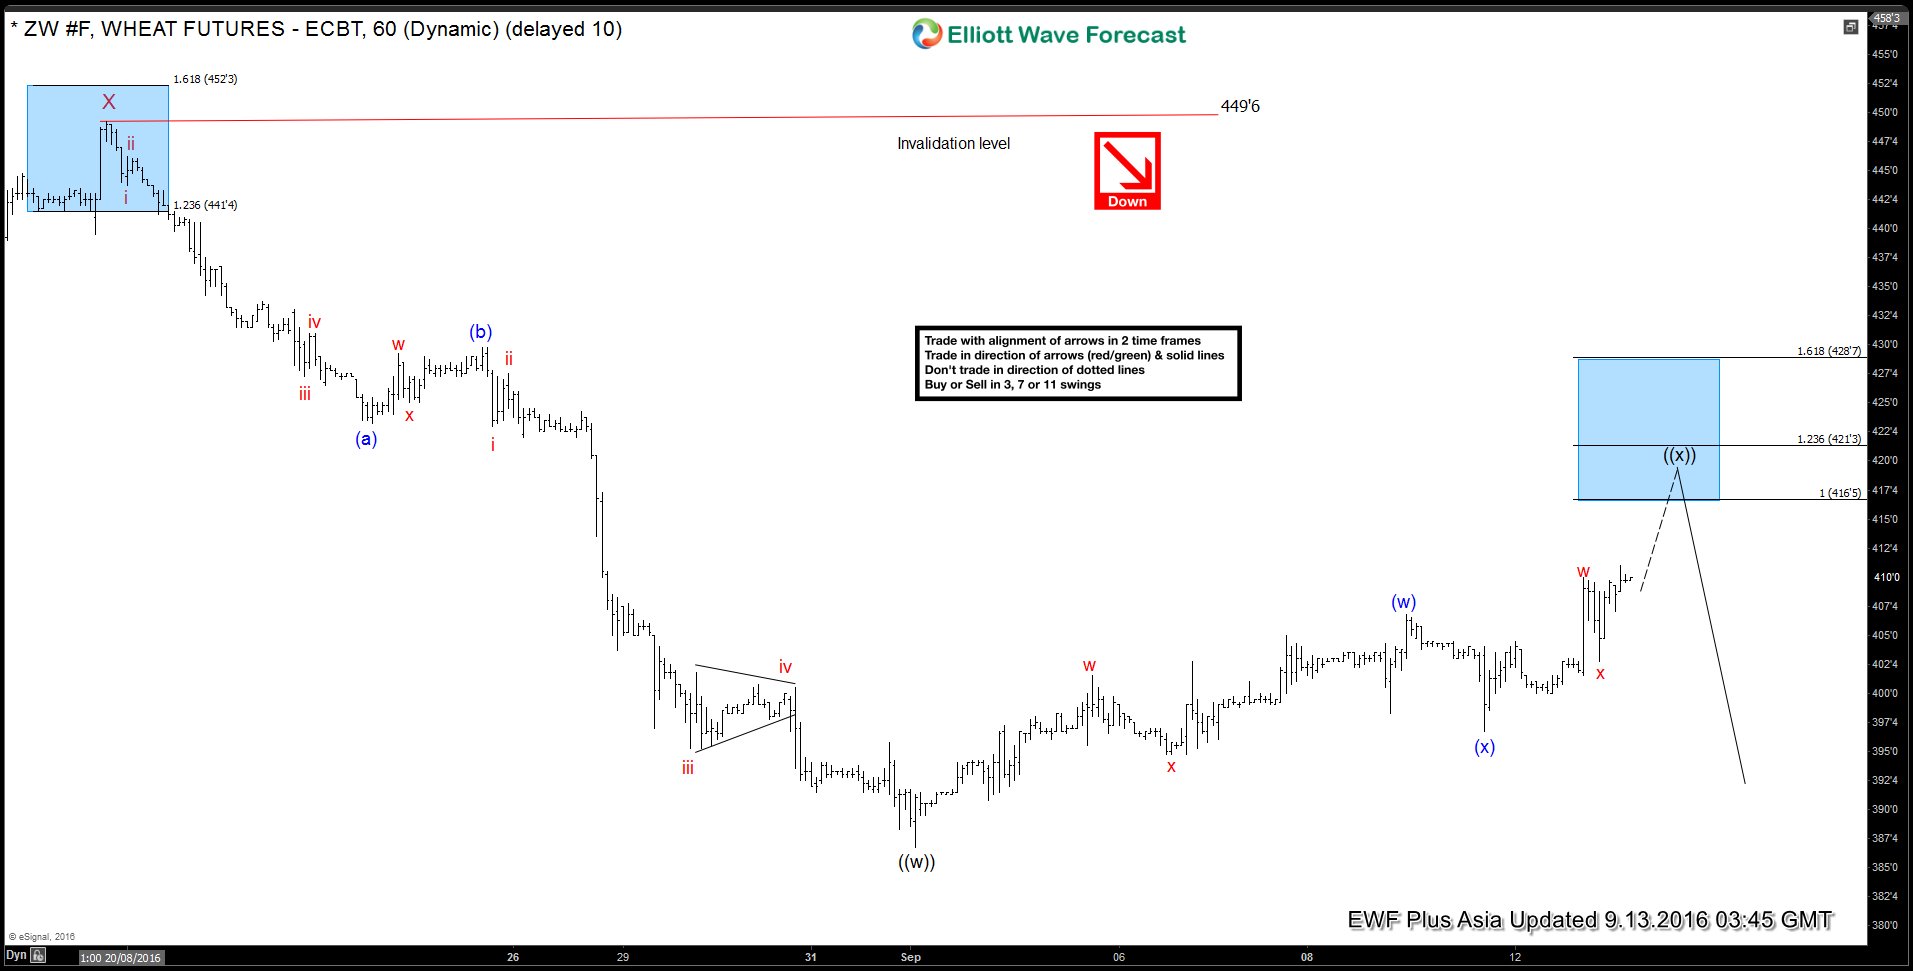
Wheat $ZW_F Short-term Elliott Wave Analysis 9.13.2016
Read MoreShort term Elliott wave count suggests that decline to 386.6 ended wave ((w)). Rally from there is unfolding as a double three where wave (w) ended at 406.6 and wave (x) pullback ended at 396.6. Short term, while pullbacks stay above 402.6, and more importantly above 396.6, expect more upside towards 416.5 – 421.3 area to complete wave ((x)) […]