
-
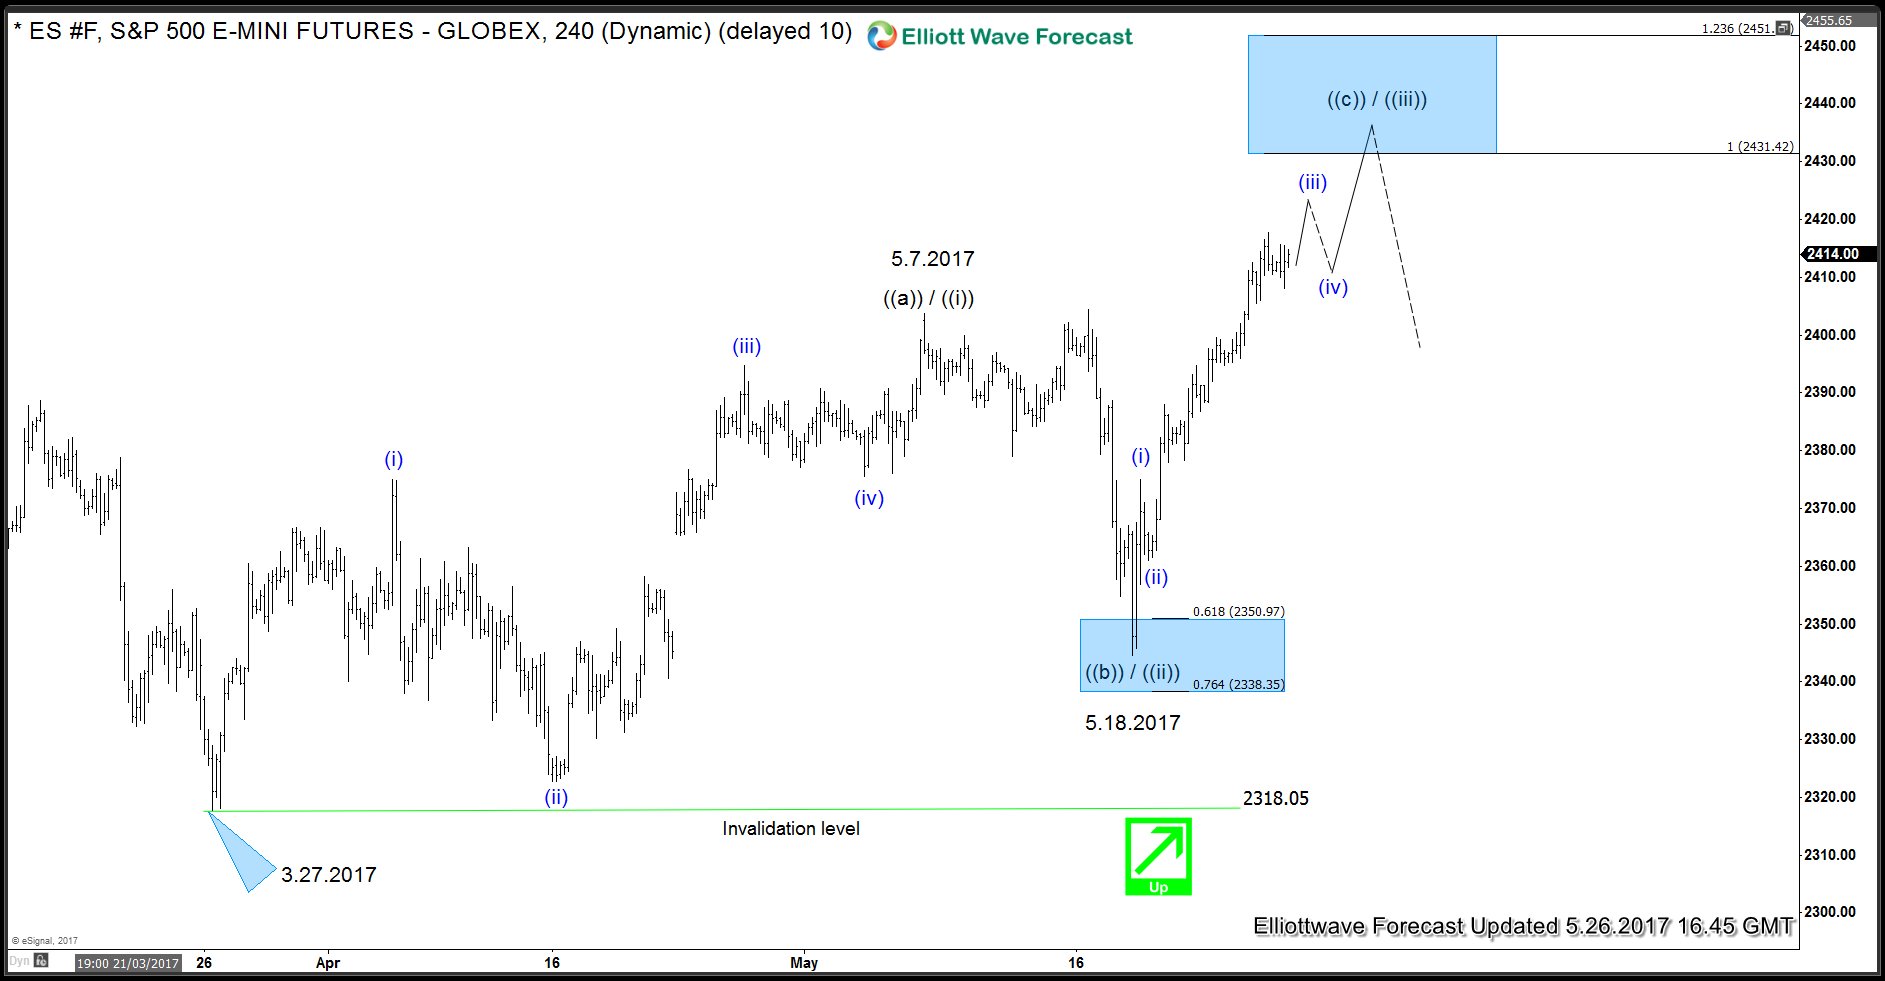
$ES_F Elliott Wave View: 2431- 2451 in focus
Read MoreShort Term Elliott Wave view in $ES_F E-Mini S&P suggests that the rally from 5.18.2017 (2344.5) low is unfolding as a 5 waves Elliott Wave impulse structure where Minutte wave (i) ended at 2375, Minutte wave (ii) ended at 2361, and Minutte wave (iii) remains in progress and can reach 2423.13 or 161.8% fibonacci extension […]
-
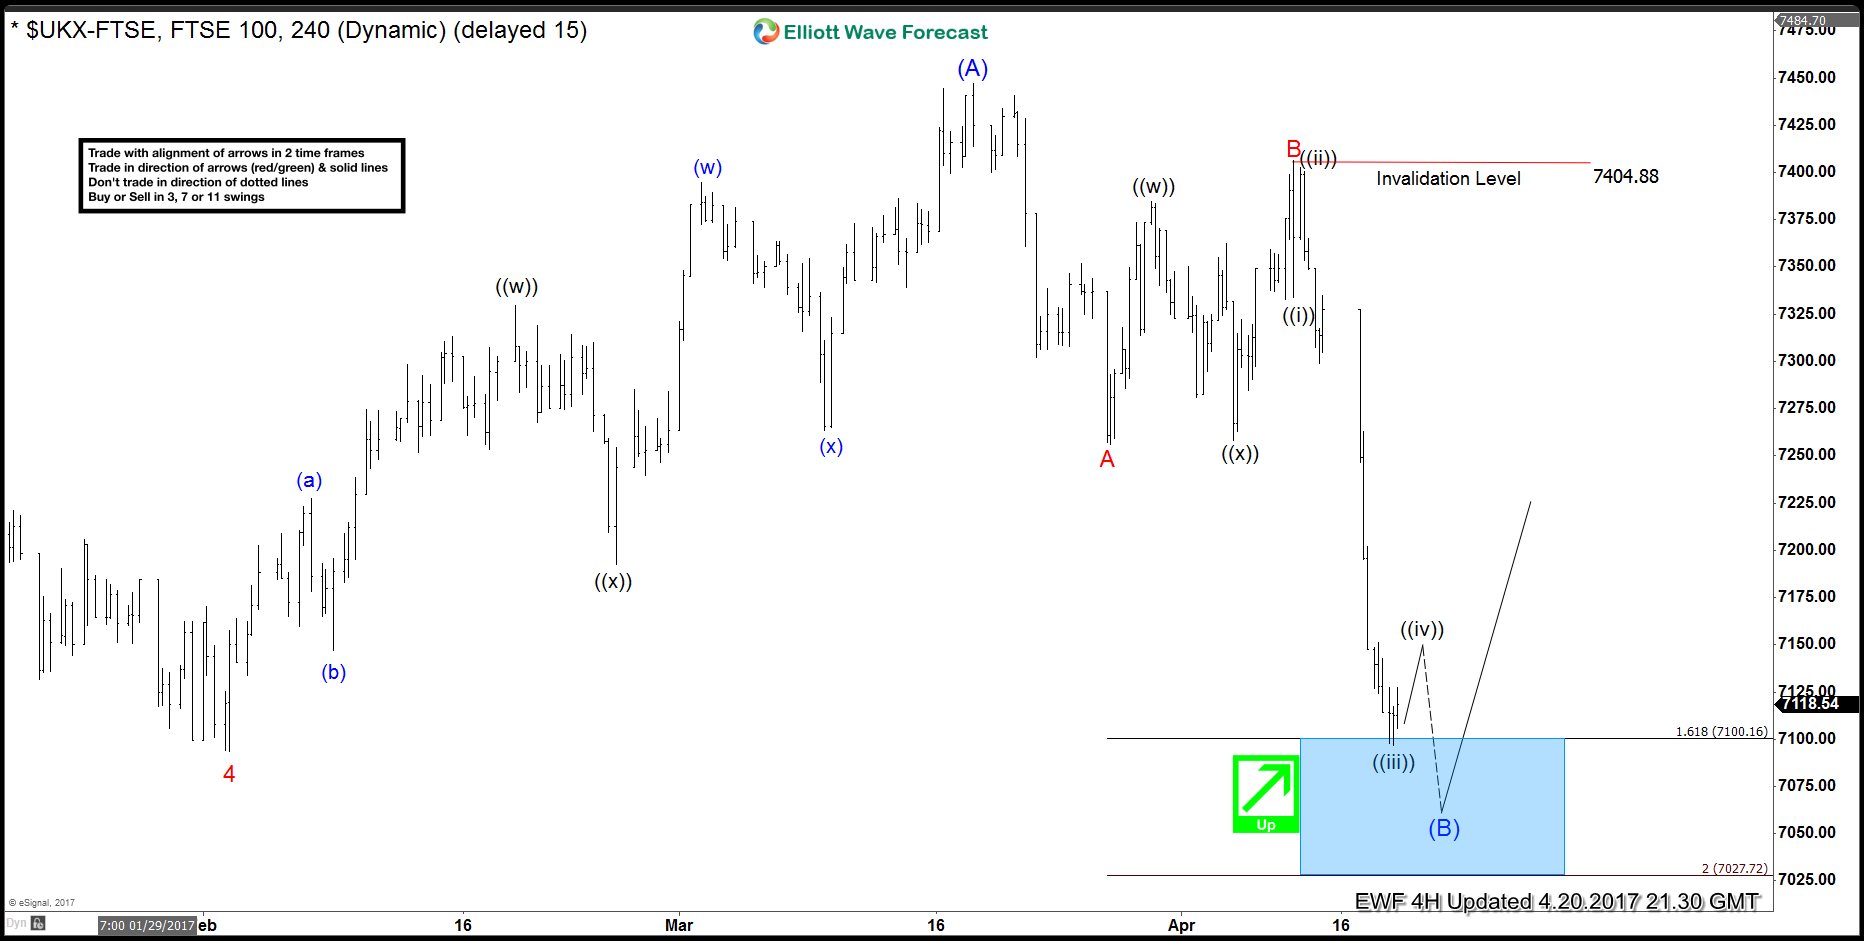
FTSE rallied after completing Elliott wave FLAT
Read MoreIn this technical blog, we are going to take a look at the performance of past Elliott wave FTSE charts from April 2017, which we presented to the clients at elliottwave-forecast.com. Now lets take a look at the 4 hr chart from April 20,2017, which is showing the intermediate cycle in wave (A) in blue […]
-

How Bullish is the SPX, Can it see 3189 area?
Read MoreThis is Elliott Wave analysis video on SPX and DJUSRE (Dow Jones Real Estate Index) in which we are going to take a look if SPX can reach the 3189 area to the upside before ending the all time cycle. In order to answer it, we will look for a clue in the market by analyzing […]
-
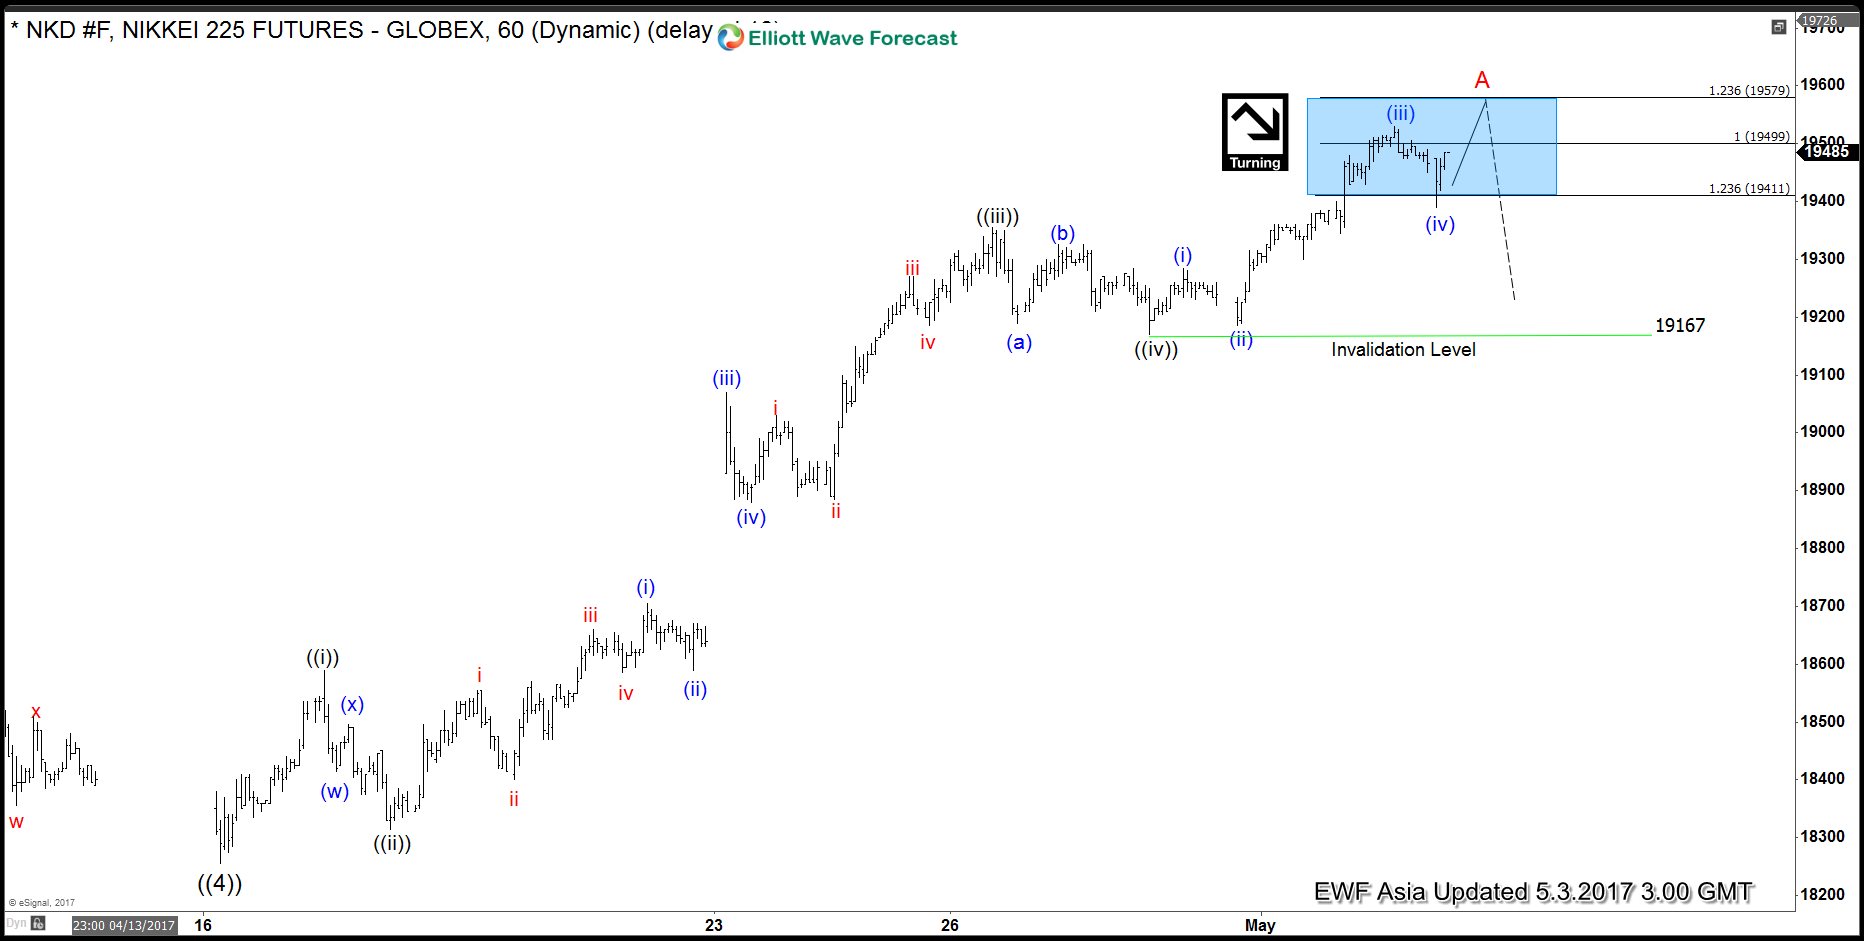
Nikkei Elliott Wave View: Ending impulsive 5 waves
Read MoreShort term Elliott Wave view in Nikkei ( NKD_F) suggests that the decline to 4/16 low (18255) ended primary wave ((4)). Up from there, the rally is unfolding as an impulse Elliott wave structure where Minute wave ((i)) ended at 18590, Minute wave ((ii)) ended at 18315, Minute wave ((iii)) ended at 19355, and Minute wave ((iv)) […]
-
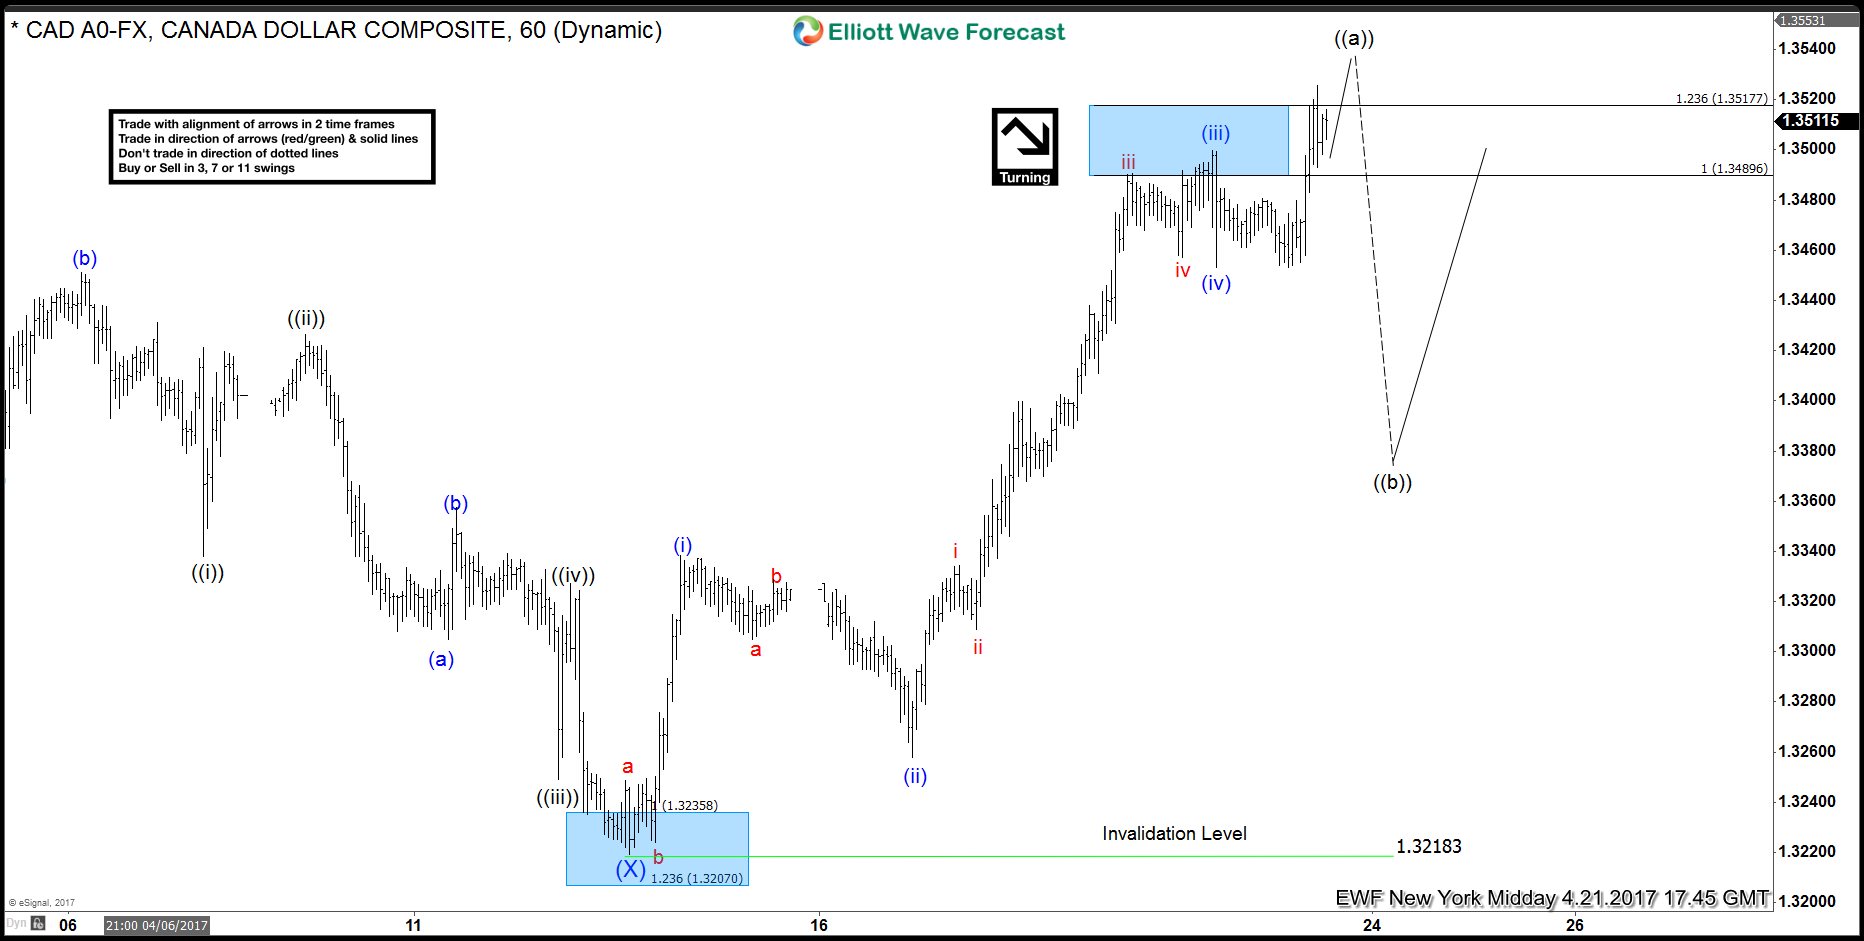
USDCAD Elliott Wave View: Ending 5 wave Impulse
Read MoreShort term Elliott wave view in USDCAD suggest that the cycle from 4/13 low (1.3218) is unfolding as an impulsive Elliott wave structure . This 5 wave move could be wave ((a )) of an Elliott wave zigzag structure structure or wave ((c )) of FLAT correction. In either case, after 5 wave move ends, pair should pull back […]
-
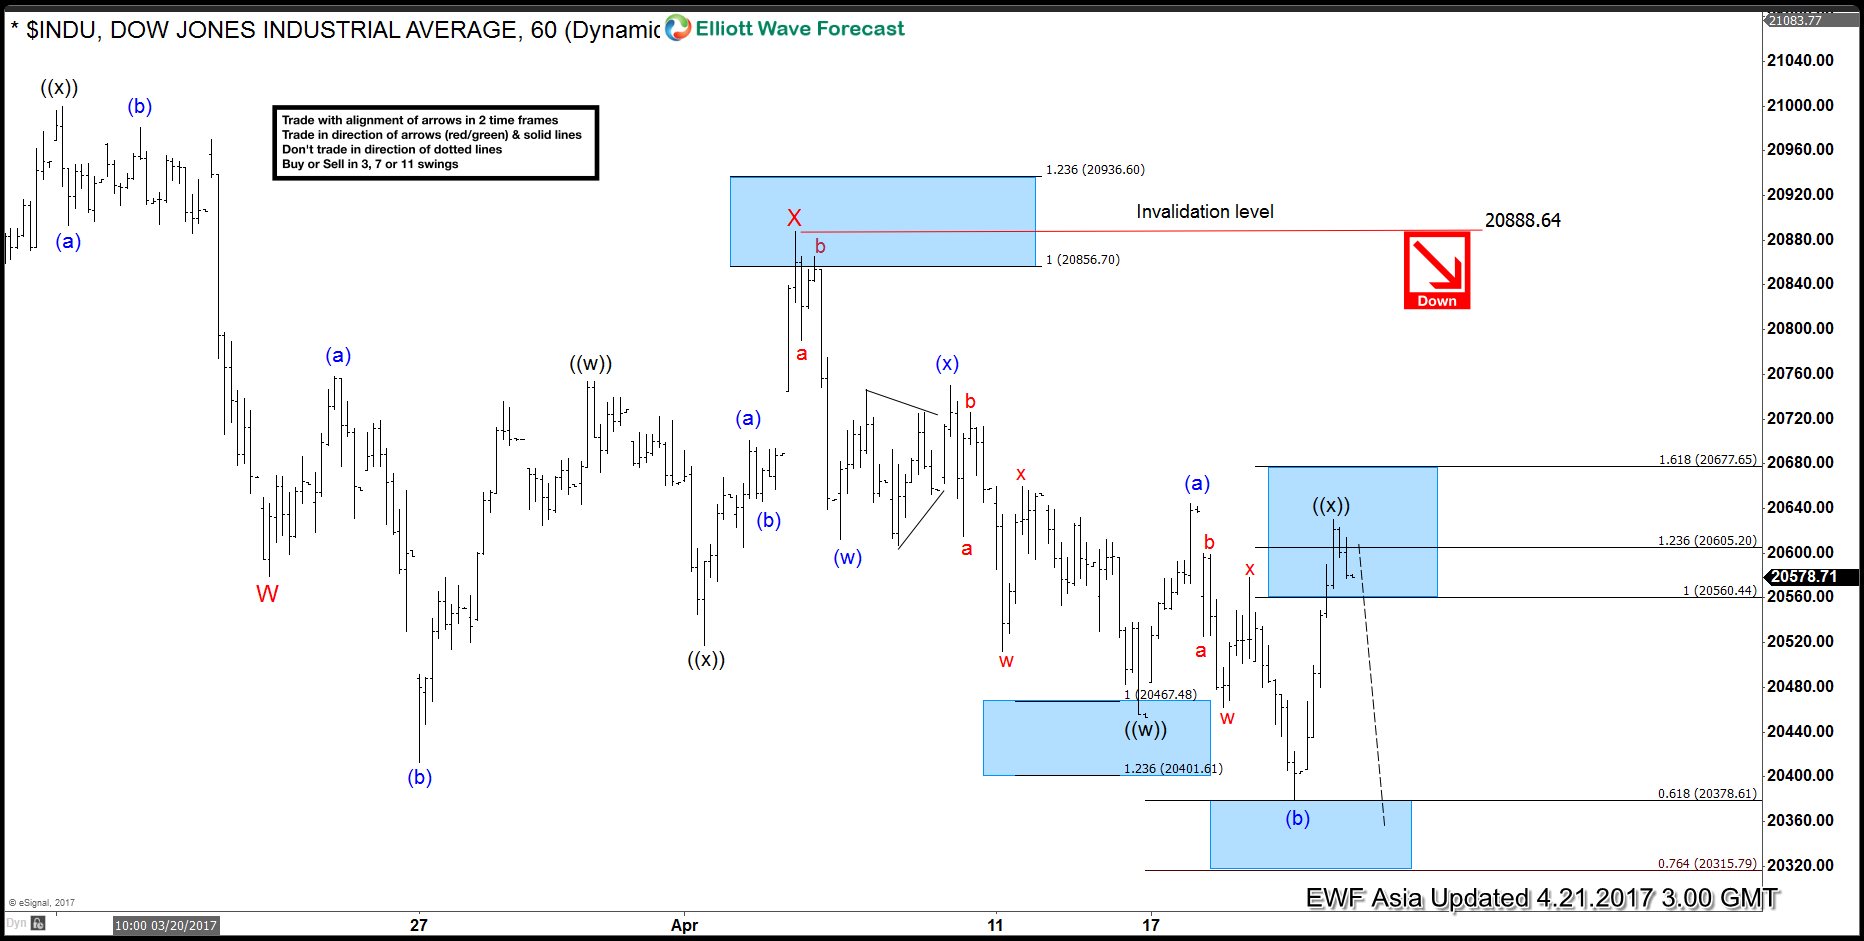
INDU Elliott Wave View: Further downside
Read MoreShort term Elliott Wave view in INDU ( Dow) suggest that instrument is showing 5 swings sequence from 3/03 peak (21018) favoring more downside. From 3/03 peak INDU is following a Double three Elliott wave Structure , where Minor wave W ended at 20579 low and Minor wave X ended at 20887 peak. Index has since […]