
-
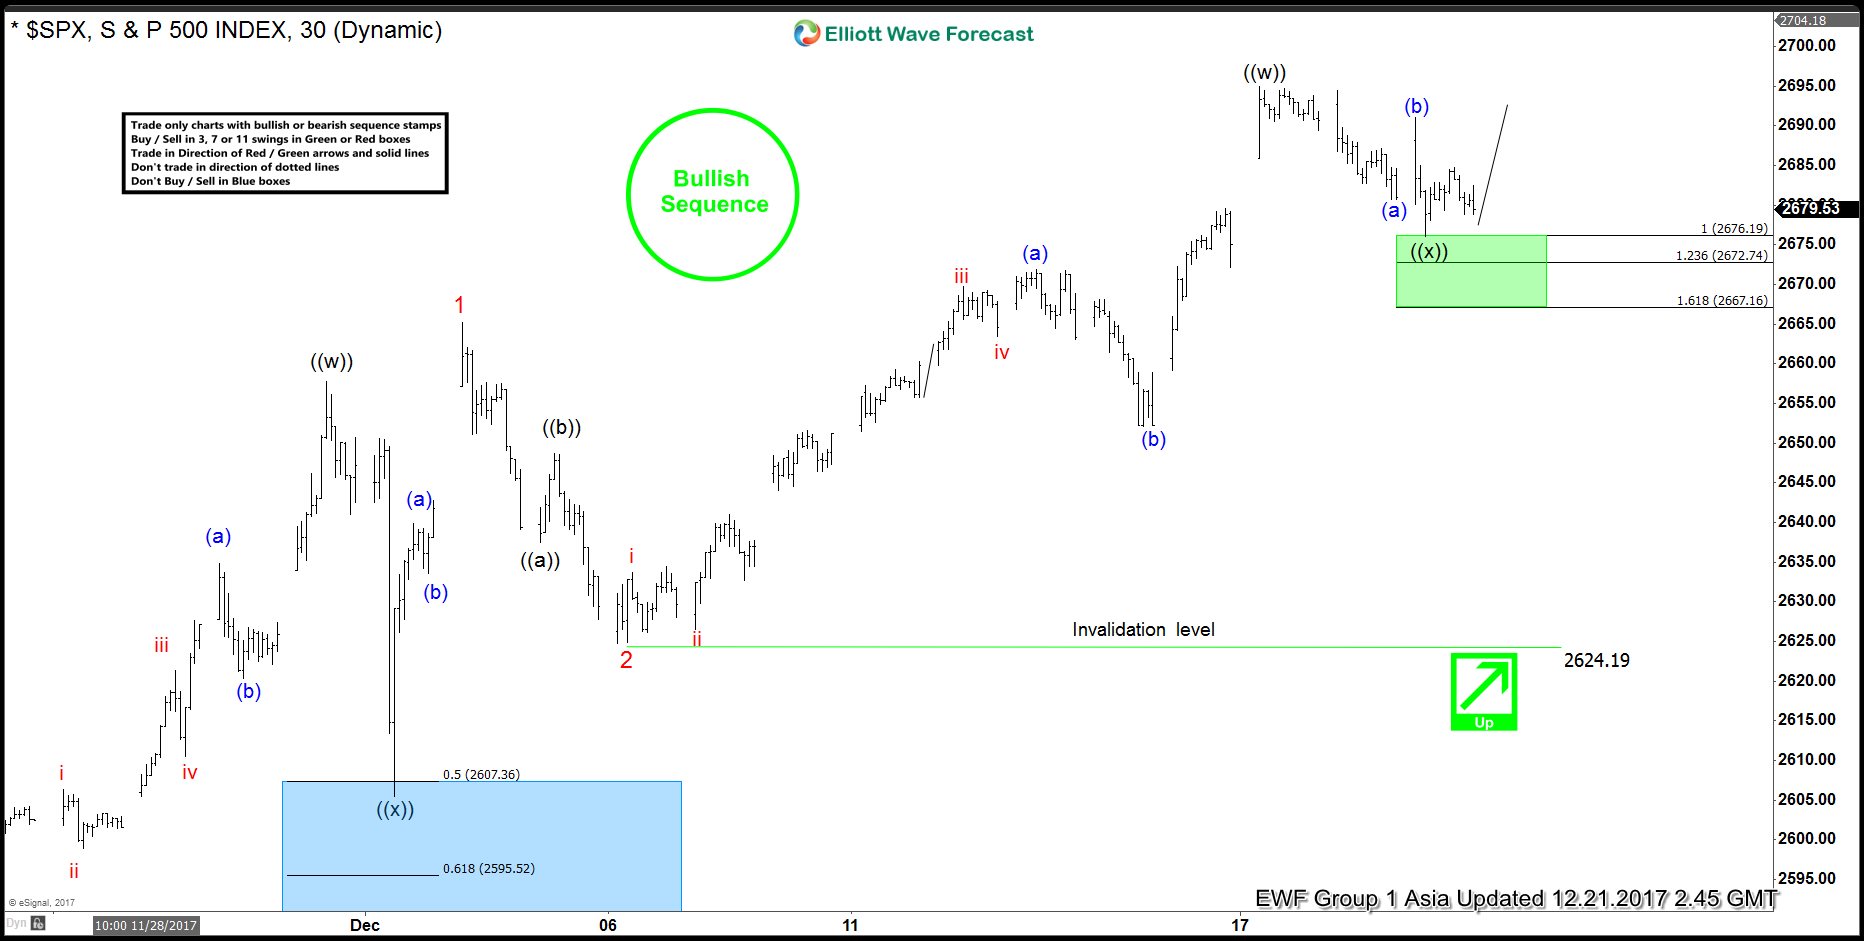
SPX Elliott Wave Analysis 12.21.2017
Read MoreSPX Short term Elliott Wave view suggests that the rally to 2664.58 ended Minor wave 1 as a Leading diagonal. Below from there Minor wave 2 ended as a zigzag correction at 2624.19 low, above from there Minor wave 3 remains in progress as a double correction and showing the incomplete bullish sequence to the upside. The Minutte wave (a) […]
-
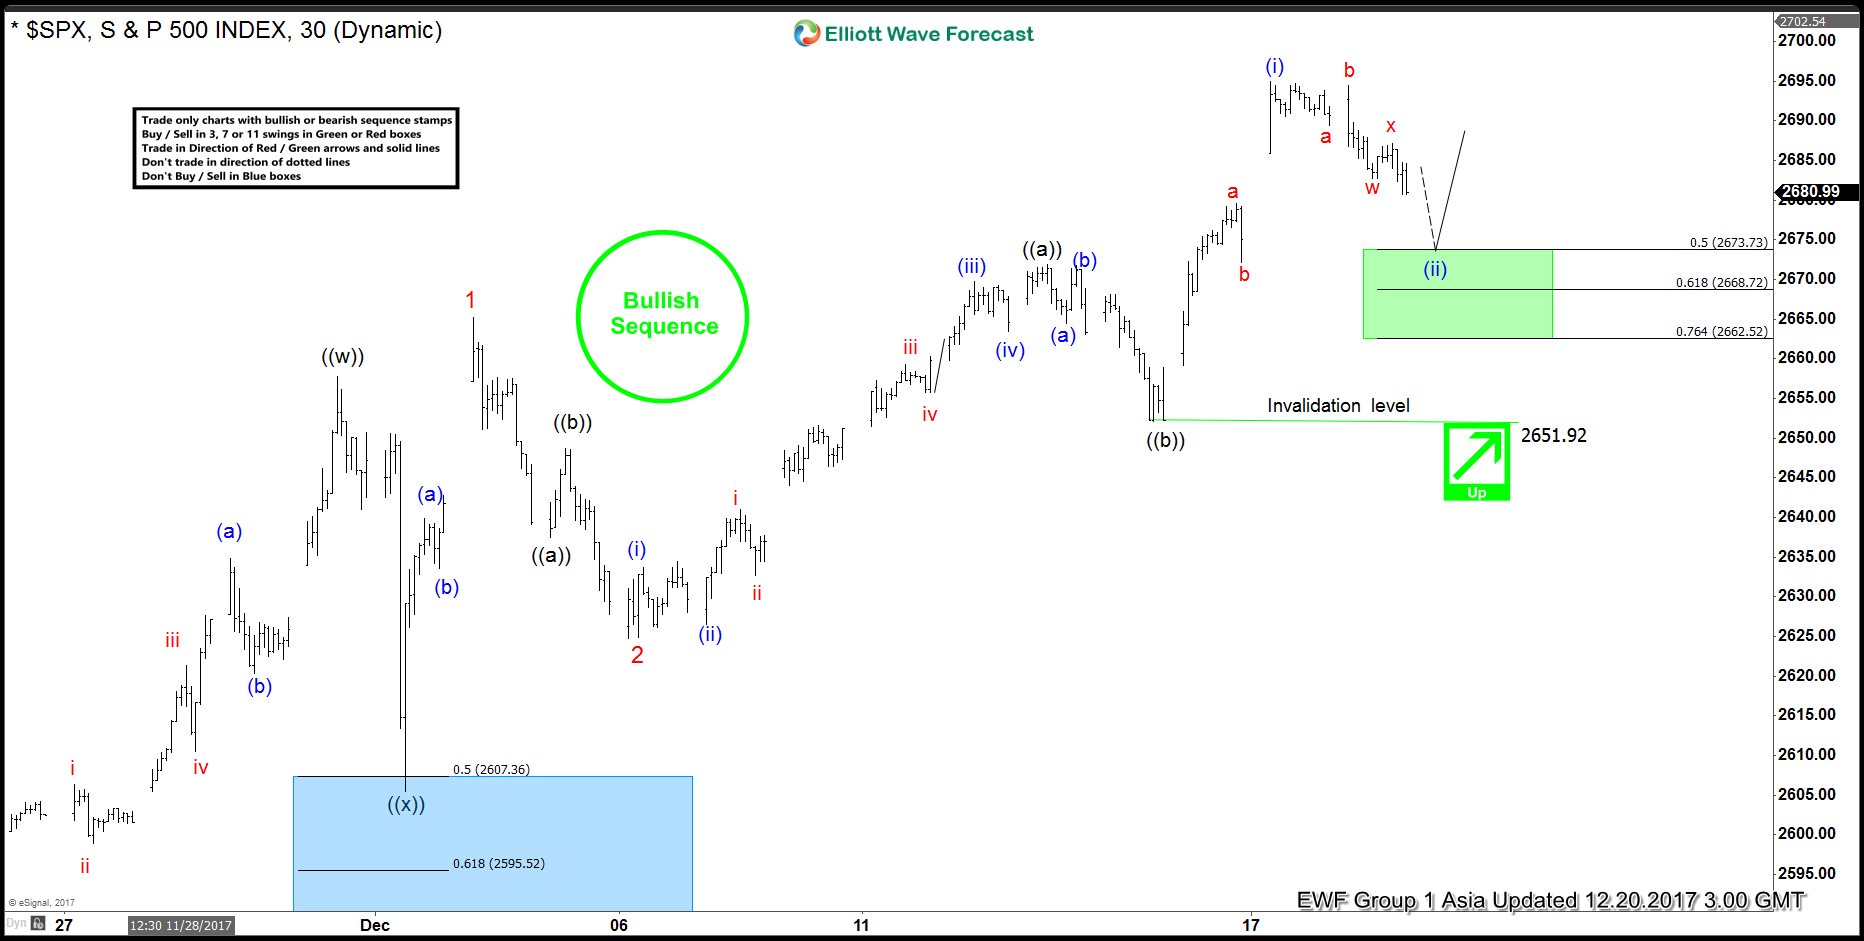
SPX Elliott Wave Analysis 12.20.2017
Read MoreSPX Short term Elliott Wave view suggests that the rally to 2664.58 ended Minor wave 1 as a Leading diagonal. Below from there Minor wave 2 ended as a zigzag correction at 2625.22 low, above from there Minor wave 3 remains in progress as a zigzag structure and showing the incomplete bullish sequence to the upside. The Minute wave […]
-
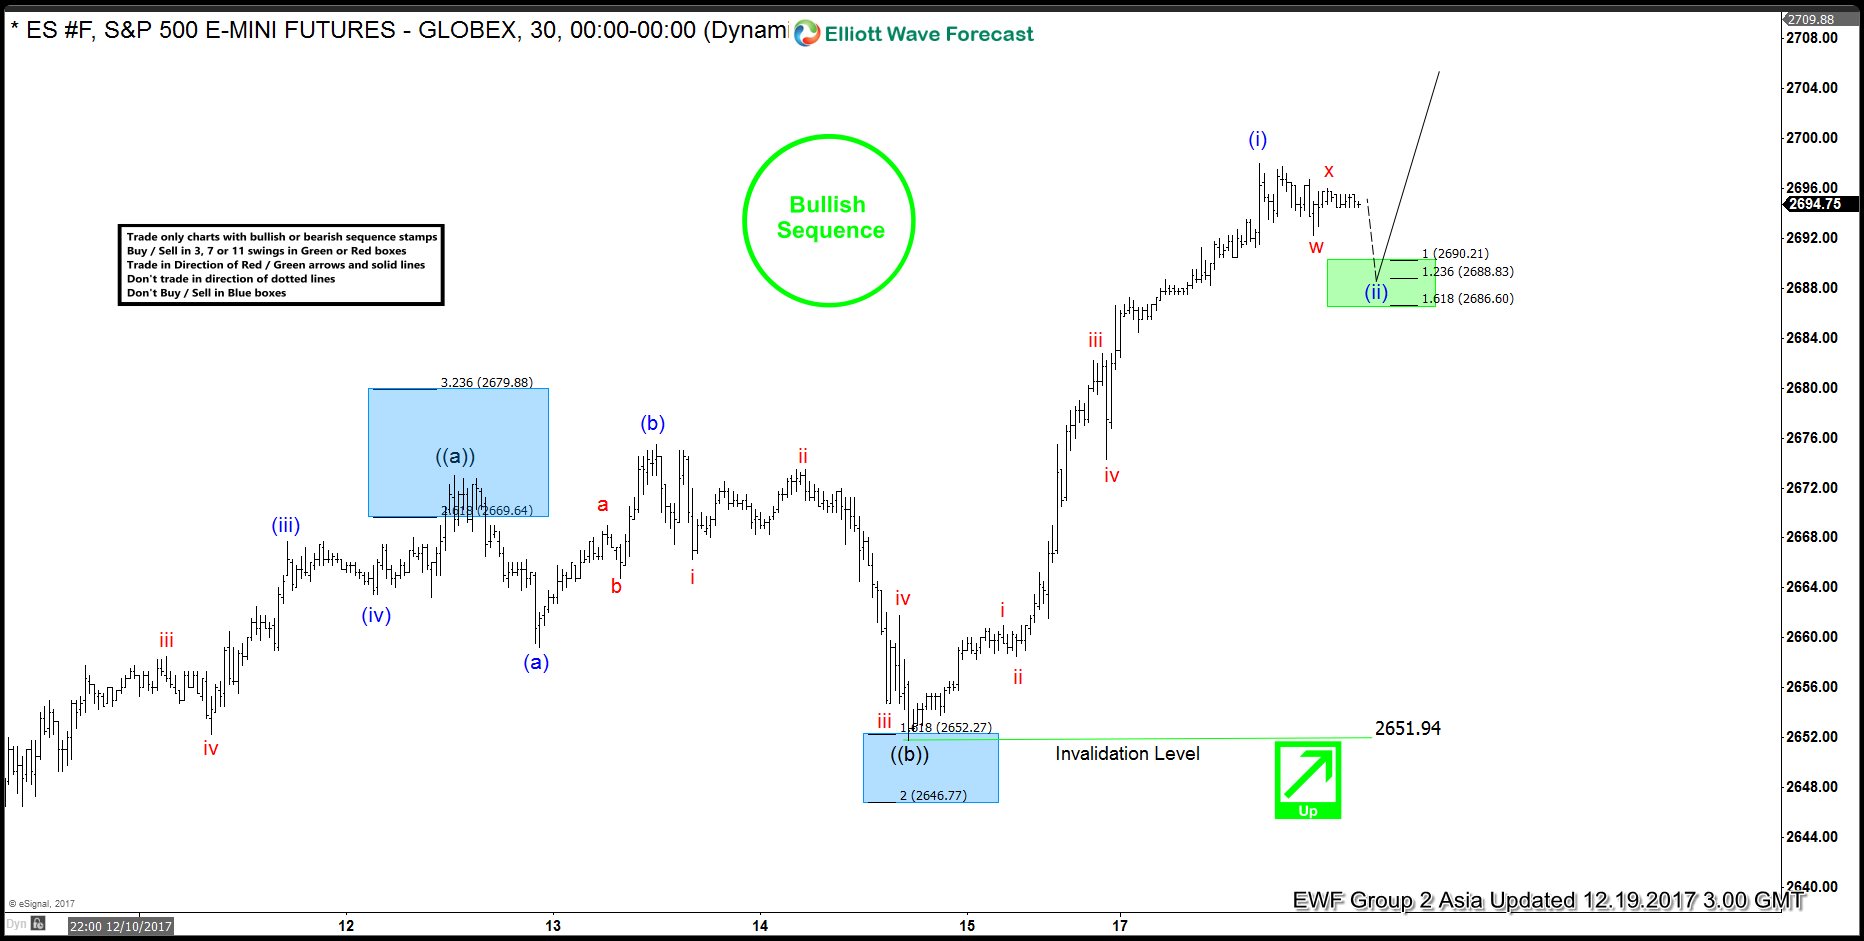
ES Elliott Wave Analysis 12.19.2017
Read MoreES Short term Elliott Wave view suggests that the rally to 2669.73 ended Minute wave ((a)) higher of a zigzag Elliott Wave structure. Then the decline to 2651.94 low ended Minute wave ((b)) pullback as expanded flat structure. Where Minutte wave (a) ended at 2656.10, Minutte wave (b) ended at 2671.81 and Minutte wave (c) of ((b)) ended at […]
-
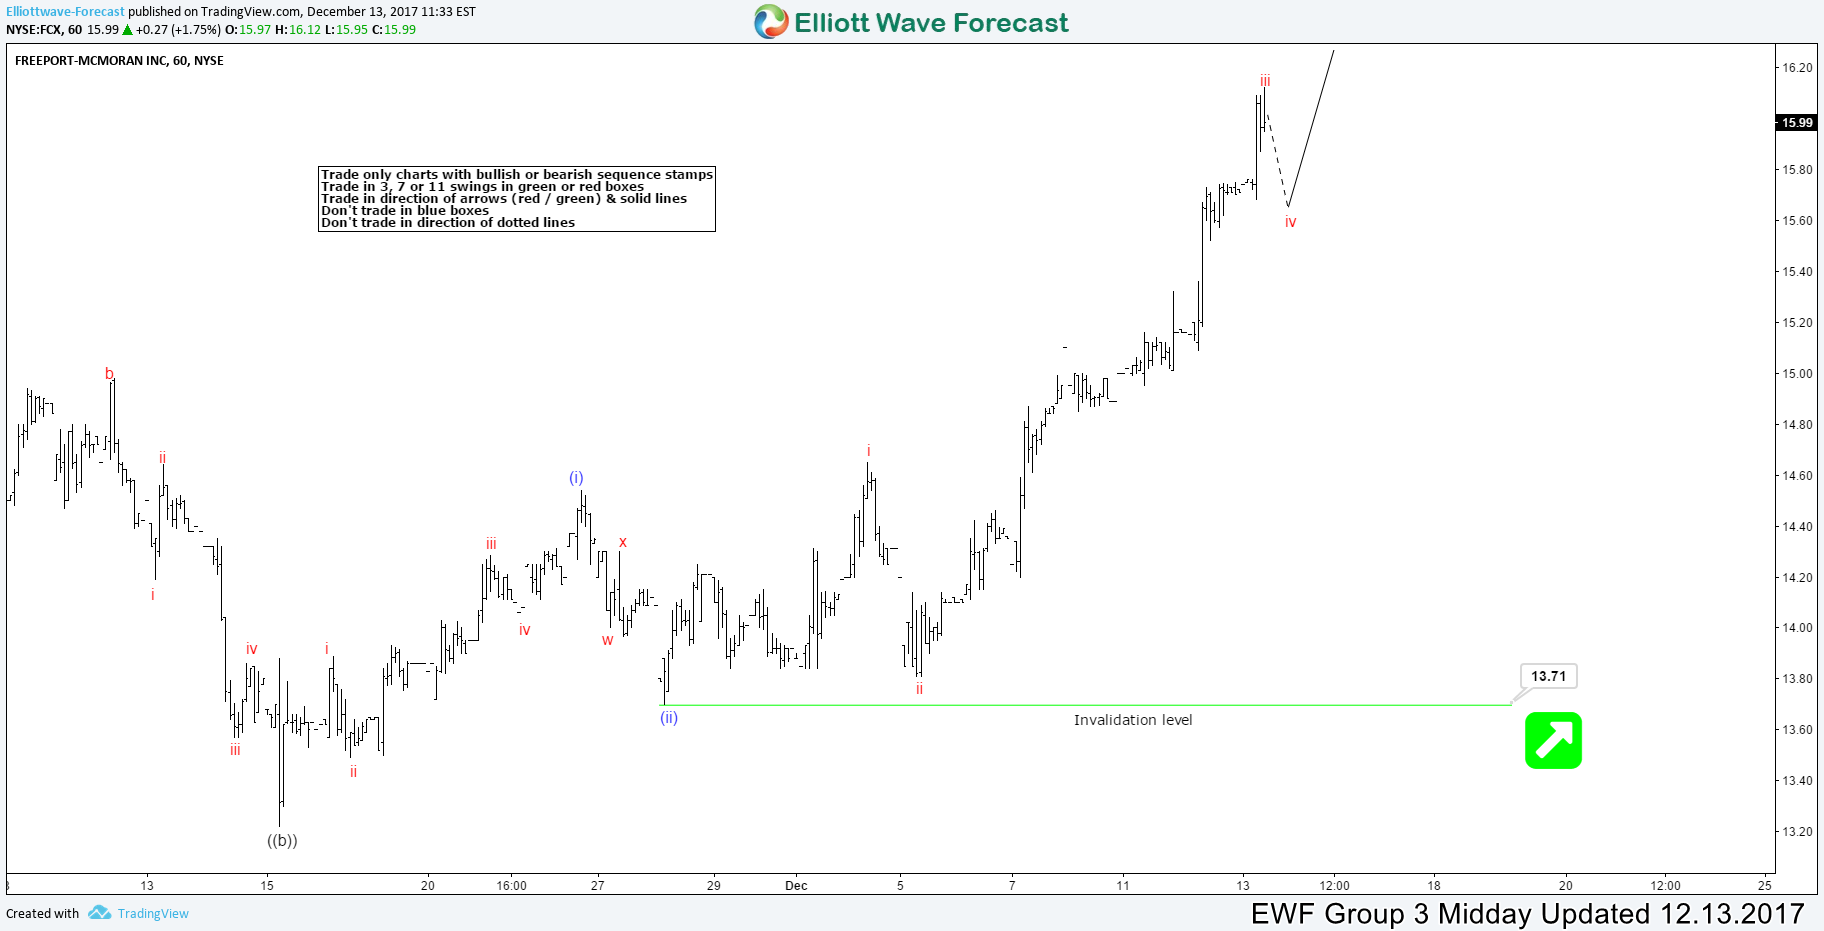
FCX Showing Elliott Wave Impulse Sequence
Read MoreFCX ( Freeport Macmoran INC) Short-term Elliott Wave view suggests that the decline to November 15 low 13.25 ended Minute wave ((b)). Above from there, the stock is showing a strong rally to the upside and structure looks to be unfolding as an impulse Elliott Wave structure due to the extension in 3rd leg higher. Also, each leg has internal oscillations of 5 […]
-
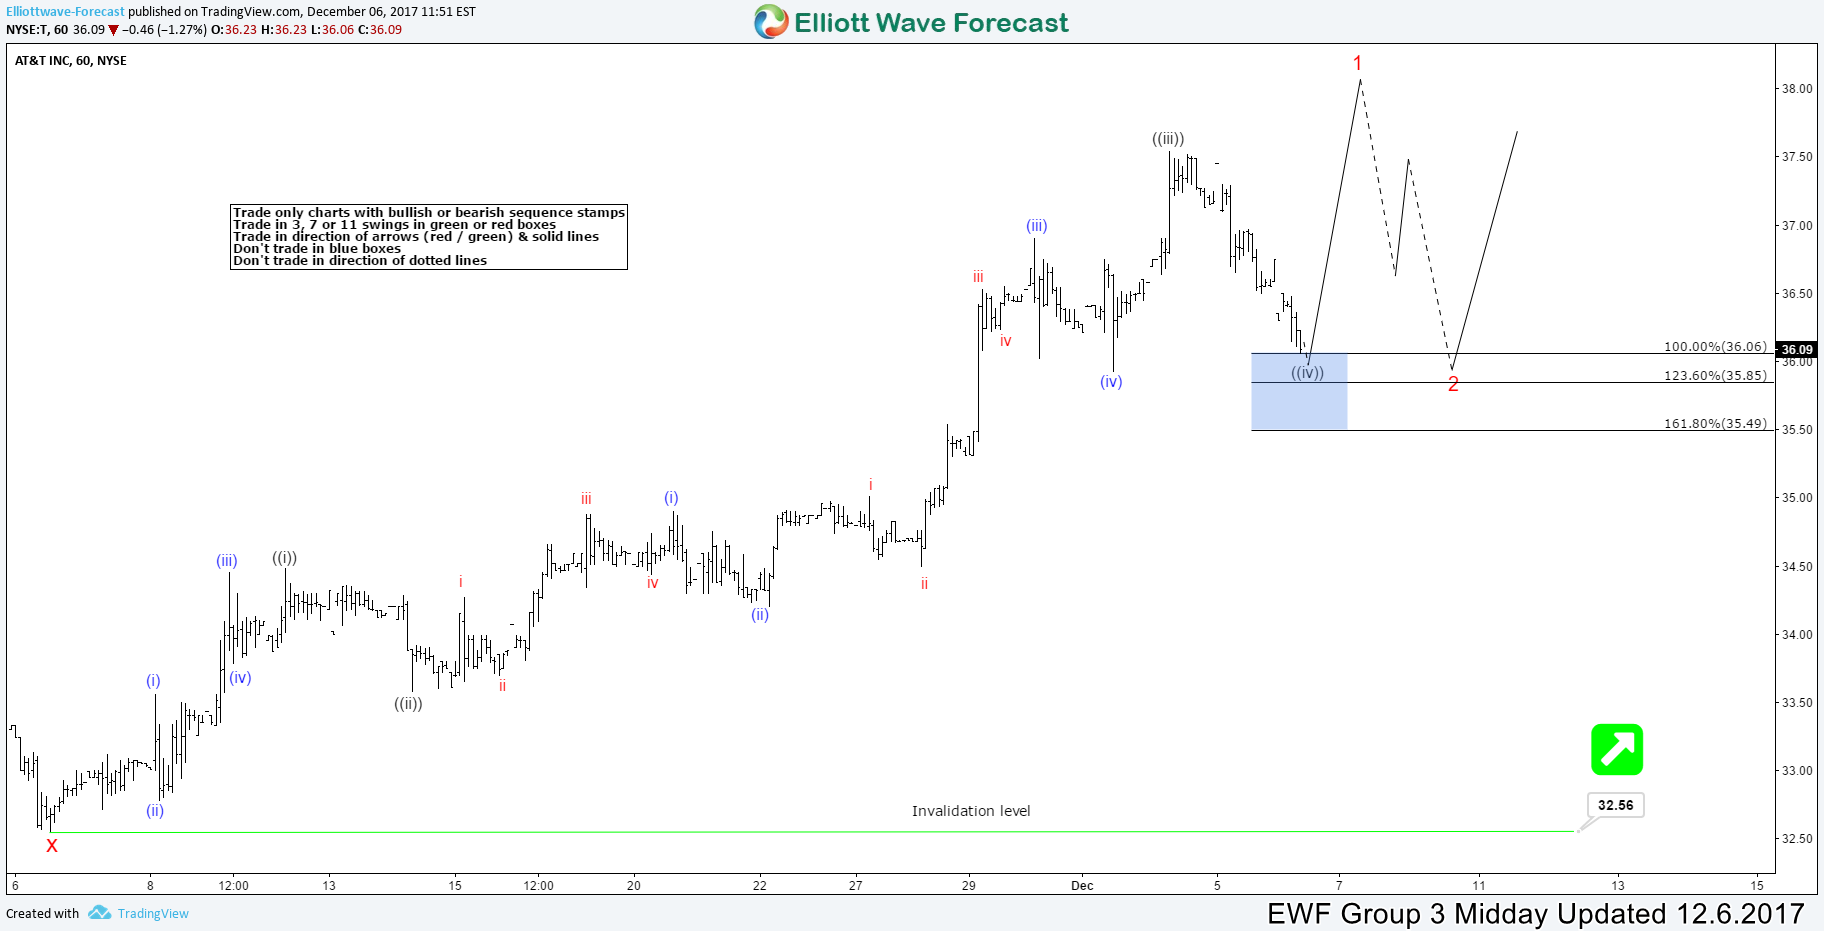
AT&T Showing Elliott Wave Impulsive Sequence
Read MoreAT&T Short term Elliott Wave view suggests that the decline to November 06 low 32.56 ended Cycle wave X. A rally from there is unfolding as an impulse Elliott Wave structure with extension in 3rd swing higher and each leg has internal oscillations of 5 waves thus favoring it to be an impulse. These possible 5 waves move higher should end […]
-
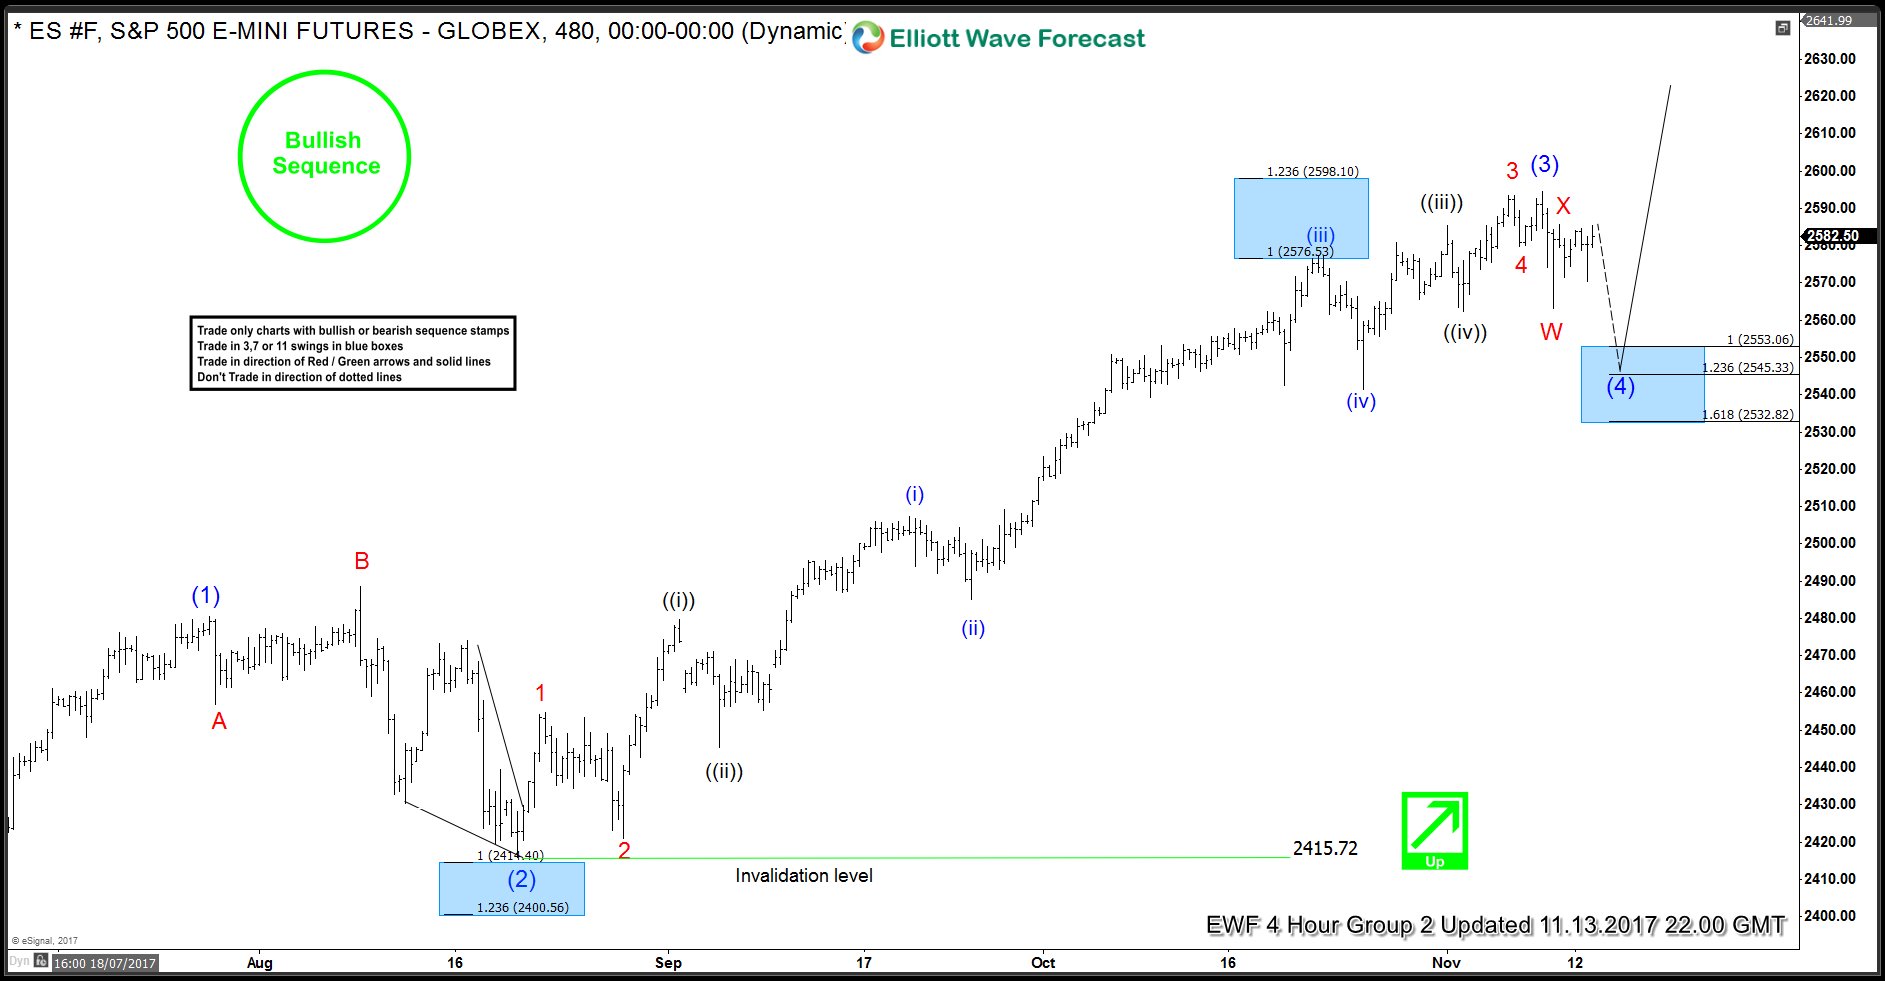
ES_F (S&P 500) Buying the Elliott Wave dips
Read MoreIn this Technical blog, we are going to take a quick look at the past Elliott Wave Chart performance of ES_F (S&P 500). Which we presented to our clients at elliottwave-forecast.com. We are going to explain the structure and the forecast. As our members know, we were pointing out that ES_F (S&P 500) is trading within the larger bullish trend in […]