
-
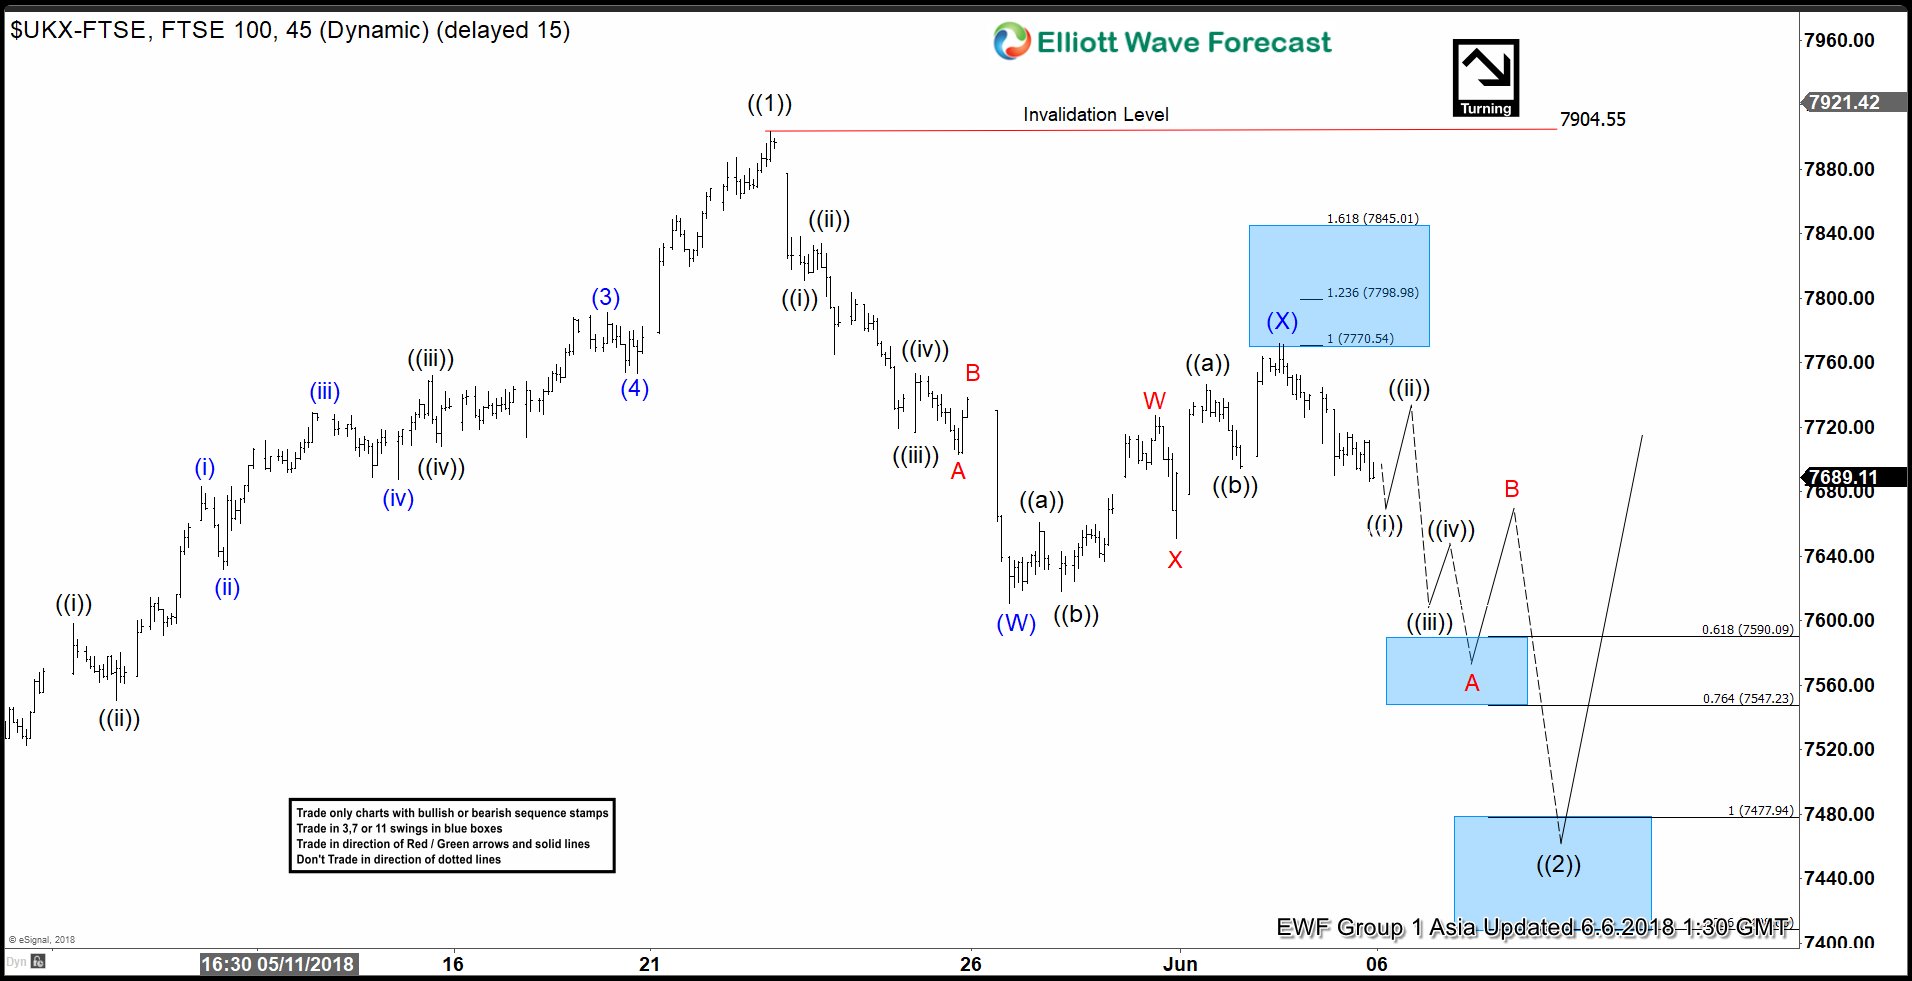
FTSE Elliott Wave View: Buying Opportunity Soon
Read MoreFTSE short-term Elliott wave view suggests that the rally to 7903.50 high on 5/22/2018 peak ended primary wave ((1)). This rally to 7903.5 starts from 3/23/2018 low and took the form of an impulse Elliott wave structure. The index is currently in Primary wave ((2) pullback to correct cycle from 3/23/2018 low. So far the […]
-
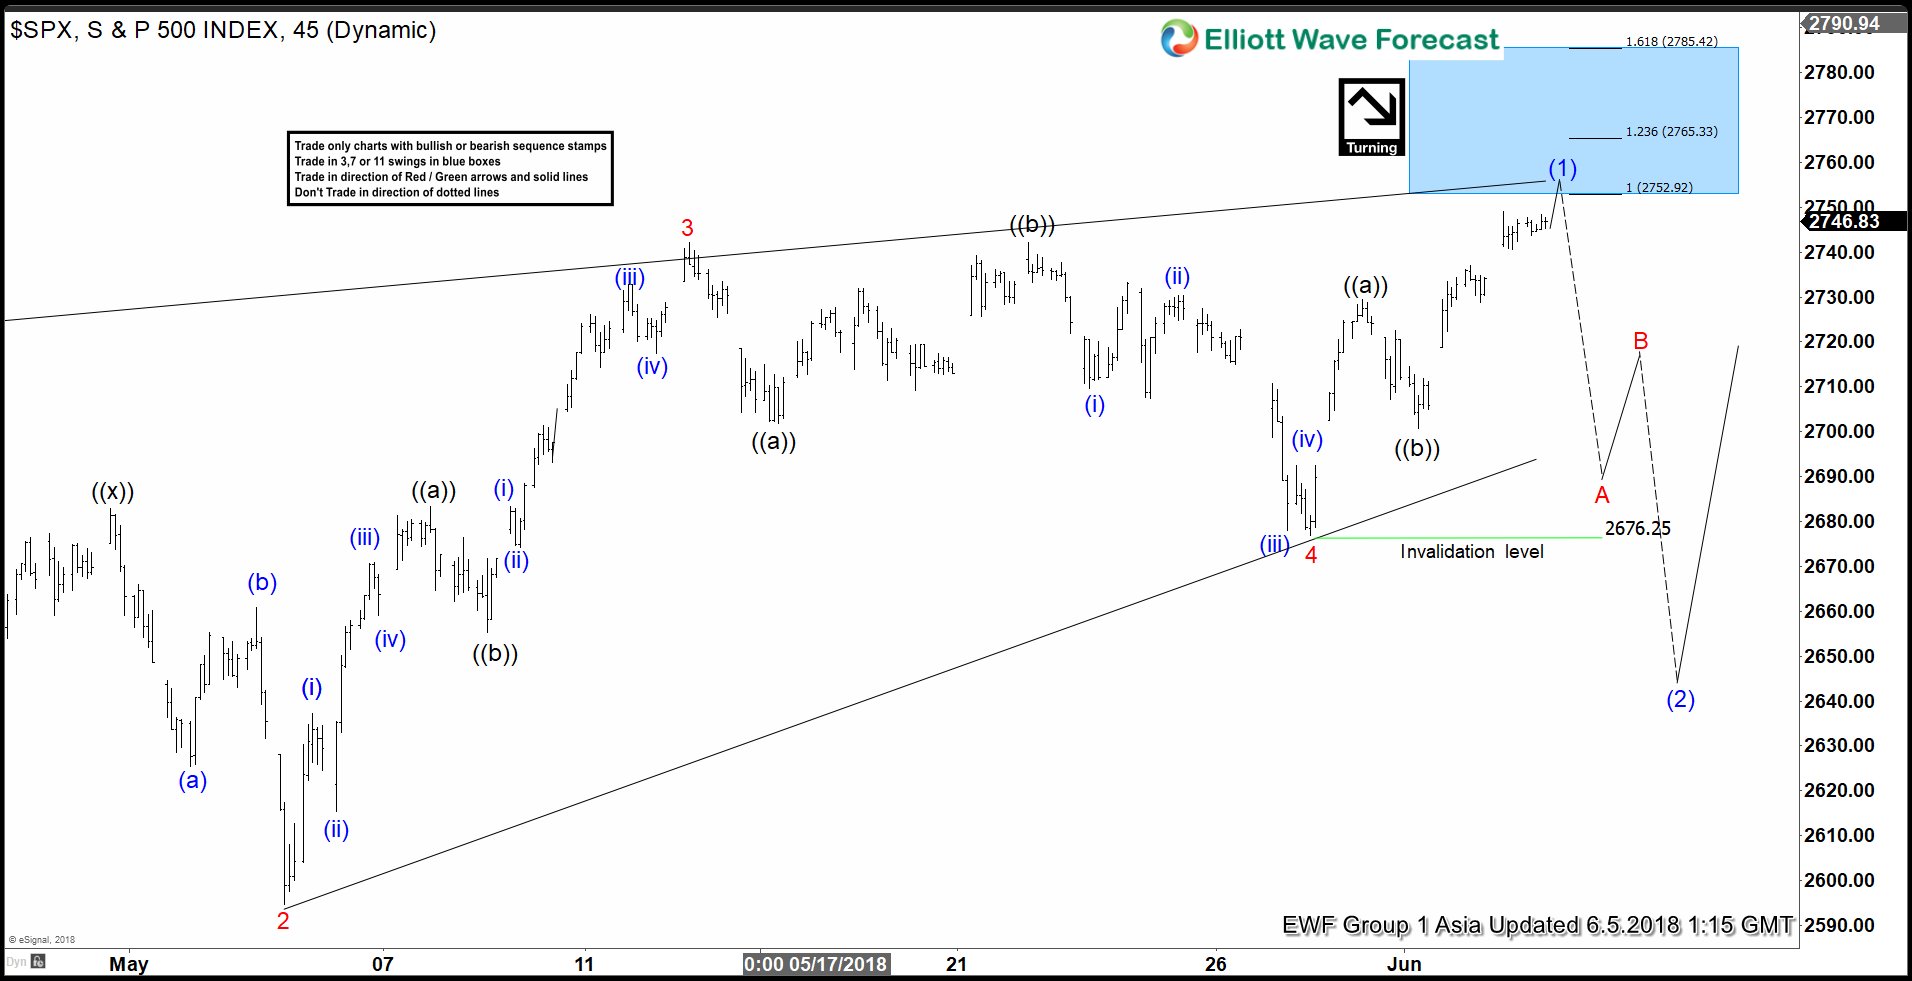
SPX Elliott Wave Analysis: Close To A Pullback?
Read MoreSPX short-term Elliott wave view suggests that the rally from 4/02/2018 low (2553.8) is extending higher in 5 waves structure. These 5 waves are expected to be part of a leading diagonal structure within intermediate wave (1) higher. The move higher from 2553.8 low has the characteristic of a diagonal where the internal distribution of each leg higher […]
-
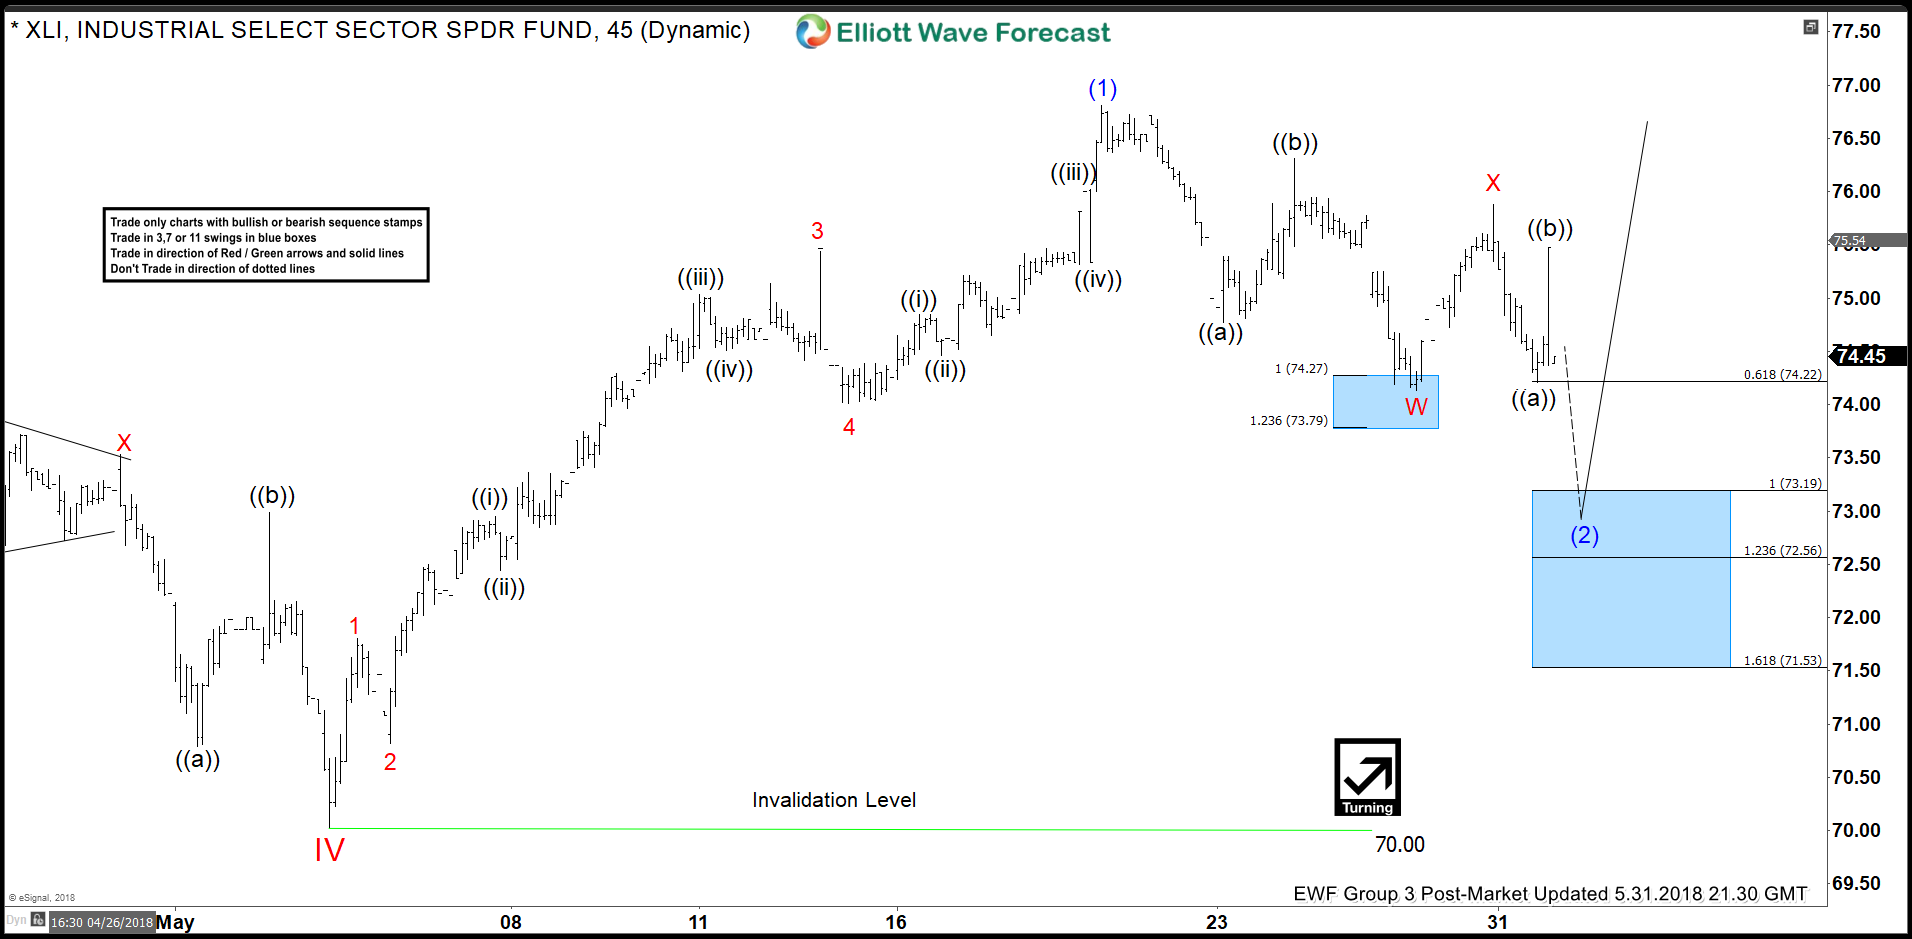
XLI Elliott Wave View: Dips Can Remain Supported
Read MoreXLI: Industrial sector ETF short-term Elliott wave view suggests that the decline to 70$ on May 03 low ended cycle degree wave IV pullback. Above from there, the instrument rallied higher as an impulse and has scope to resume the cycle degree wave V higher. In an impulse structure, the subdivision of wave 1, 3, and 5 […]
-
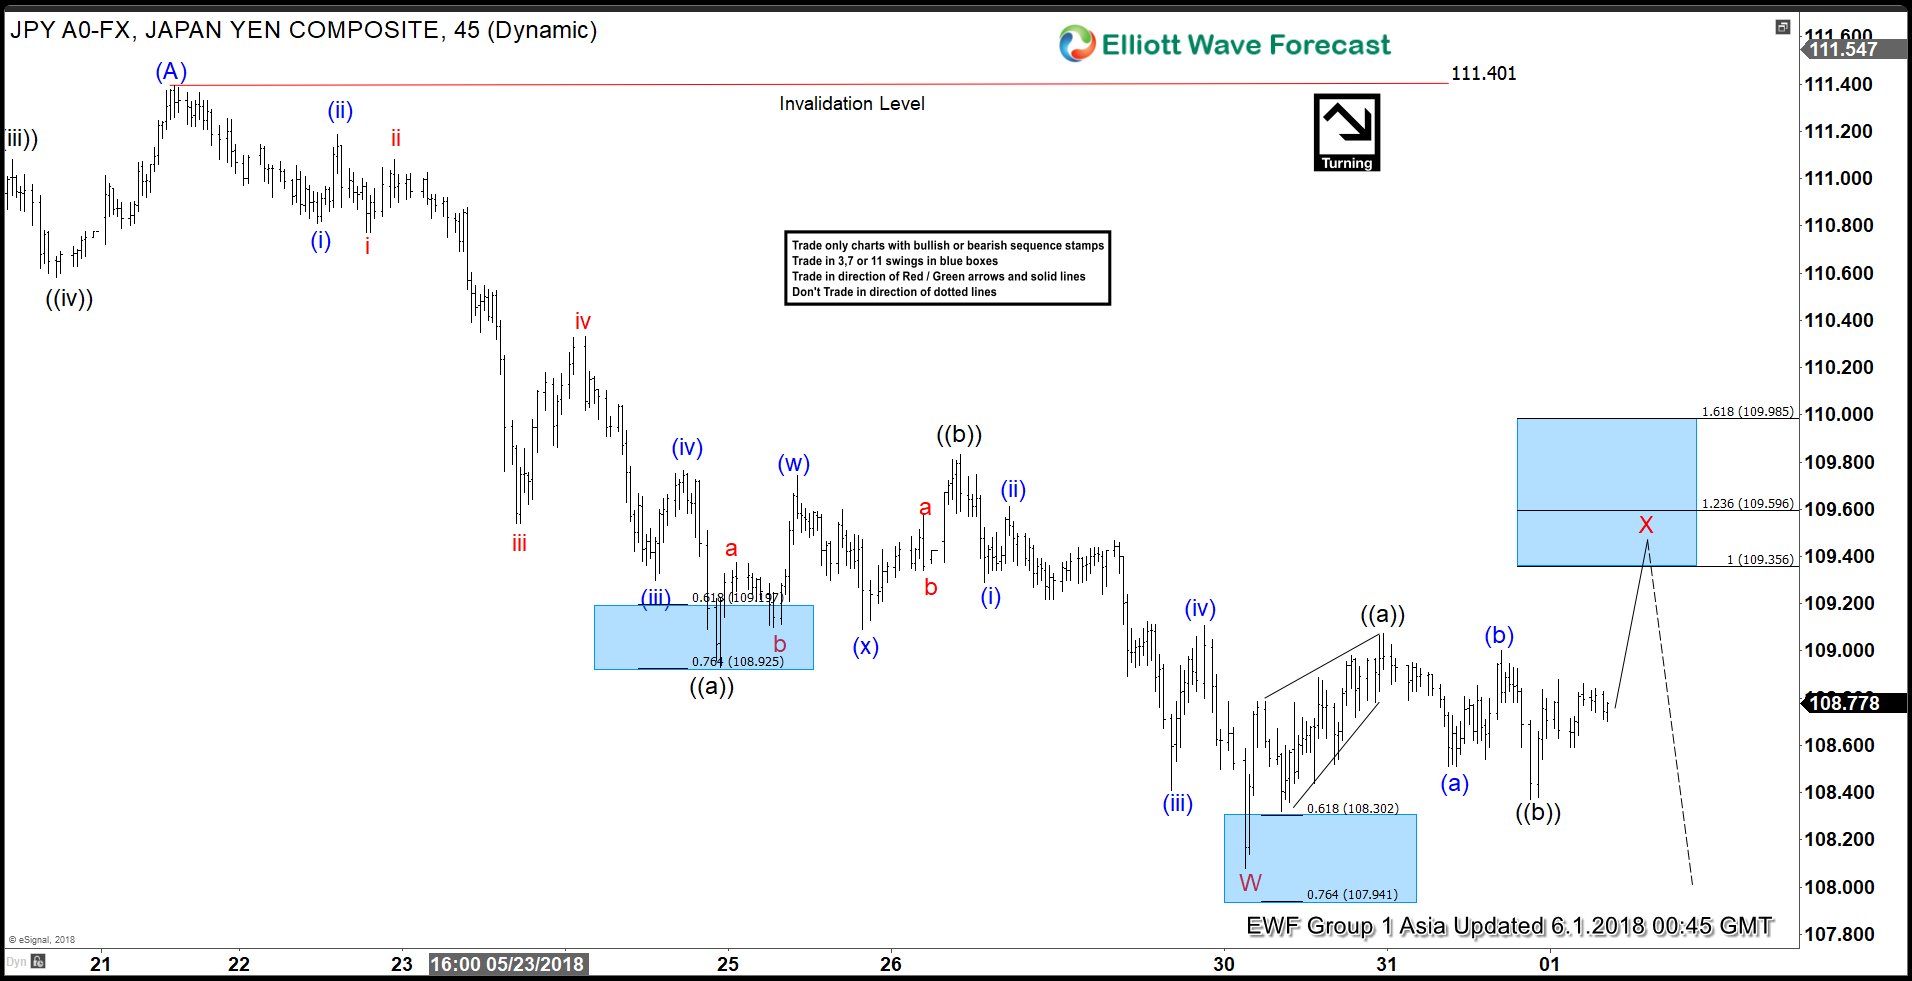
USDJPY Elliott Wave view: Calling For Bounces To Fail Ahead of NFP?
Read MoreUSDJPY Short-term Elliott Wave view suggests that the rally to 111.40 on May 21 ended intermediate wave (A) as a Diagonal structure coming from March 26 low (104.52) cycle. Pair is currently correcting cycle from 3/26 low within Intermediate wave (B). The pullback shows overlapping price structure suggesting that it is taking the form of a […]
-
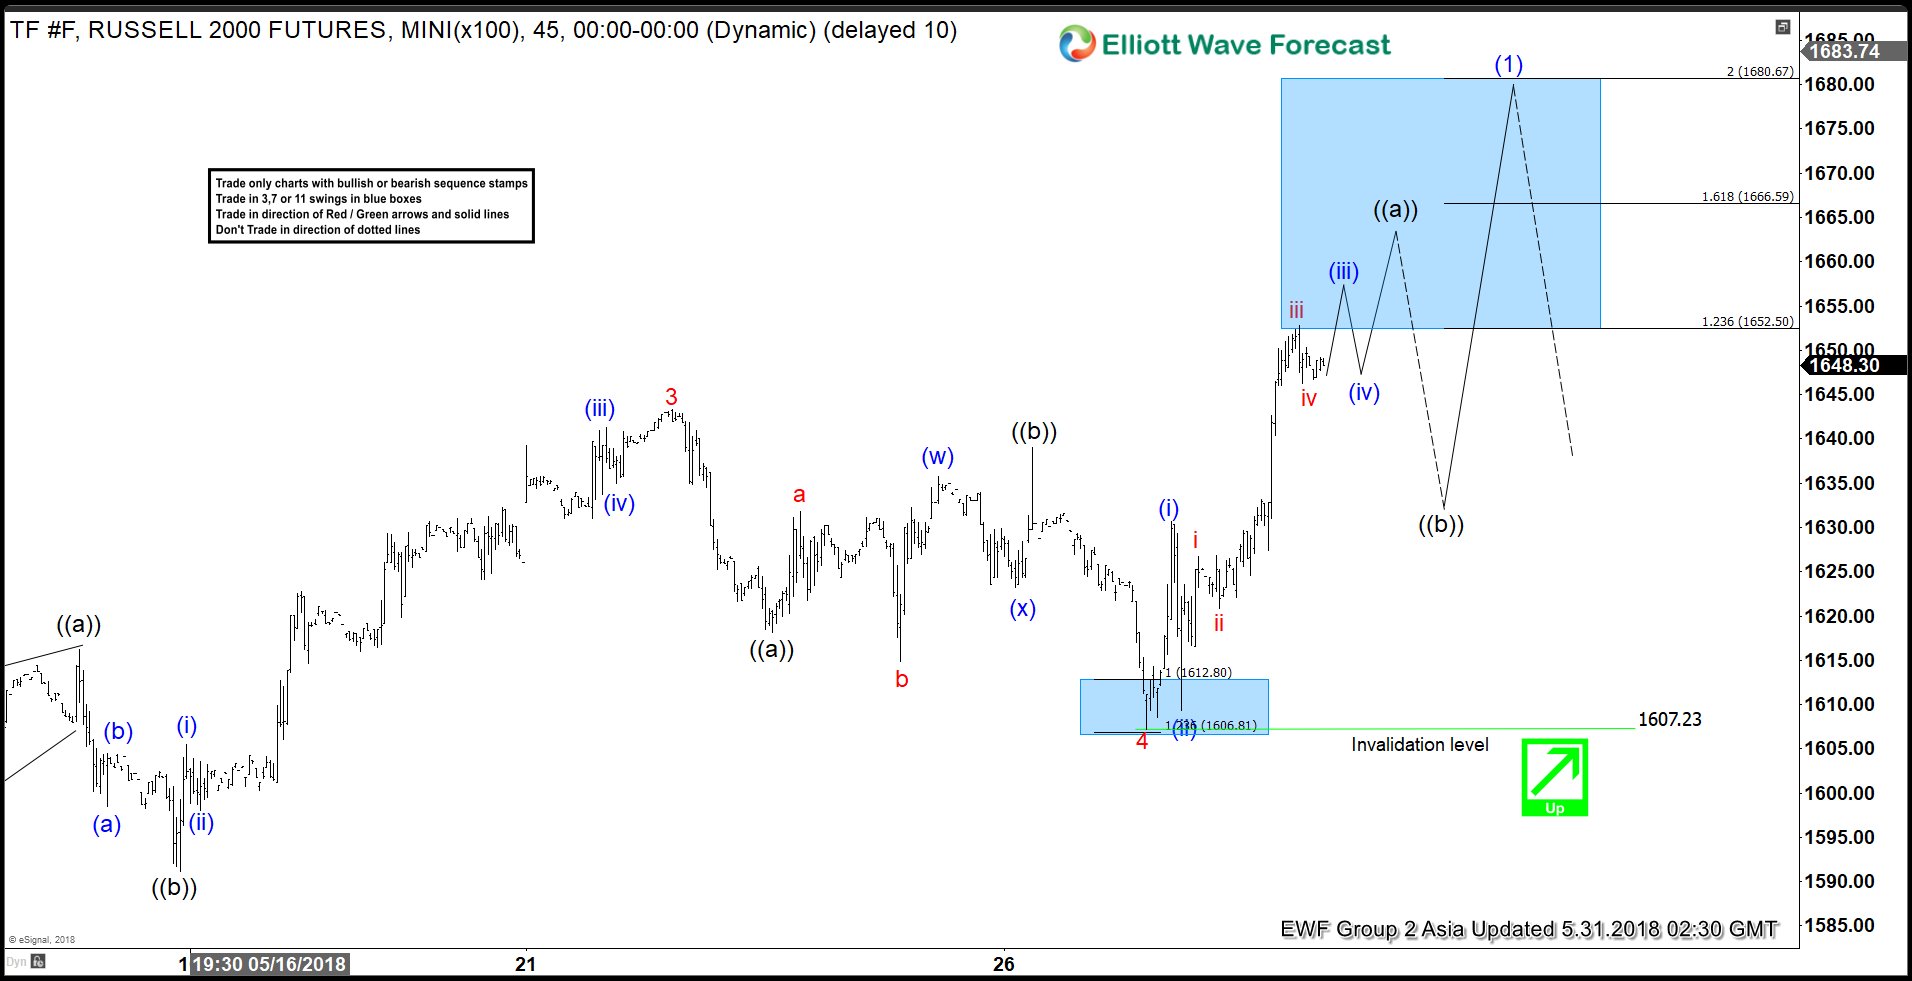
Elliott Wave View: Russell (TF_F) Pullback Around The Corner?
Read MoreRussell (TF_F) index short-term Elliott Wave view suggests that the rally from April 02.2018 low (1482.6) is taking a form of an Elliott wave leading diagonal structure within Intermediate wave (1) higher. Leading diagonal structure usually appears as the sub-division of a wave (1) of an impulse or wave (A) of a Zigzag structure. The […]
-
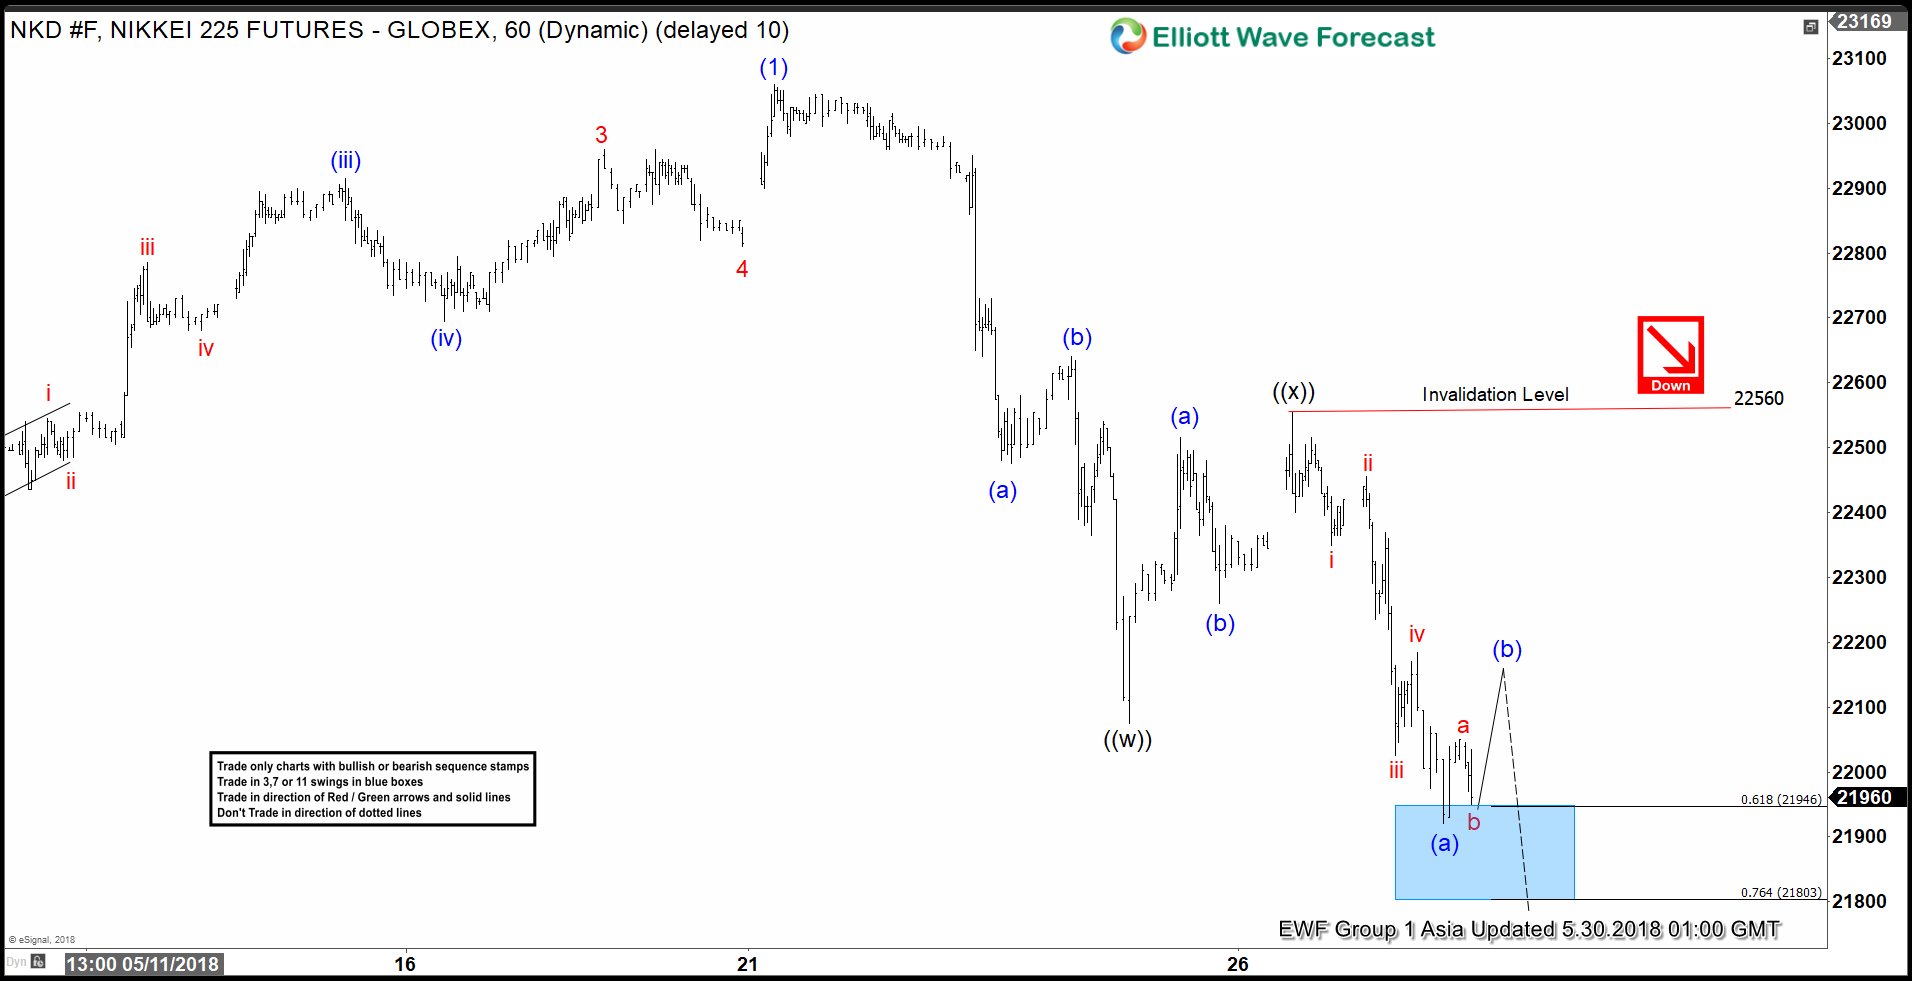
Nikkei Elliott Wave Analysis: Pullback Remains In Progress
Read MoreNikkei short-term Elliott wave view suggests that the rally to 23060 on May 20 high ended Intermediate wave (1) as an impulse. Down from there, the index is pulling back in Intermediate wave (2) pullback to correct cycle from March 23, 2018 low in 3, 7 or 11 swings before the rally resumes. The decline […]