
-
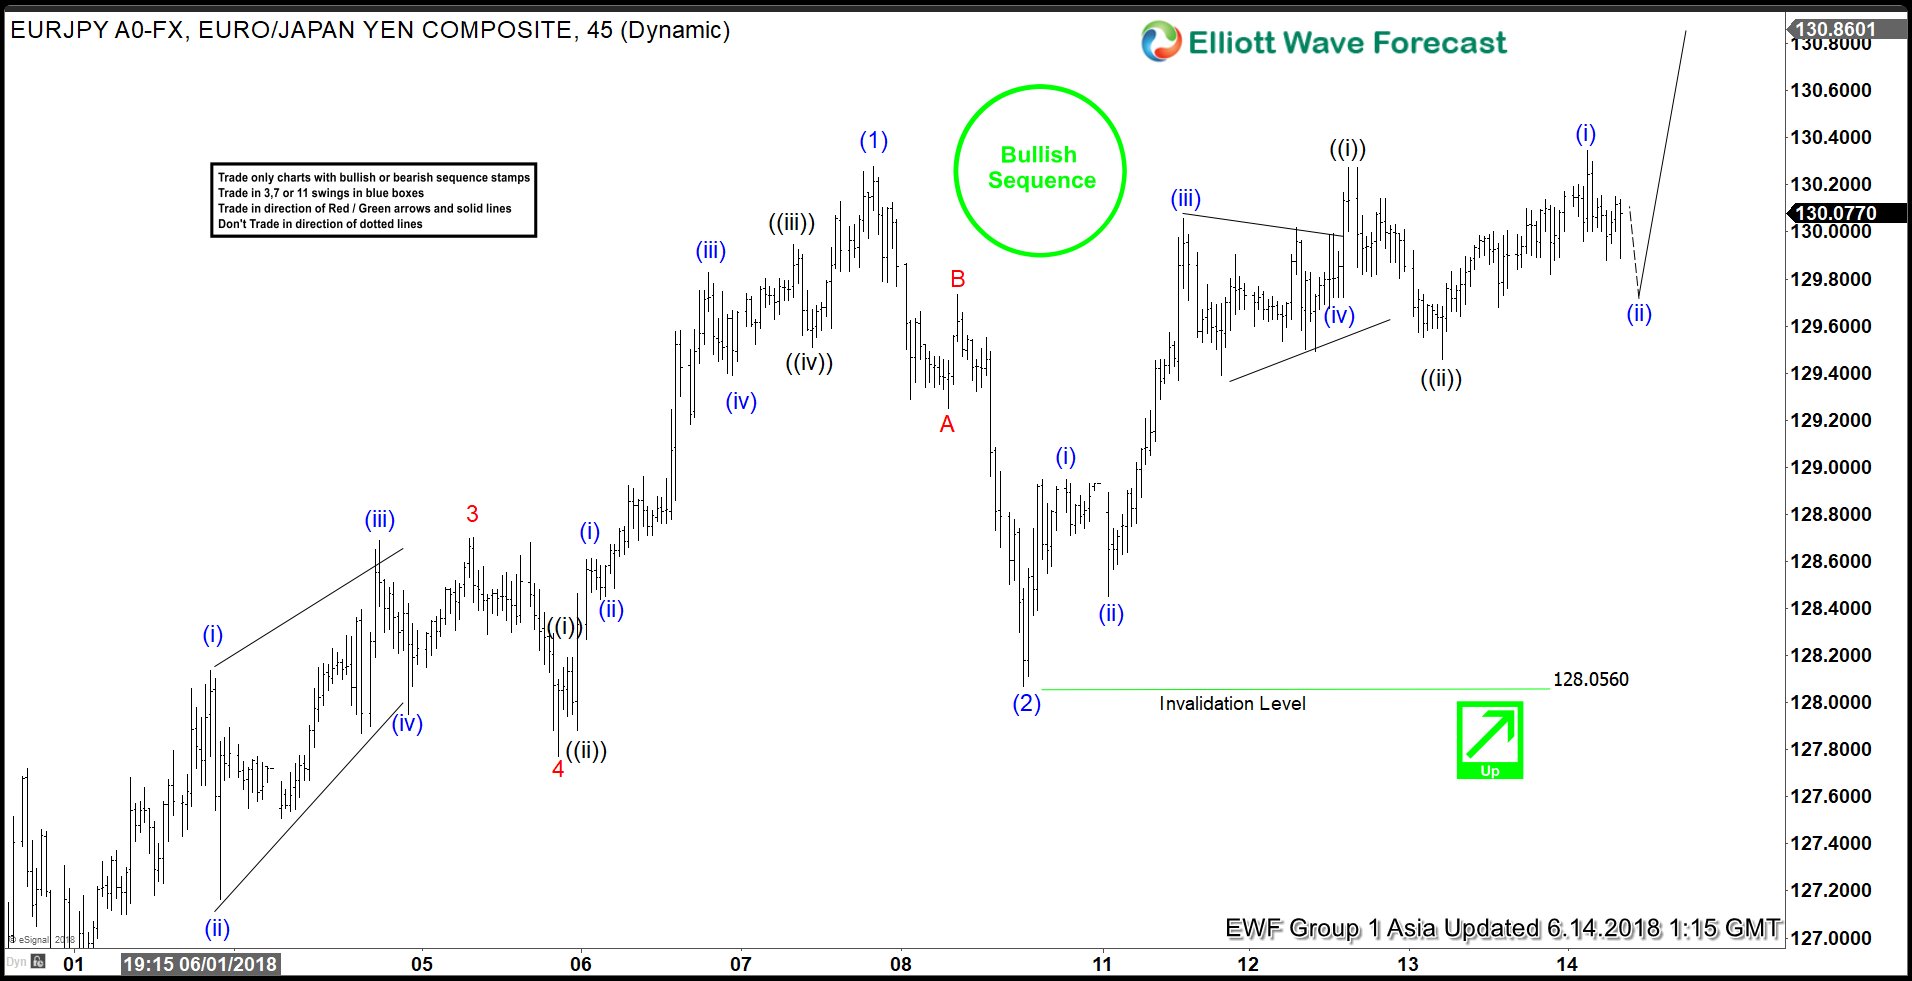
EURJPY Elliott Wave View: Starting The Next Leg Higher
Read MoreEURJPY short-term Elliott wave view suggests that the rally from 5/29 low (124.59) to 6/07 high (130.276) ended intermediate wave (1). The internals of that rally higher unfolded as Impulse Elliott Wave structure where subdivision of Minor 1, 3 and 5 unfolded also as an impulse in lesser degree. Down from there, the pair made a 3 […]
-
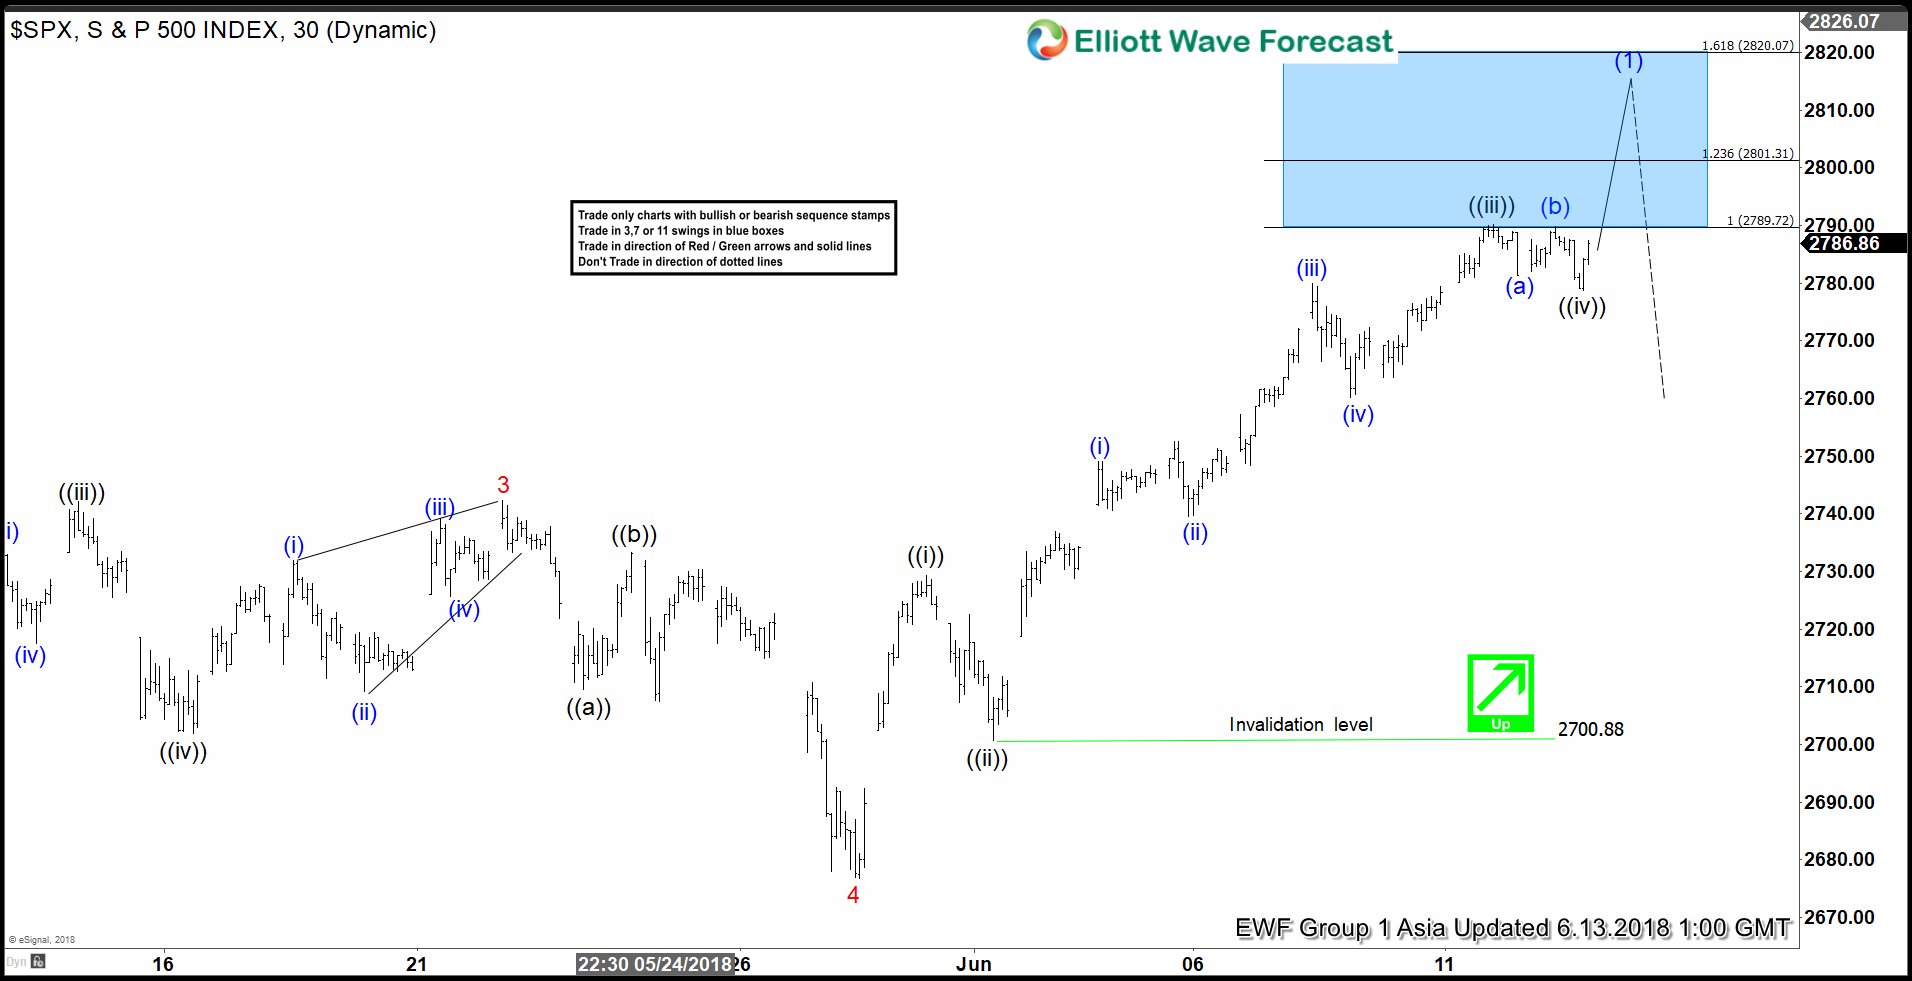
Intraday Elliott Wave Analysis: SPX Due for Pullback Soon
Read MoreSPX short-term Elliott wave view suggests that the rally to 2742.24 high ended Minor wave 3 as Elliott wave impulse. Below from there the pullback to 2676.81 on 5/29/2018 low ended Minor wave 4 as Zigzag structure. Up from there, Minor wave 5 rally is unfolding as impulse Elliott wave structure with extension in 3rd wave […]
-
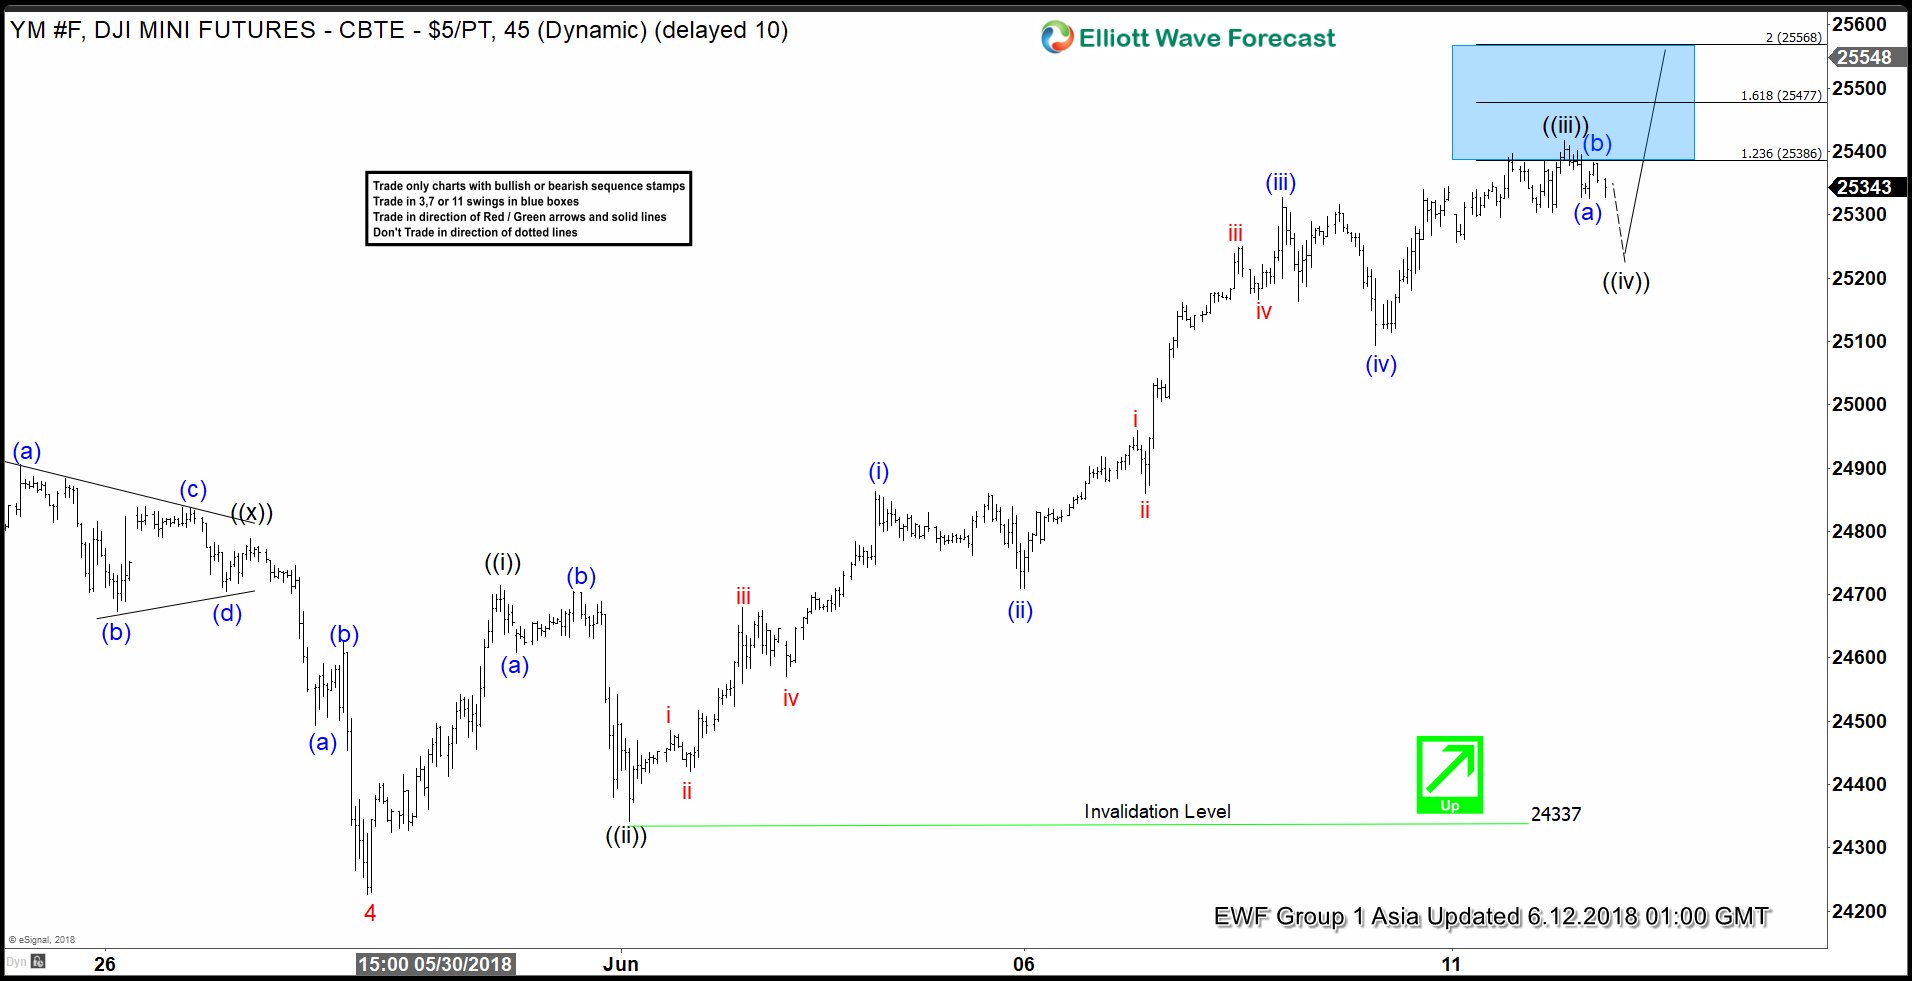
Dow Jones Nearing Completion of 5 Waves Impulse
Read MoreDow Jones futures ticker symbol: $YM_F short-term Elliott wave view suggests that the pullback to 24227 low on 5/29/2018 ended Minor wave 4 pullback. Above from there, the rally is unfolding as impulse Elliott wave structure with extension in 3rd wave higher. As impulse, the internal of Minute degree wave ((i)), ((iii)) and ((v)) should […]
-
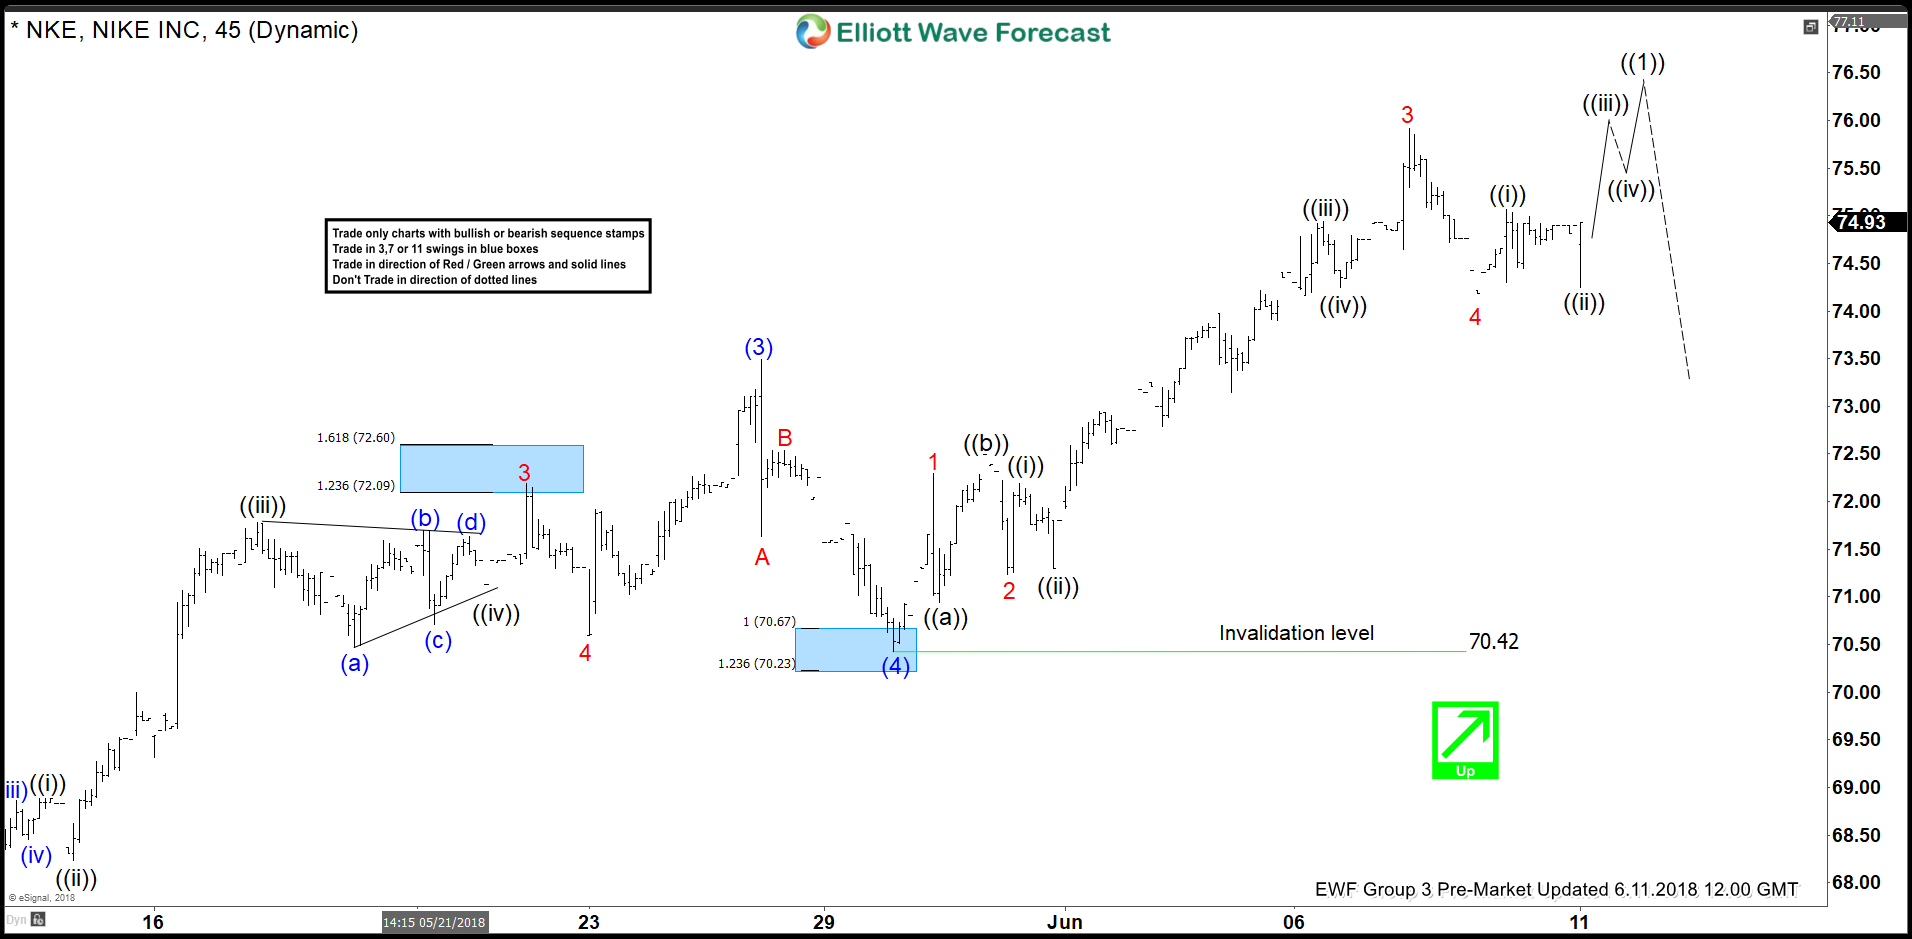
Nike Ending Elliott Wave 5 Waves Soon?
Read MoreNike ticker Symbol: $NKE short-term Elliott wave view suggests that the rally to 73.47 high ended intermediate wave (3) as impulse. Down from there, the stock made a pullback in intermediate wave (4) pullback as Zigzag correction when internal Minor wave A ended at 71.65. Minor wave B ended at 72.53 high and Minor wave […]
-
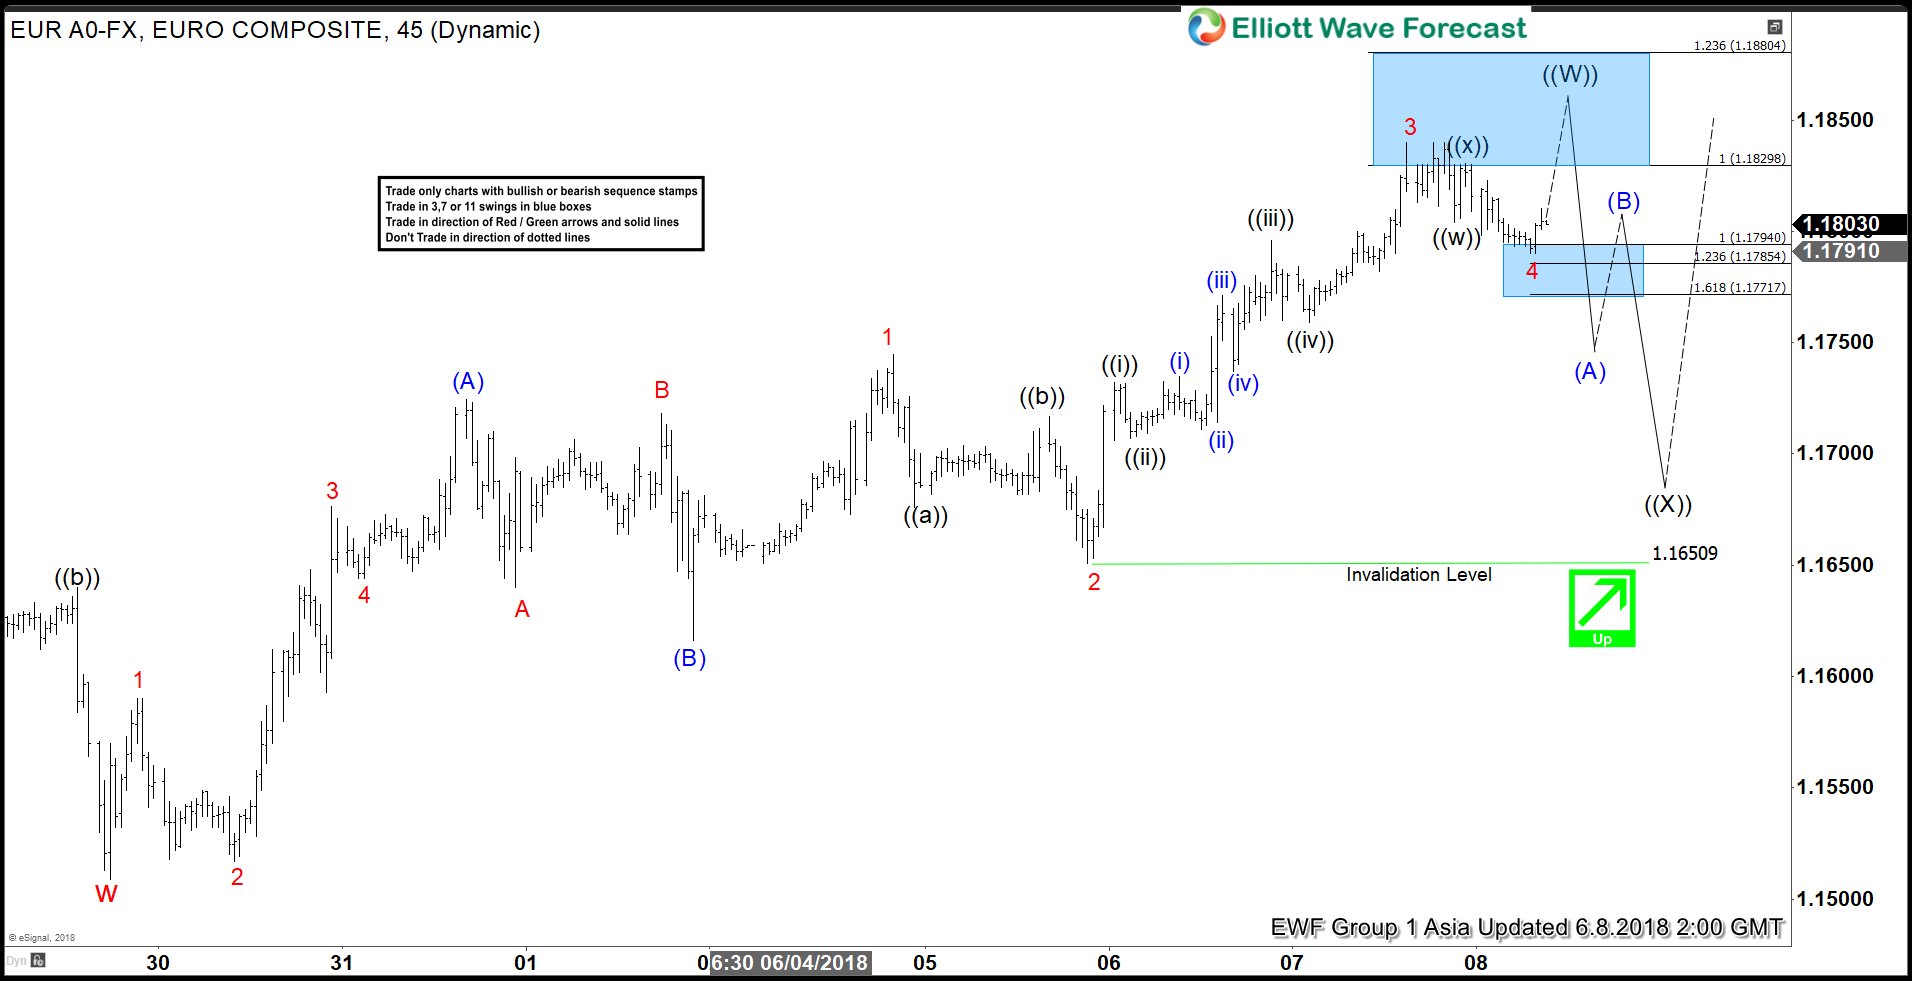
Elliott Wave Analysis: EURUSD May See Profit Taking Soon
Read MoreEURUSD short-term Elliott wave view suggests that the decline to 1.1509 on 5/29/2018 low ended Cycle degree wave “w”. Above from there, the bounce is taking place as Elliott wave zigzag structure to end the Primary degree wave ((W)) cycle. Afterwards, the pair is expected to do a pullback in Primary degree wave ((X)) in […]
-
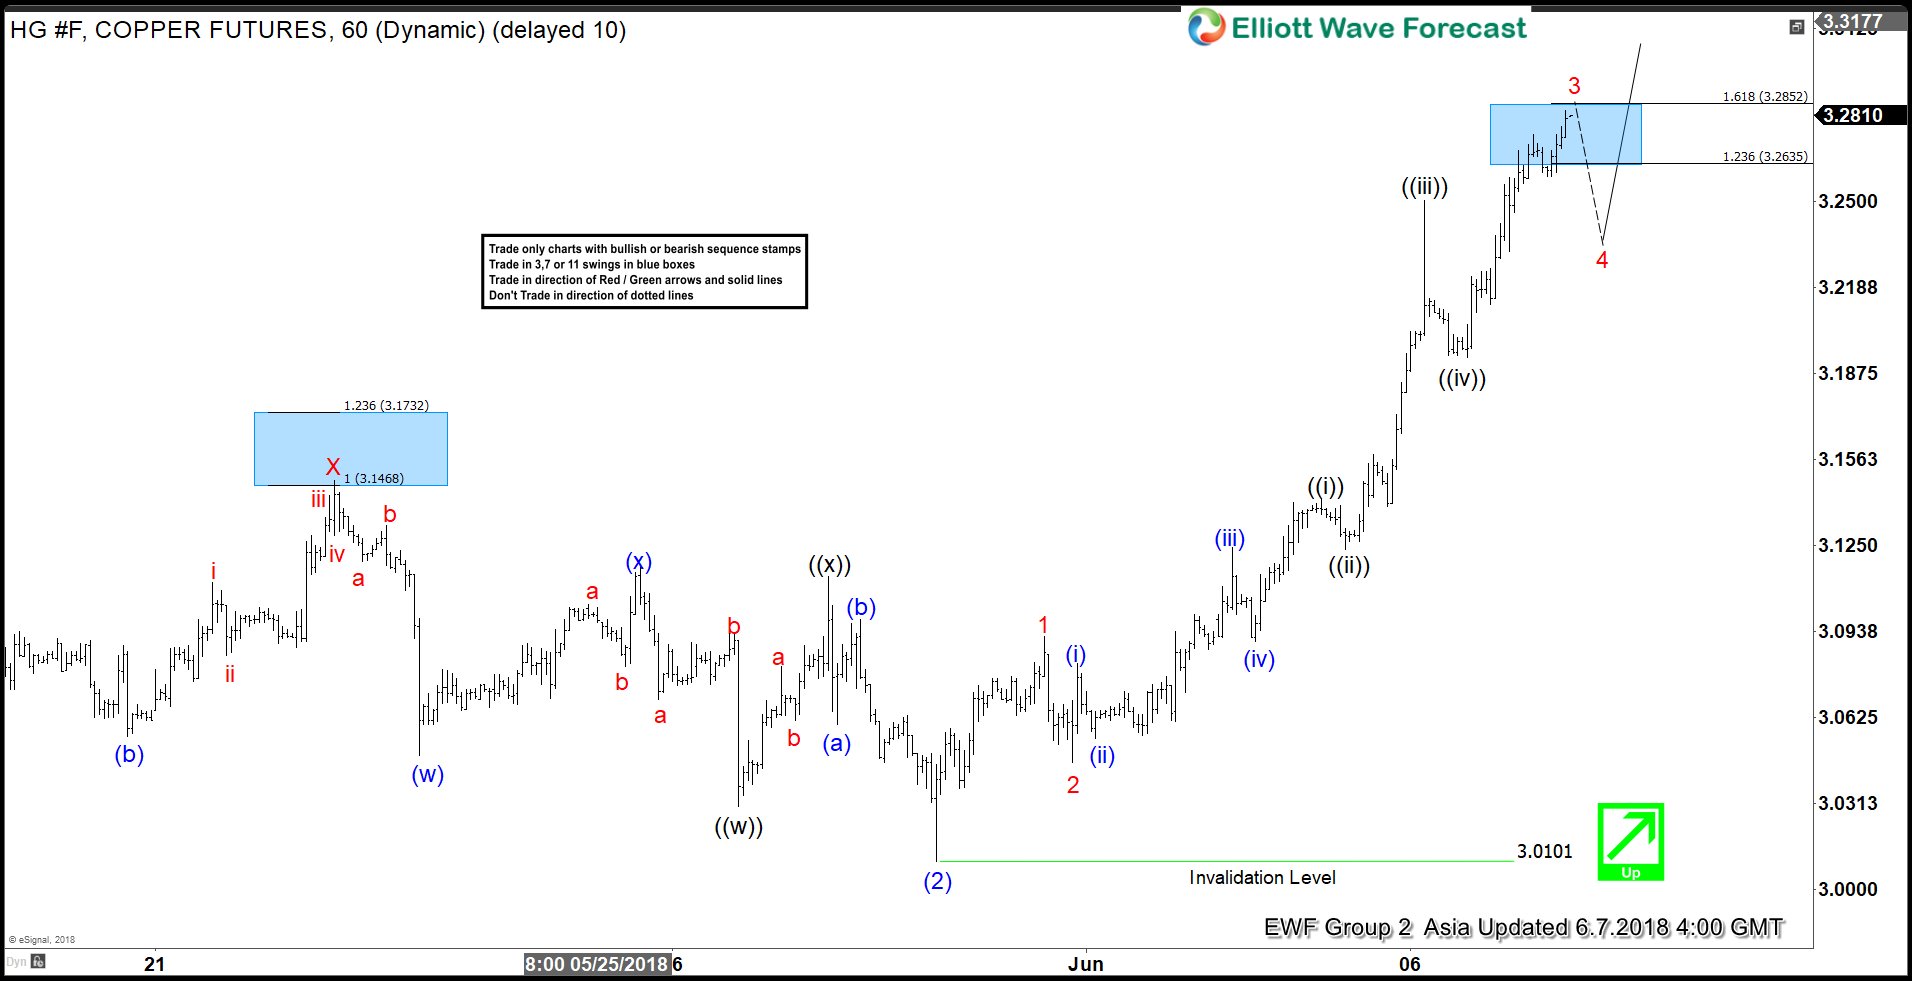
Copper Elliott Wave View: Next Extension Higher may have started
Read MoreCopper ticker symbol: HG_F short-term Elliott wave view suggests that the pullback to 3.0101 on 5/30/2018 ended Intermediate wave (2). The internals of Intermediate wave (2) unfolded as Elliott wave double three structure where Minor wave W ended at 3.0195. Minor wave X ended at 3.1485 high and the decline to 3.0101 low ended Minor […]