
-
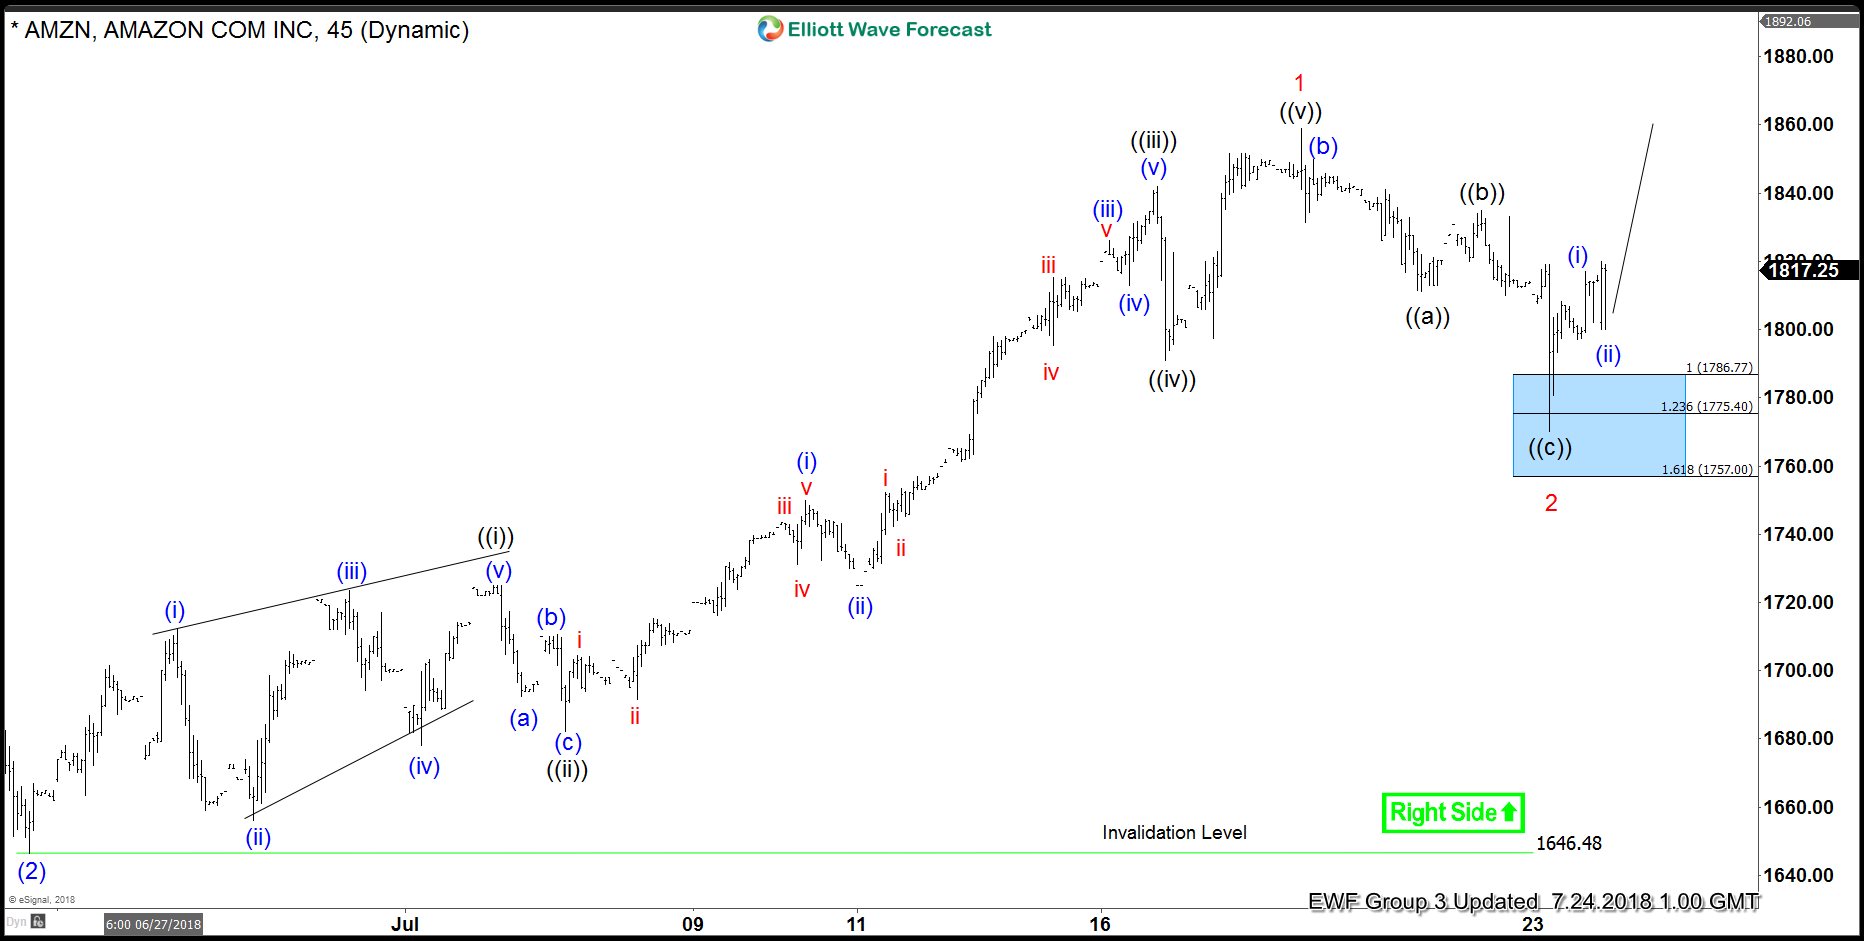
Elliott Wave Analysis: Amazon May Start Another Extension Higher
Read MoreAmazon ticker symbol: $AMZN short-term Elliott wave analysis suggests that pullback to $1646.48 low ended intermediate wave (2). Above from there, the stock is rallying higher in intermediate wave (3) higher. The internals of that extension higher is unfolding as Elliott wave impulse structure with sub-division of 5 waves structure in lesser degree Minor wave 1, […]
-
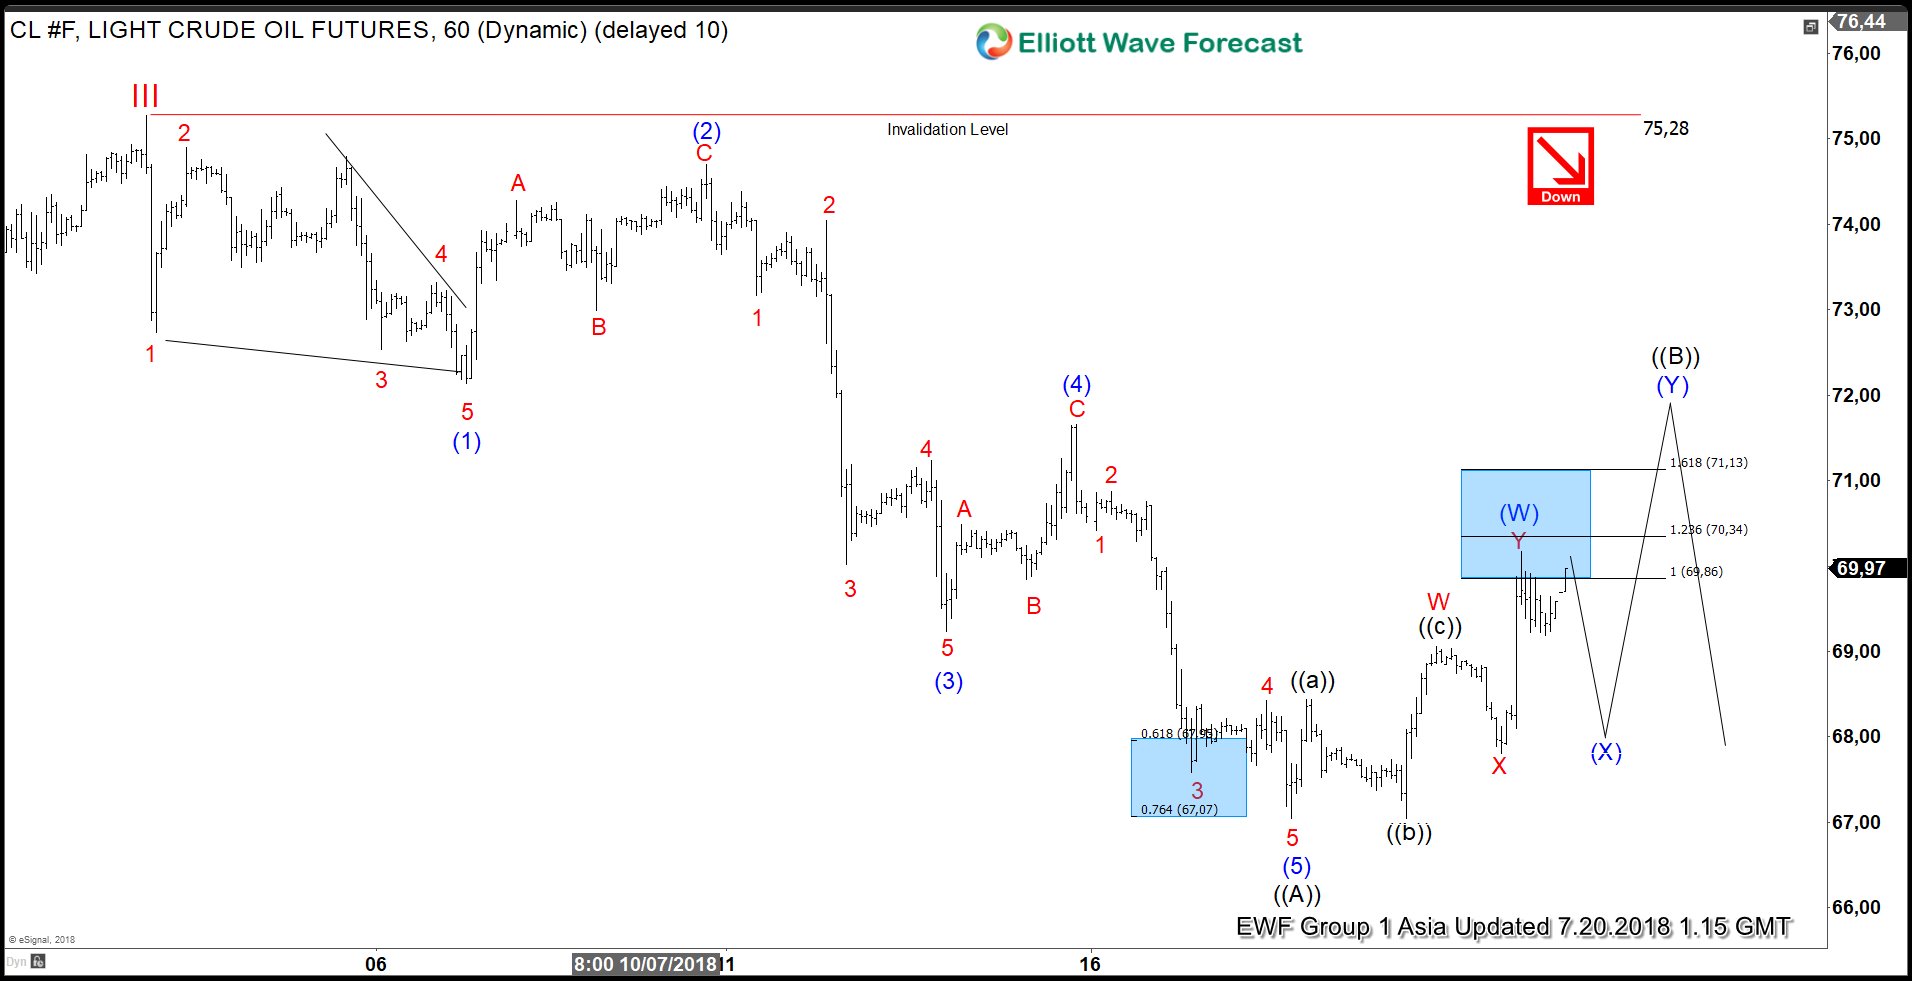
OIL Elliott Wave Analysis: Larger Correction Taking Place?
Read MoreOIL short-term Elliott wave analysis suggests that the rally to $75.28 high ended cycle degree wave III. Down from there, the larger correction in cycle degree wave IV is taking place in 3, 7 or 11 swings before Oil resumes higher. The internal of the first leg of the decline from $75.28 high took place […]
-
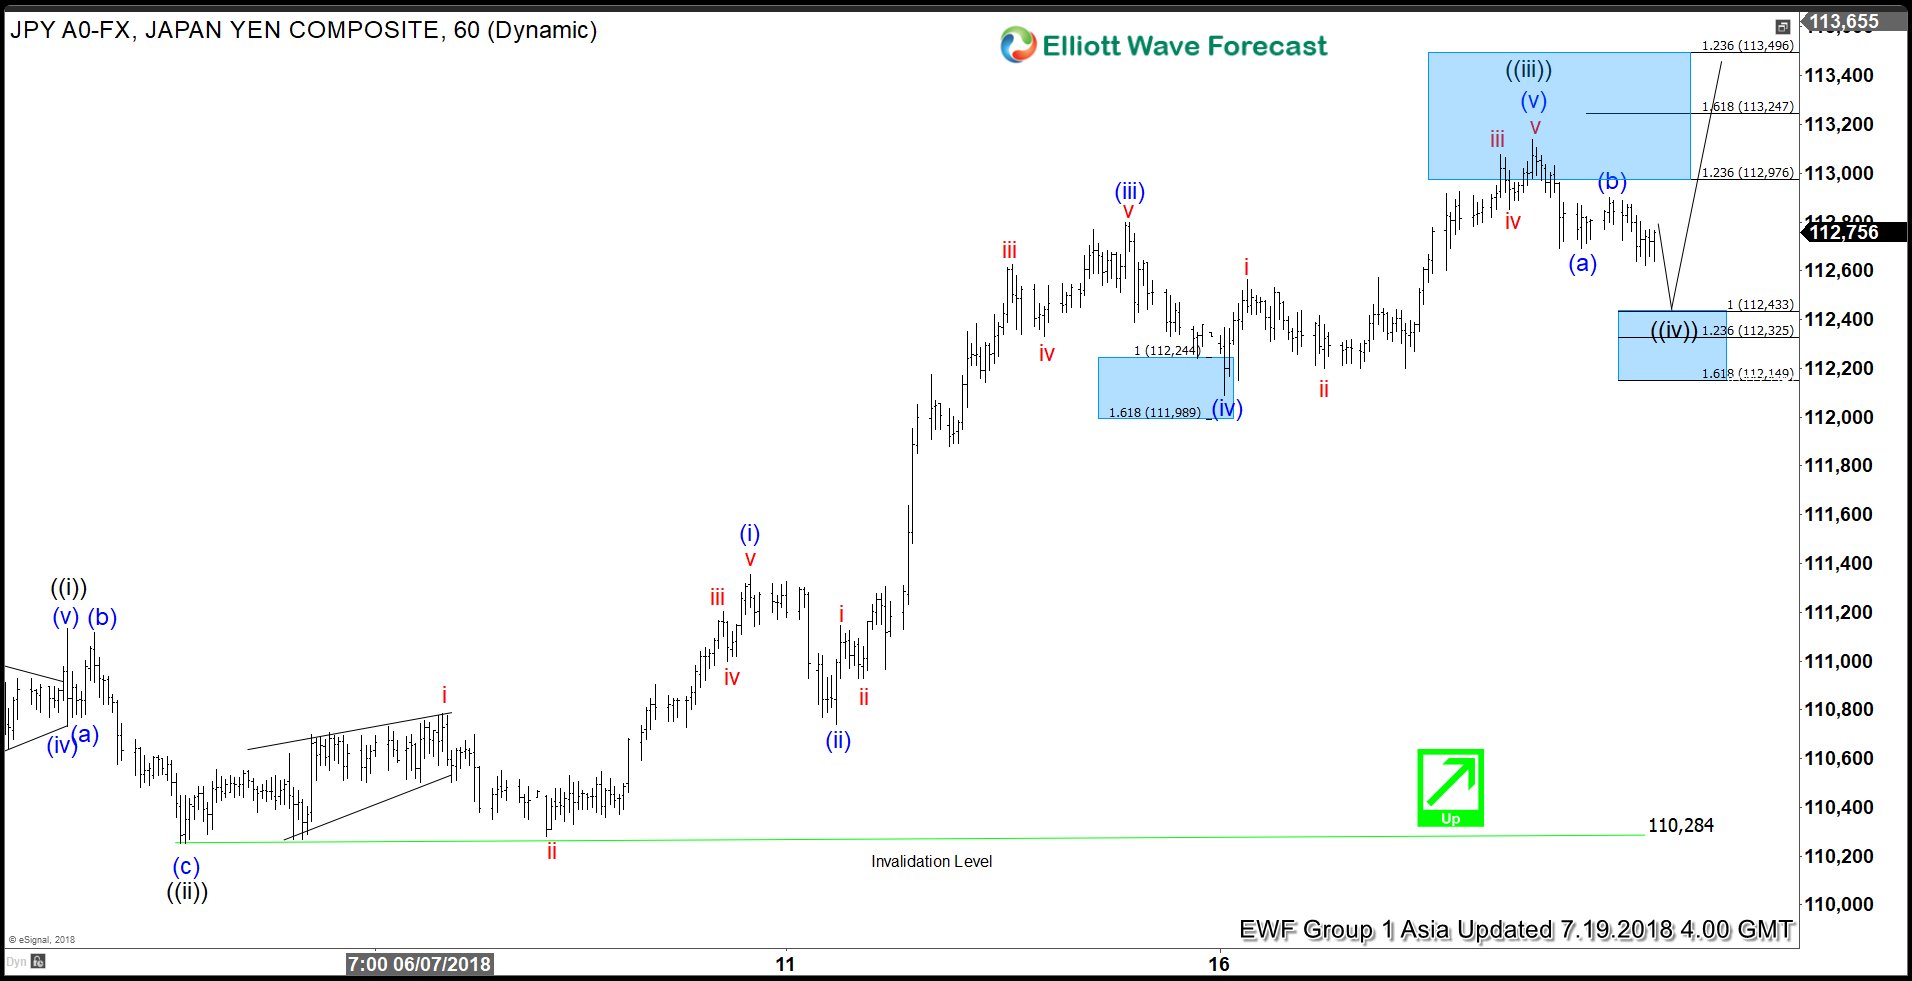
Elliott Wave Analysis: USDJPY Rallying Higher As Impulse
Read MoreUSDJPY short-term Elliott Wave analysis suggests that the pullback to 110.28 low ended Minute wave ((ii)) pullback. The internals of that pullback unfolded as Elliott wave Flat structure where Minutte wave (a) ended at 110.77. Up from there, bounce to 111.11 ended Minutte wave (b), and Minutte wave (c) of ((ii)) ended in 5 waves at 110.28 low. […]
-
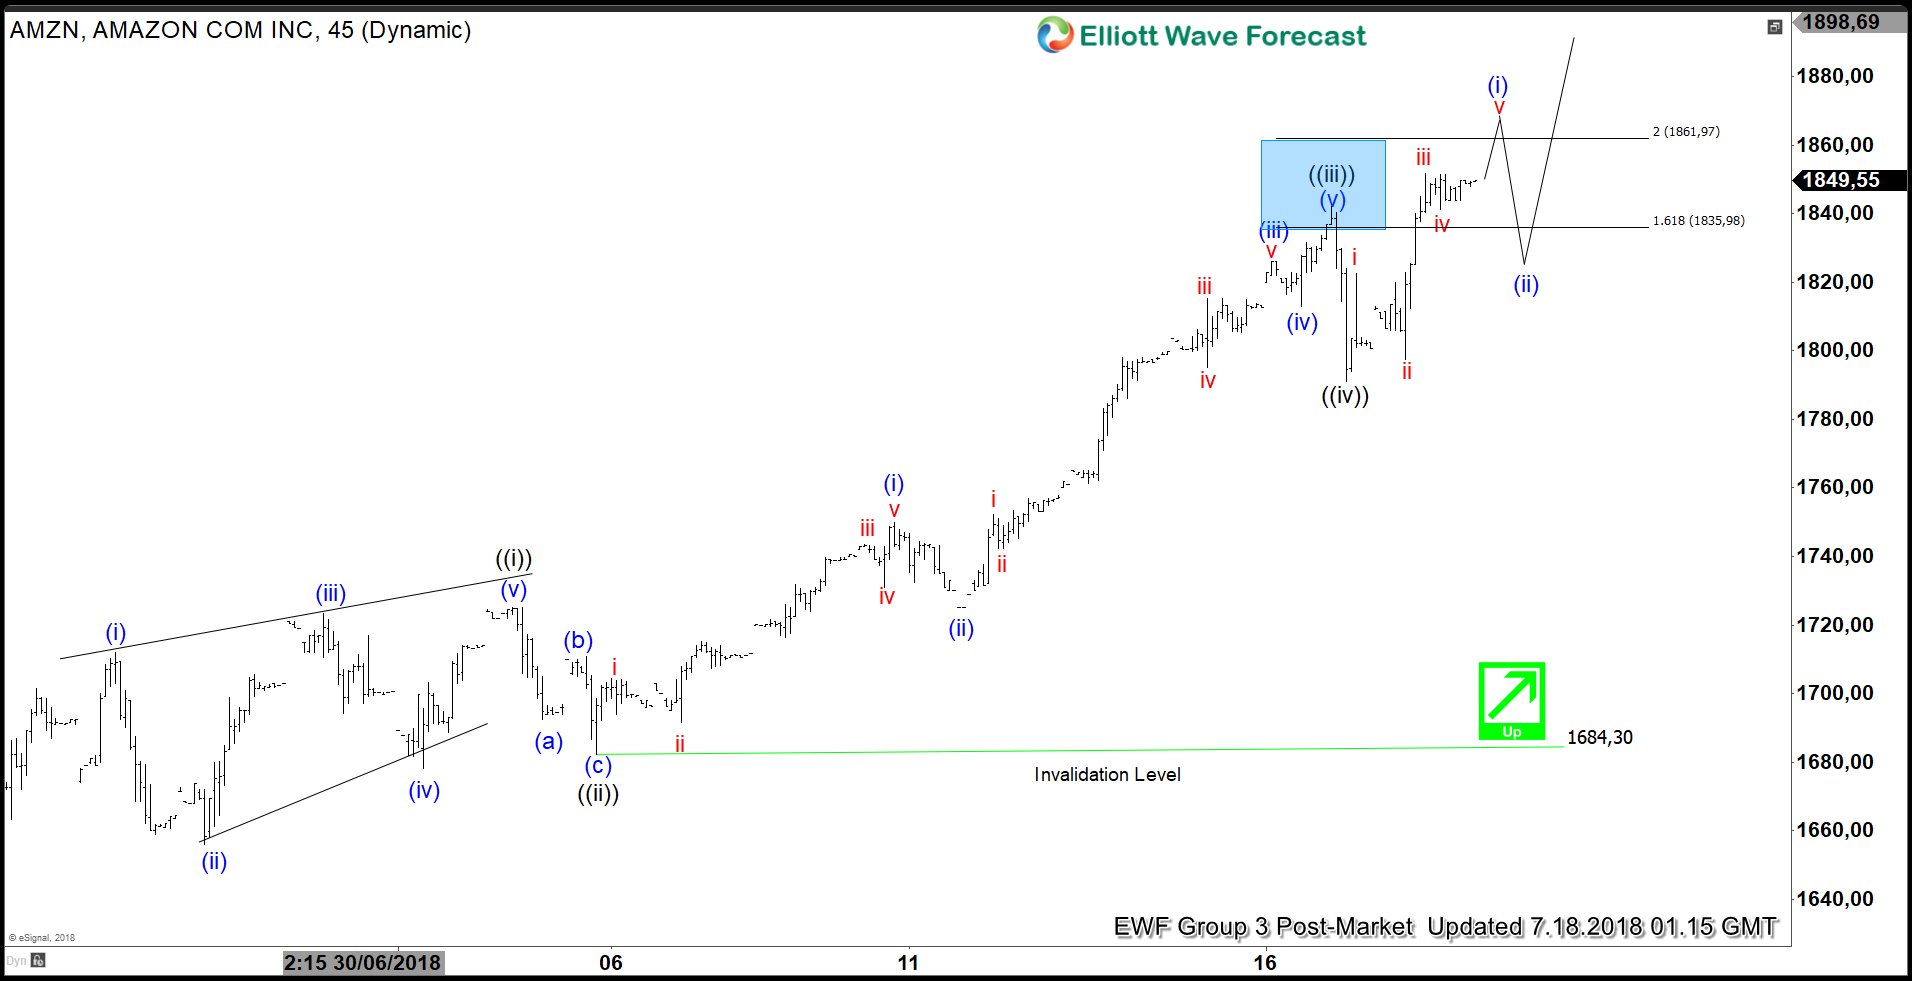
Elliott Wave Analysis: Amazon Showing Impulse Rally
Read MoreAmazon ticker symbol: $AMZN short-term Elliott wave analysis suggests that the cycle from 6/25/2018 low ($1646.31) is rallying higher in an impulse structure. This suggests that the internal sub-division of each leg higher is unfolding as 5 waves structure of lesser degree i.e Minute wave ((i)), ((iii)) & ((v)), whereas Minute wave ((ii)) & ((iv)) […]
-

Facebook Elliott Wave Analysis: Correction Taking Place
Read MoreFacebook ticker symbol: $FB short-term Elliott Wave analysis suggests that the decline to $192.22 low ended cycle degree wave II as double three structure. Up from there, the stock is rallying higher and making new all-time highs within cycle degree wave III. Up from $192.22 low, the rally to $208.2 high ended primary wave ((1)). […]
-
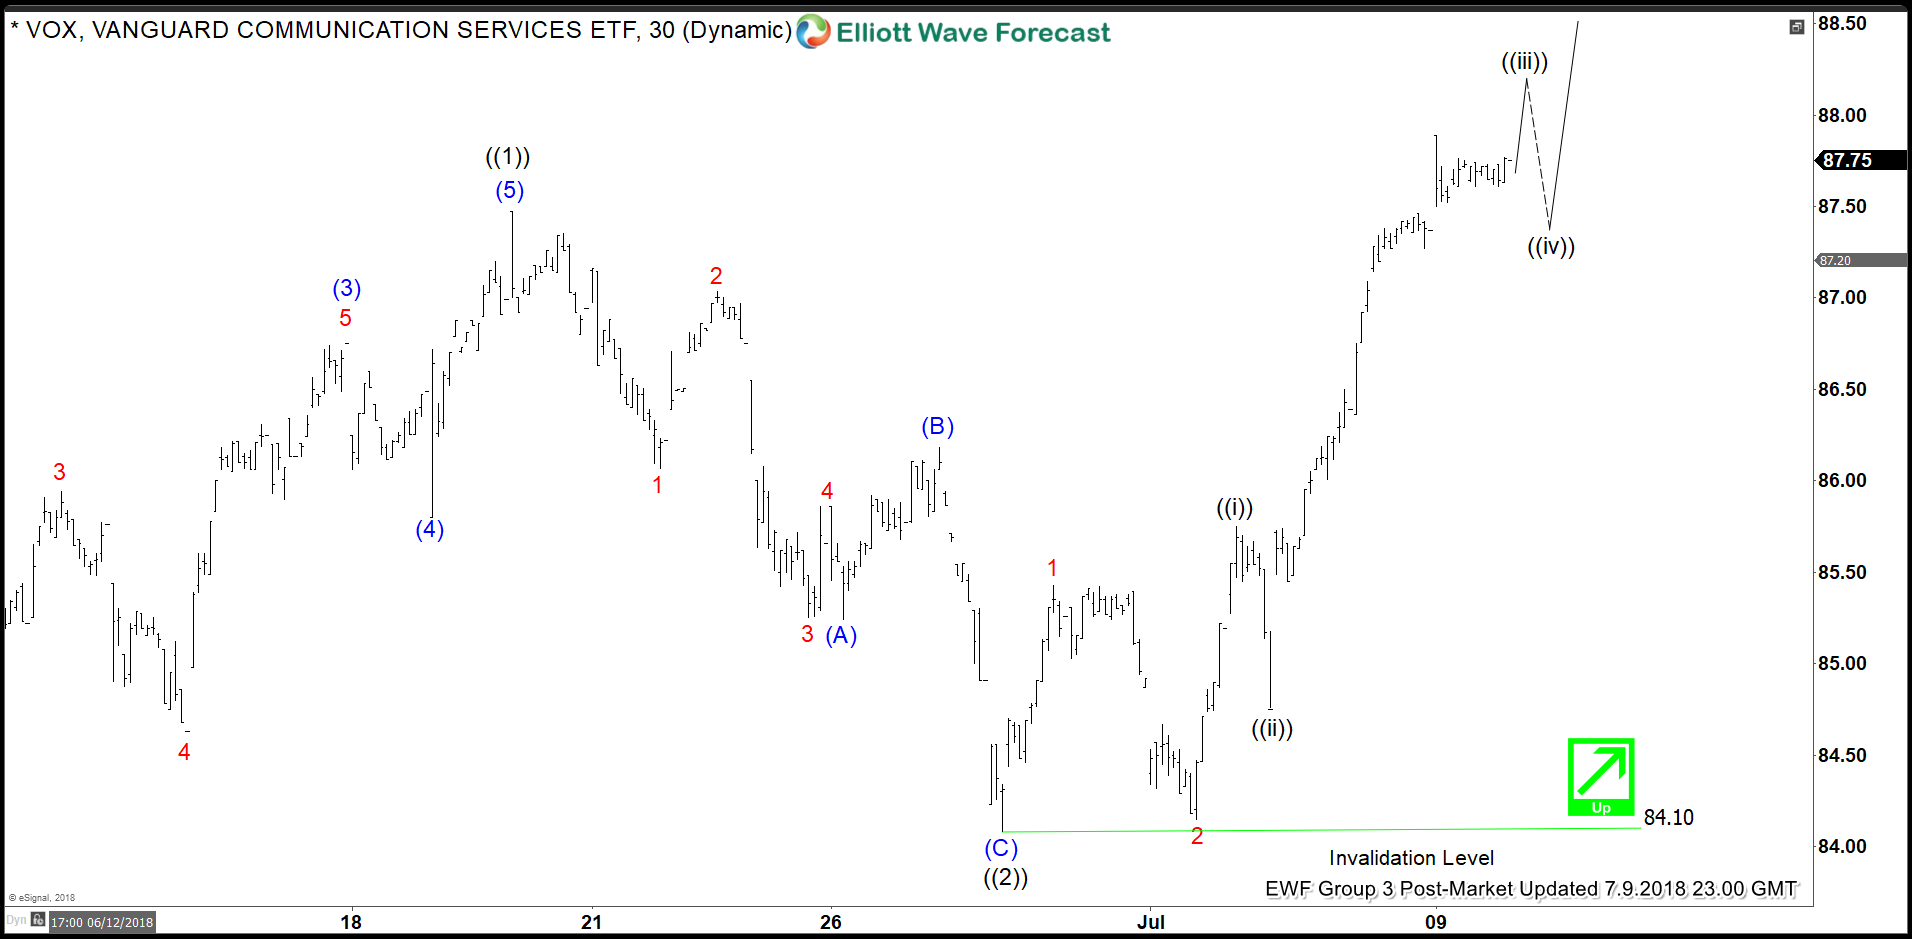
VOX Elliott Wave Analysis: Started Another Extension Higher
Read MoreVOX ETF short-term Elliott wave analysis suggests that the rally to $87.38 high ended primary wave ((1)) as an impulse with extension. Down from there, the pullback to $84.10 low ended primary wave ((2)). The internals of that pullback unfolded as Elliott wave zigzag correction where intermediate wave (A) ended in 5 swings at $85.24. Intermediate […]