
-
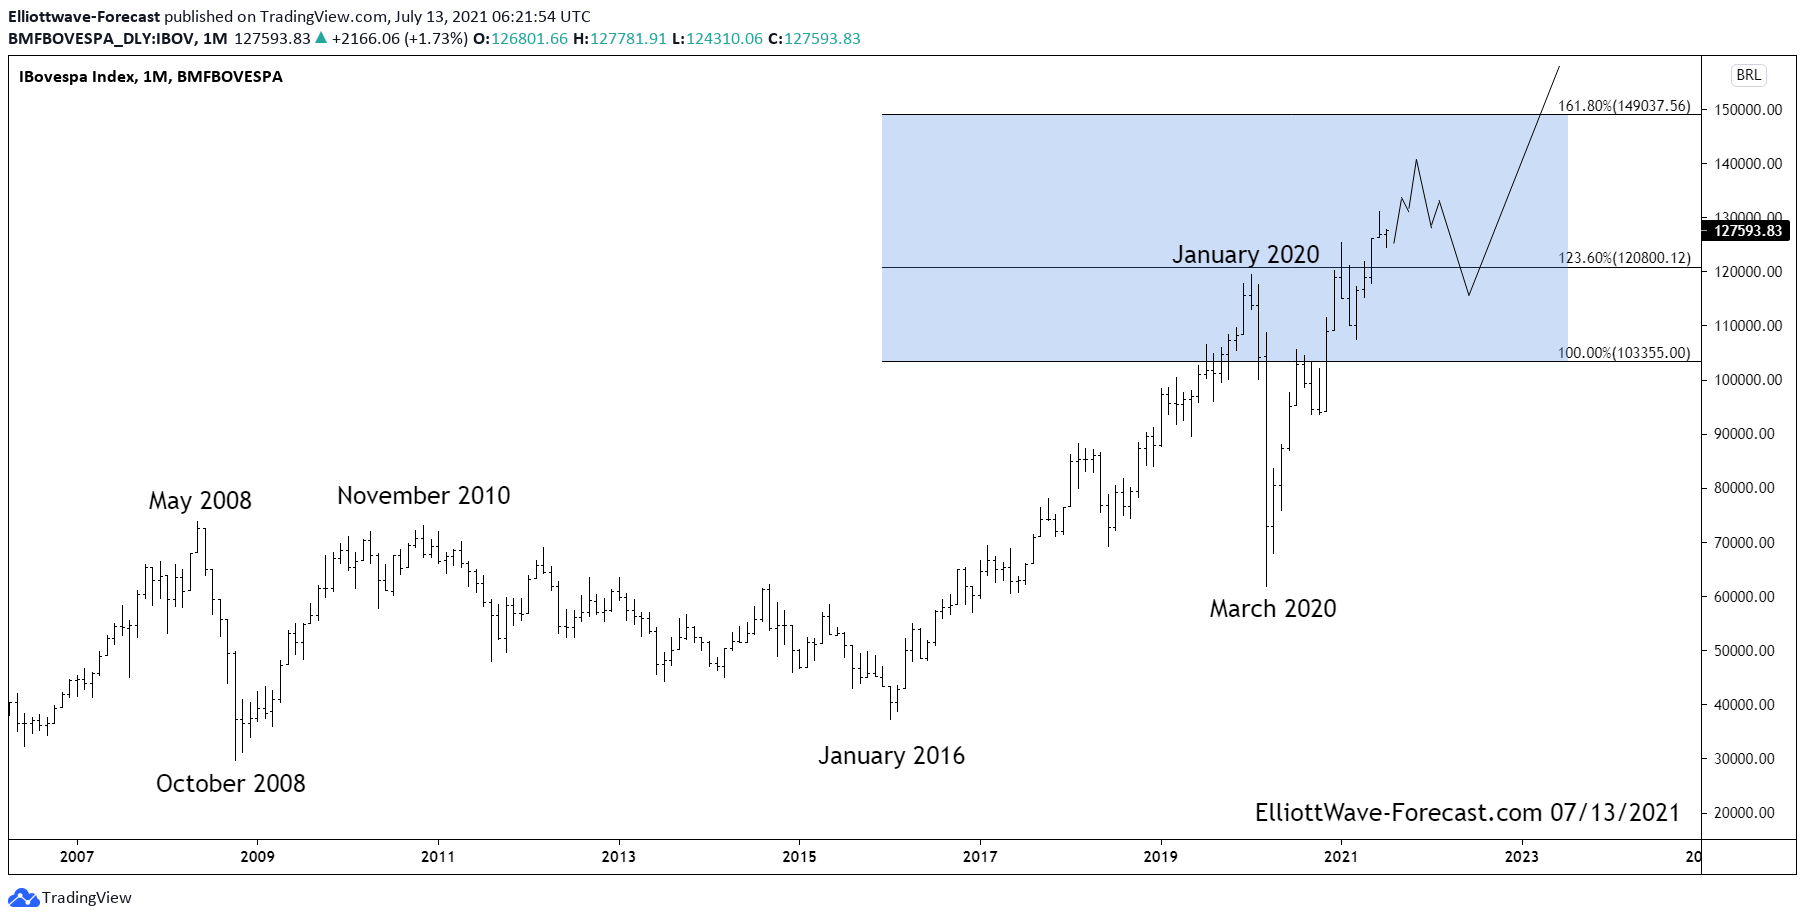
The Brazilian Bovespa Index Long Term Bullish Trend and Cycles
Read MoreThe Brazilian Bovespa Index Long Term Bullish Trend and Cycles The Bovespa Index has been trending higher with other world indices. Since inception the cycles have shown a bullish trend. In early years not seen on this chart it rallied with other world indices trending higher into the May 2008 highs. It then corrected the whole bullish […]
-
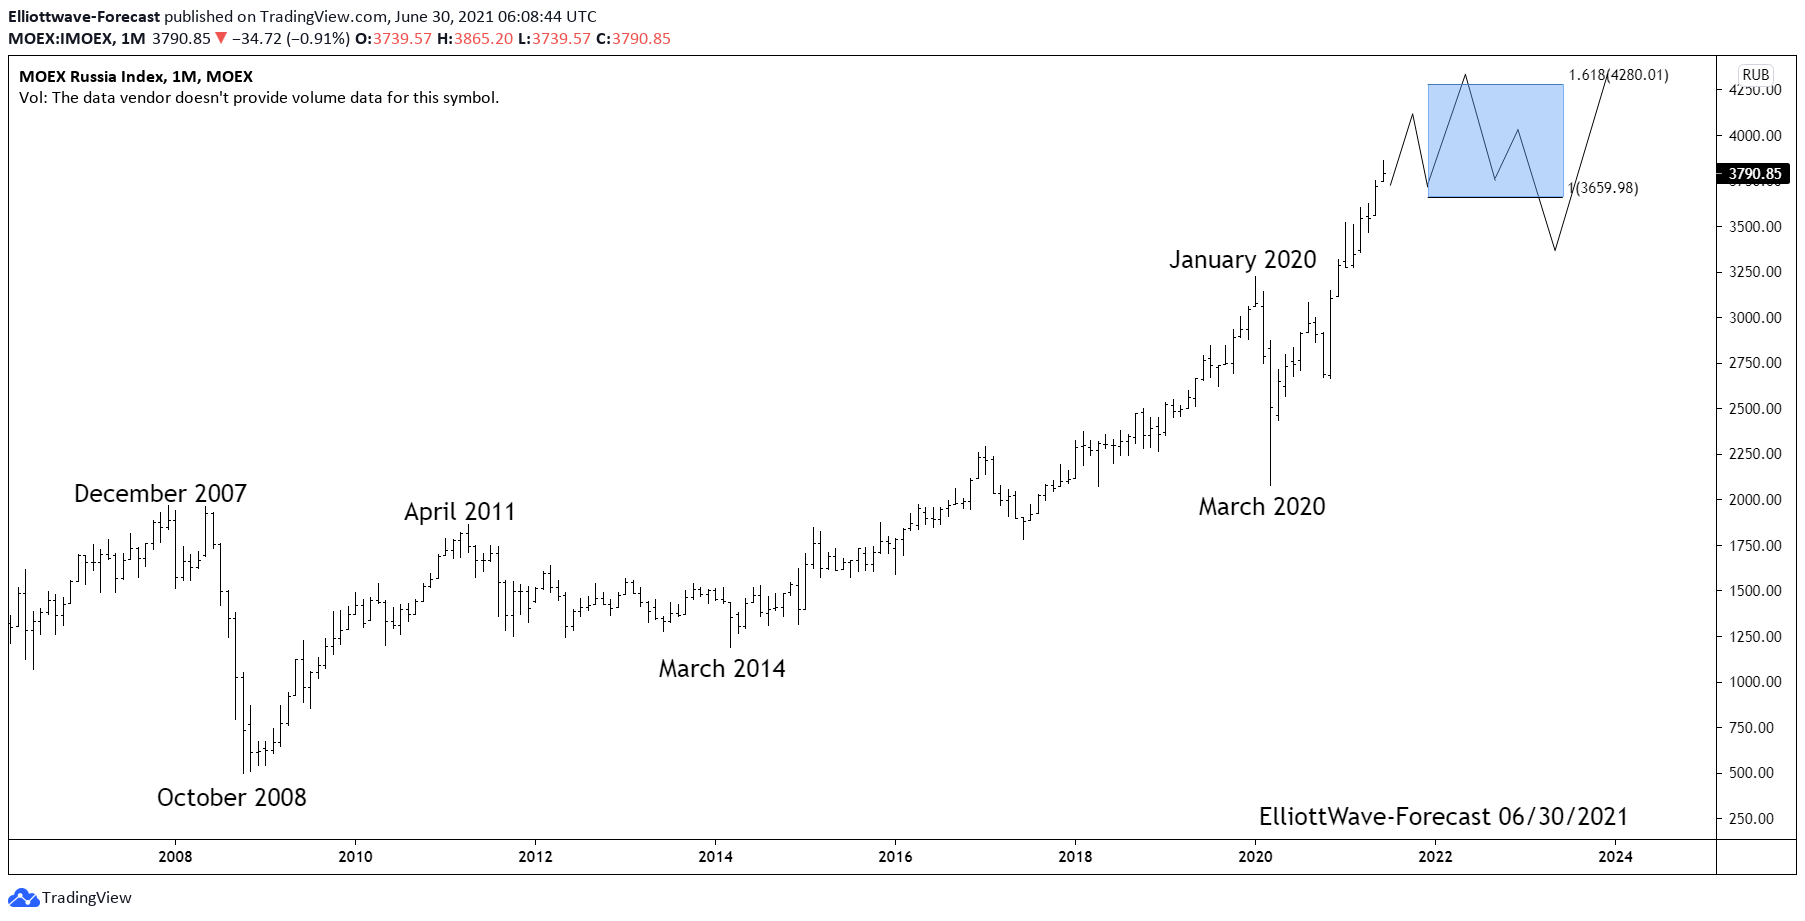
MOEX Russian Index Bull Trend and Longer Term Cycles
Read MoreMOEX Russian Index Bull Trend and Longer Term Cycles The MOEX Russian index has trended higher with other world indices since inception. The index remained in a long term bullish trend cycle into the December 2007 highs. It made a sharp correction lower in 2008 that lasted until October 2008 similar to other world indices. […]
-
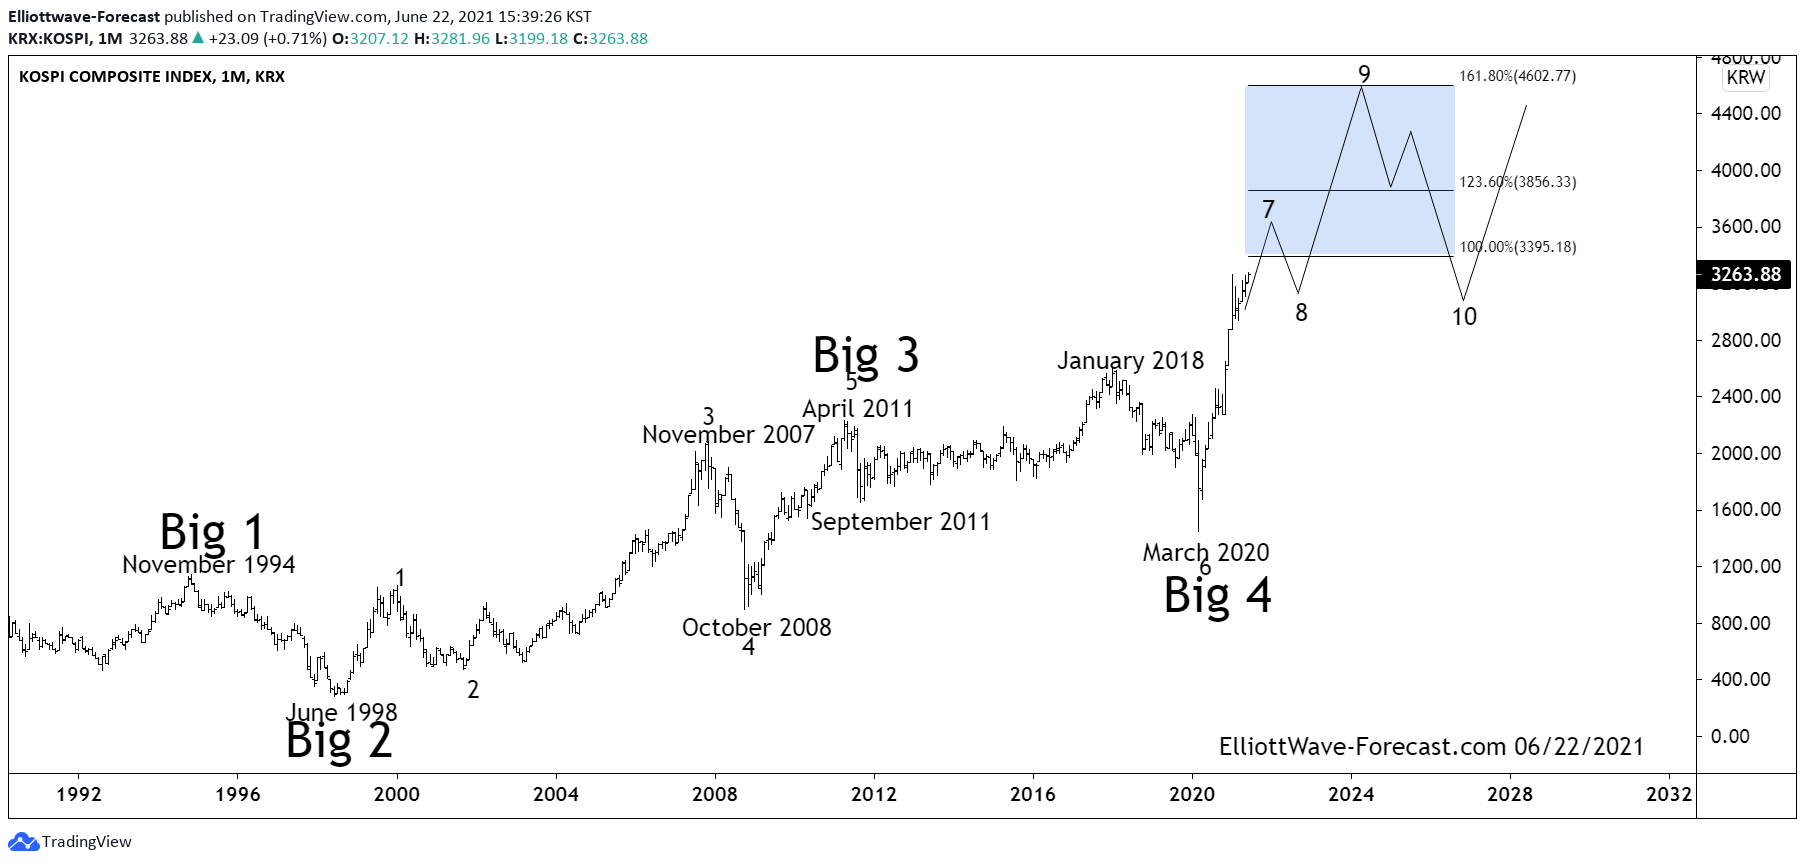
Kospi Longer Term Swing Count & Bullish Sequence
Read MoreKospi Longer Term Swing Count & Bullish Sequence The KOSPI Index in the long term has been trending higher with other world indices since inception in 1983. The index began with a base value set at 100 and trended higher until it ended that cycle in 1994. The index then corrected that cycle with the dip […]
-
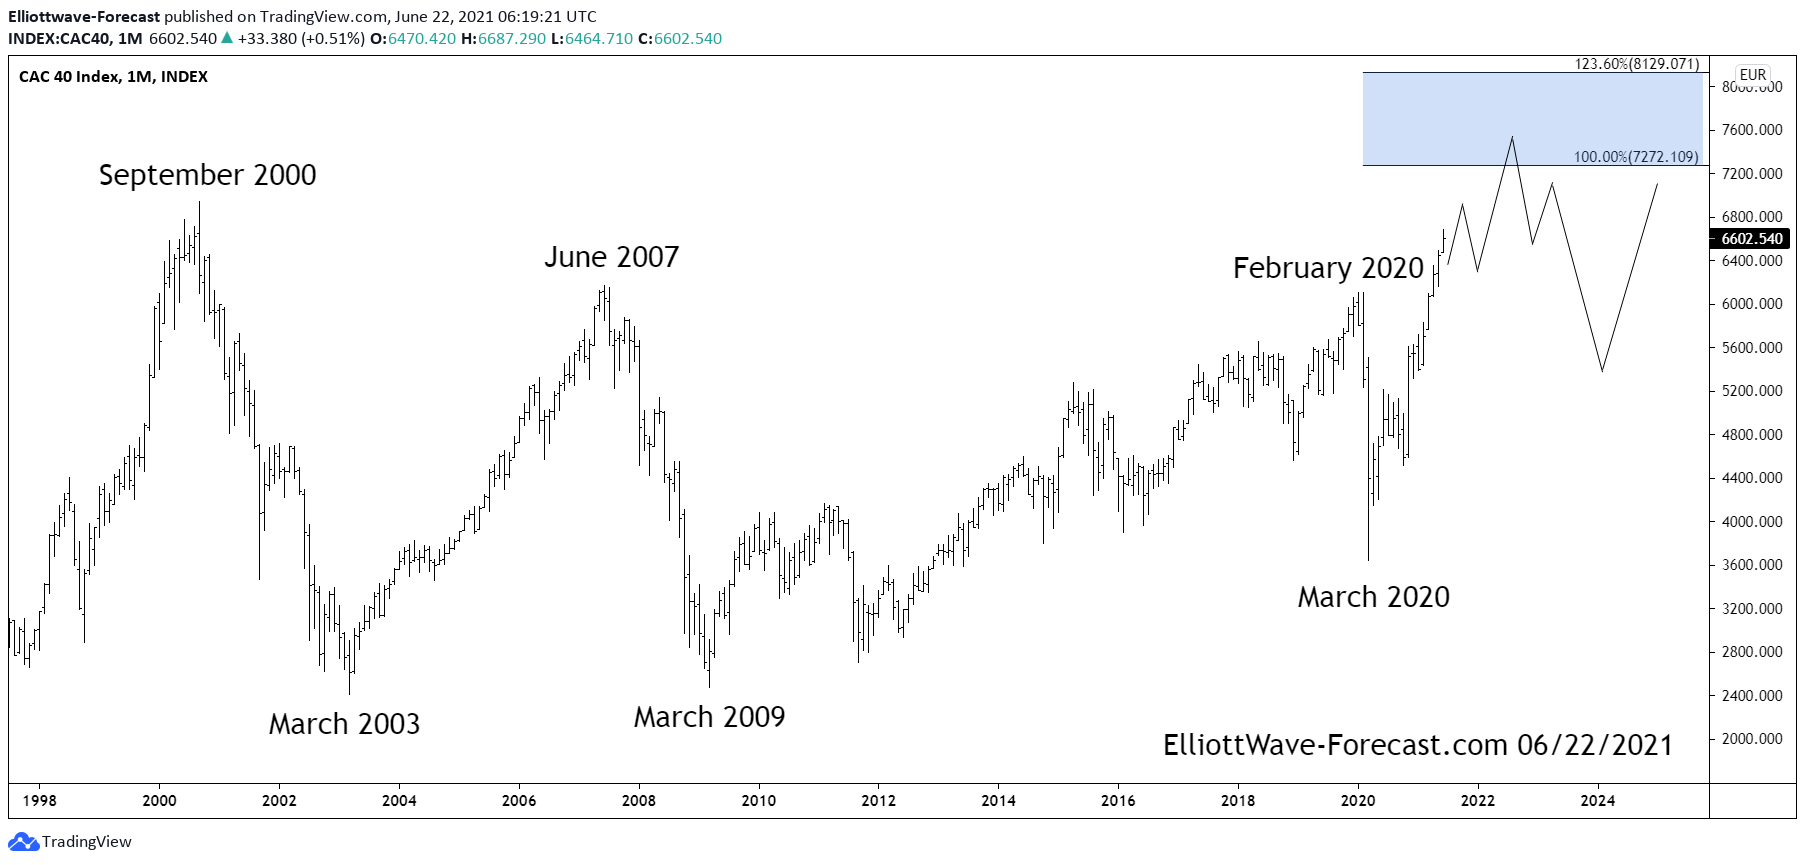
The $CAC40 Longer Term Bullish Cycles & Swings
Read MoreThe $CAC40 Longer Term Bullish Cycles & Swings Firstly the CAC 40 index has been trending higher with other world indices where in September 2000 it put in an all time high. From there it followed the rest of the world indices lower into the March 2003 lows which was a larger degree pullback. From […]
-
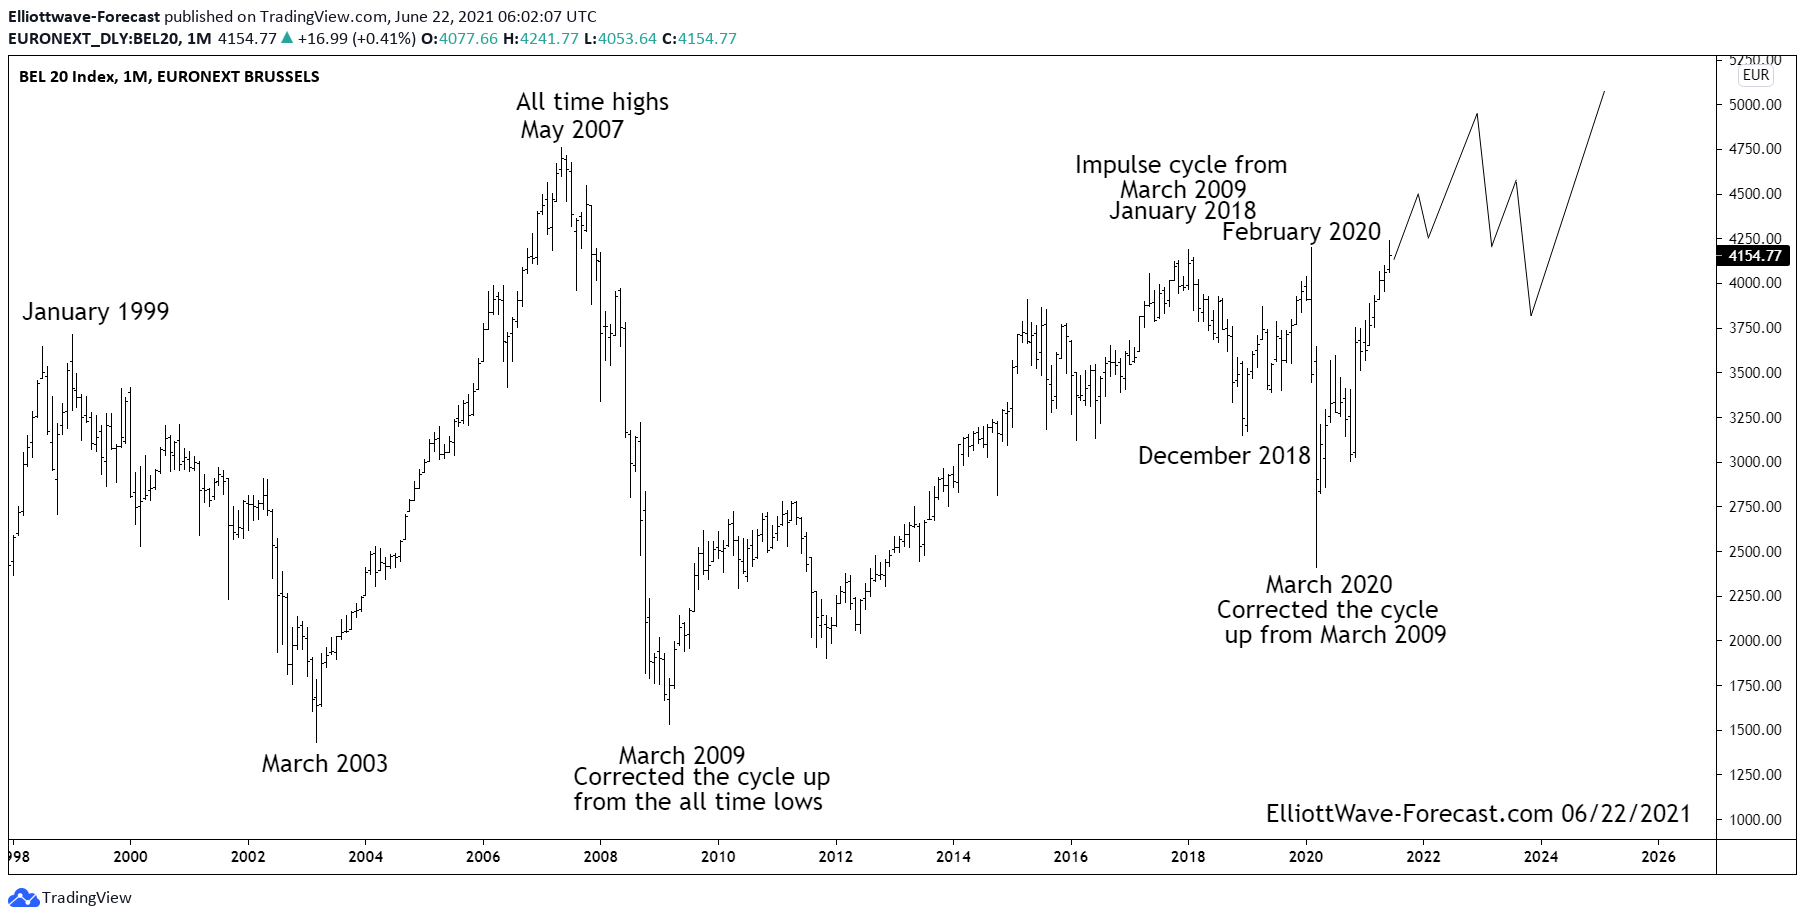
$BEL20 Index Longer Term Swings & Bullish Cycles
Read More$BEL20 Index Longer Term Swings & Bullish Cycles Firstly the BEL20 Index has trended higher with other world indices since the benchmark was established. The index remained in a long term bullish trend cycle into the May 2007 highs. From there it made a sharp correction lower that lasted until March 2009 similar to other world […]
-
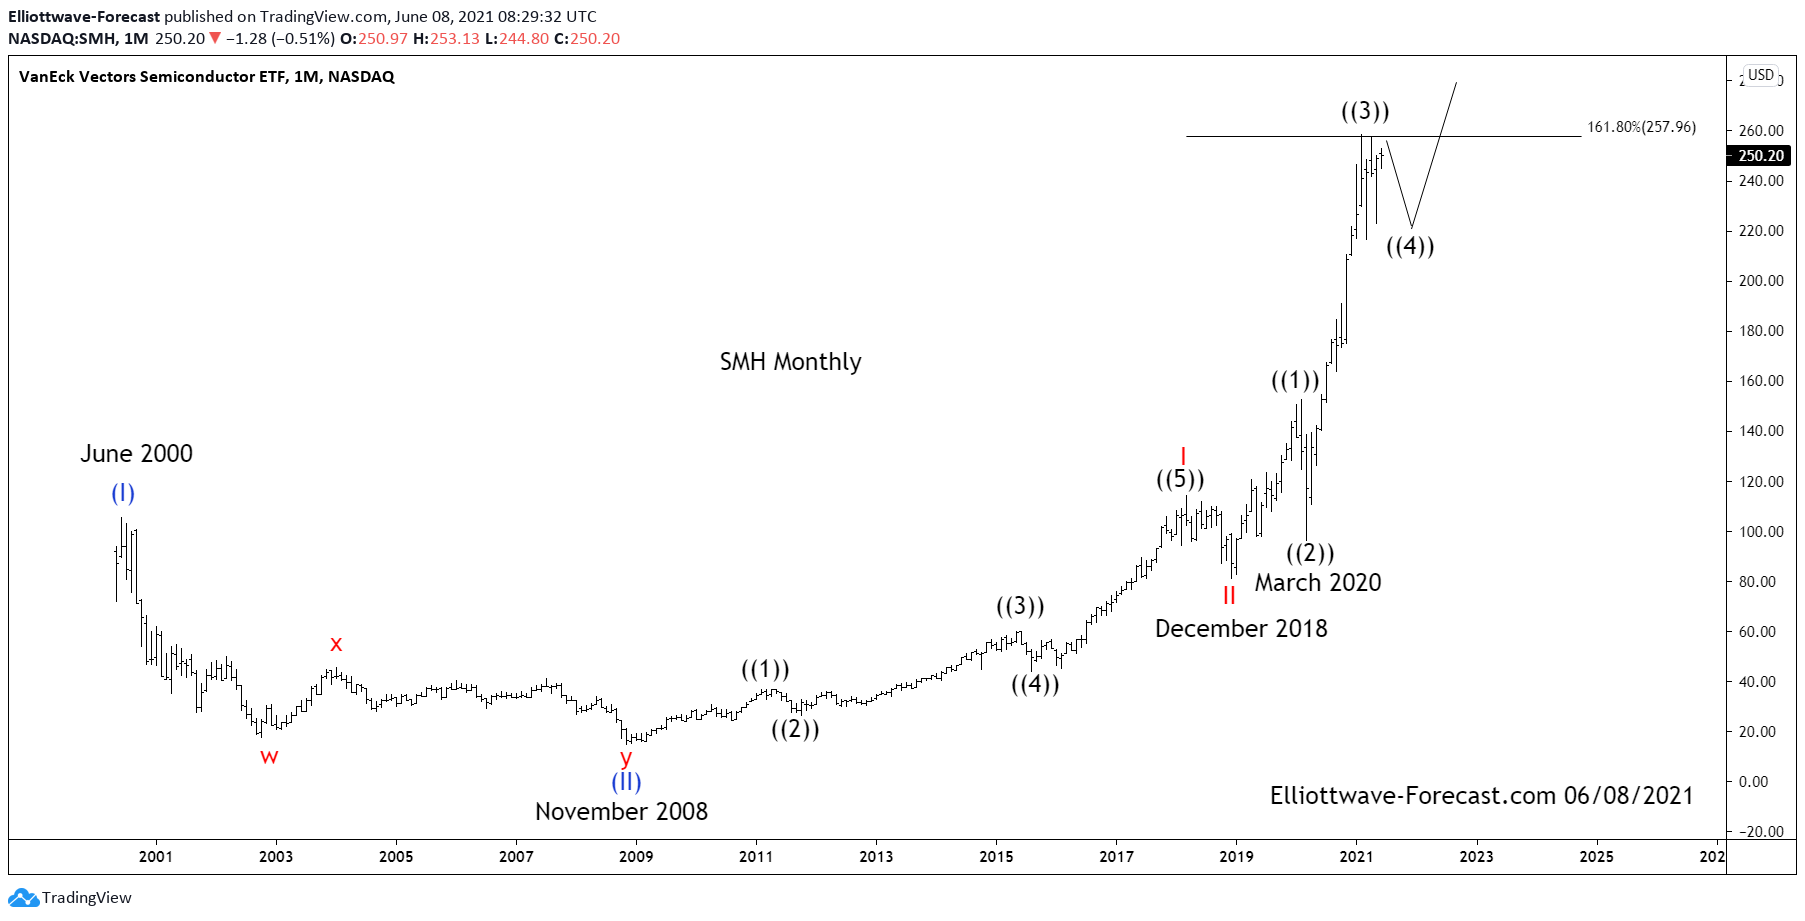
$SMH Semiconductors Elliott Wave & Longer term Cycles
Read More$SMH Semiconductors Elliott Wave & Longer term Cycles Firstly as seen on the monthly chart shown below. There is data back to May 2000 in the ETF fund. Data suggests the fund made a low in November 2008. This low has not been taken out in price. The cycles in this instrument tends to reflect the […]