
-
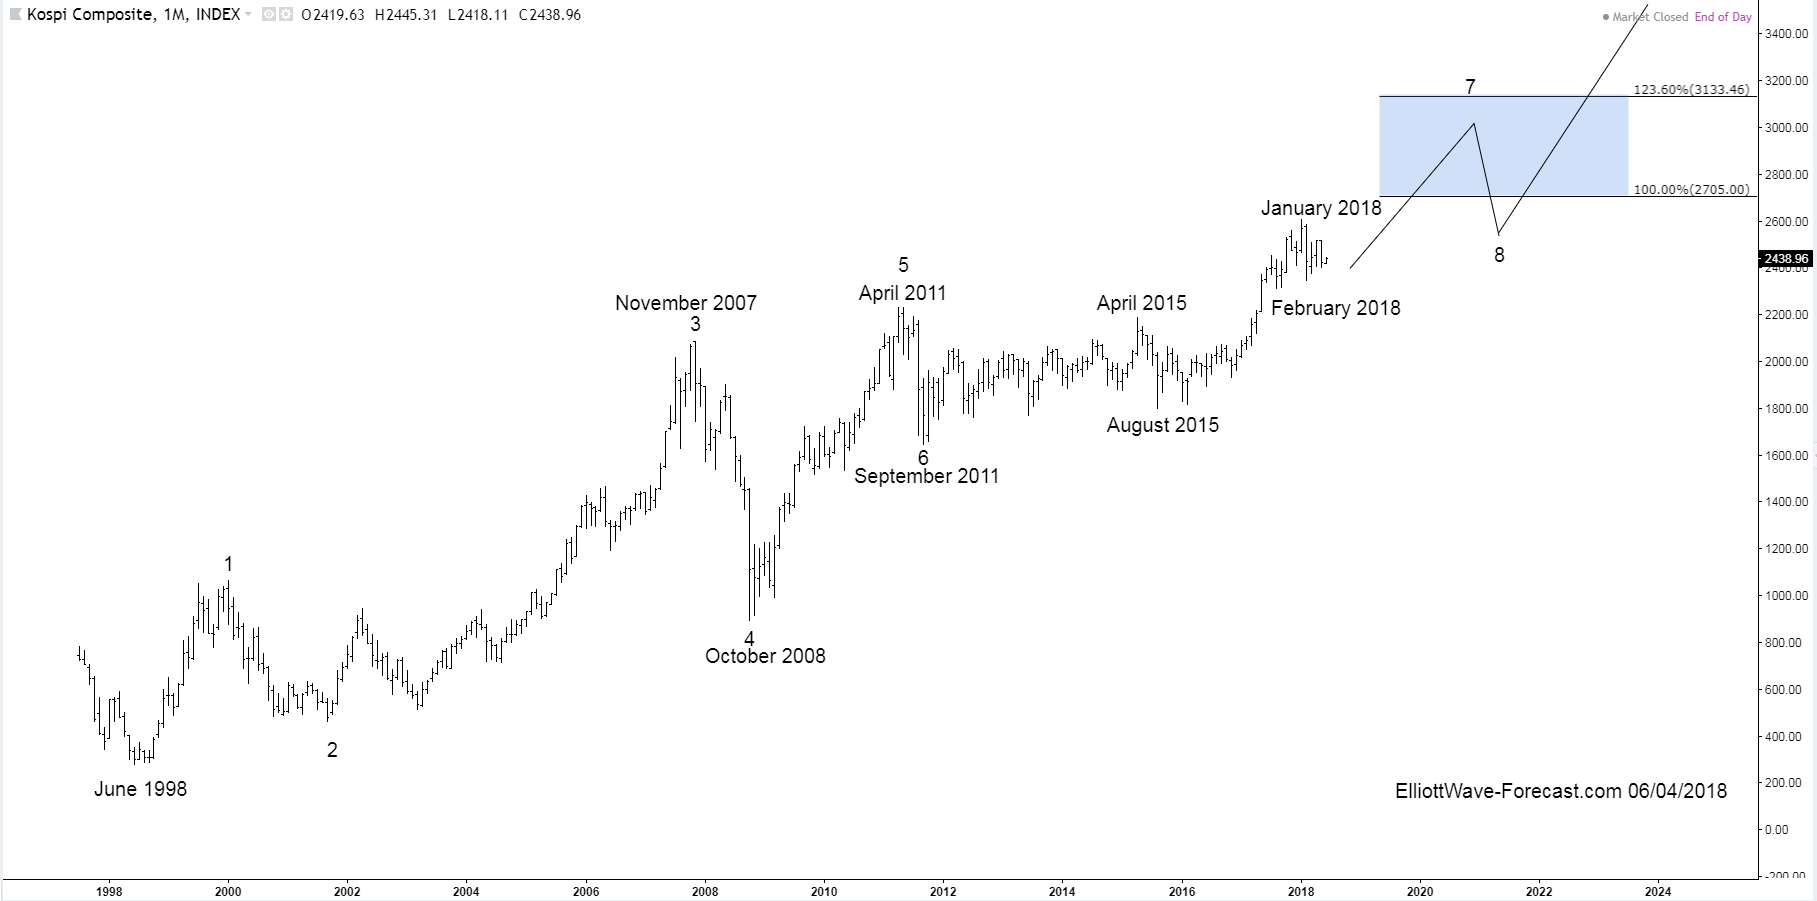
KOSPI Index Long Term Bullish Cycles
Read MoreFirstly the KOSPI Index in the long term has been trending higher with other world indices since inception in 1983. The index began with a base value set at 100 and trended higher until it ended that cycle in 1994. The index then corrected that cycle with the dip into 1998 lows during the Asian Financial […]
-
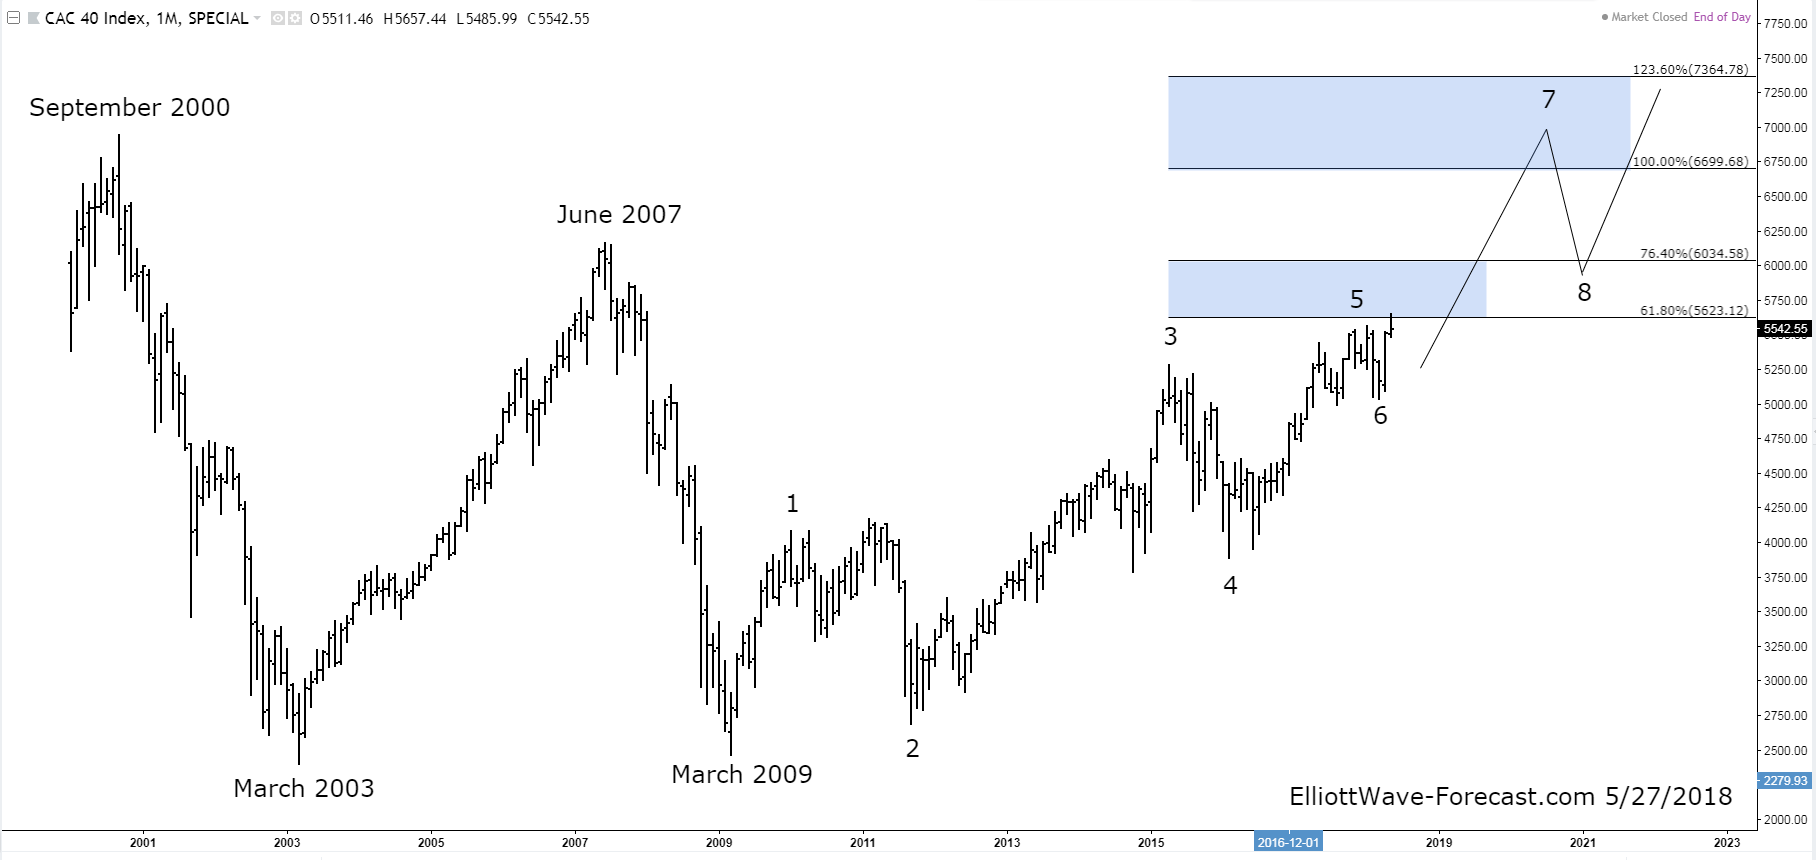
The CAC 40 Index Long Term Bullish Cycles
Read MoreThe CAC 40 Index Long Term Bullish Cycles Firstly the CAC 40 index long term bullish cycles have been trending higher with other world indices. In September 2000 it put in an all time high. From there it followed the rest of the world indices lower into the March 2003 lows which was a larger […]
-
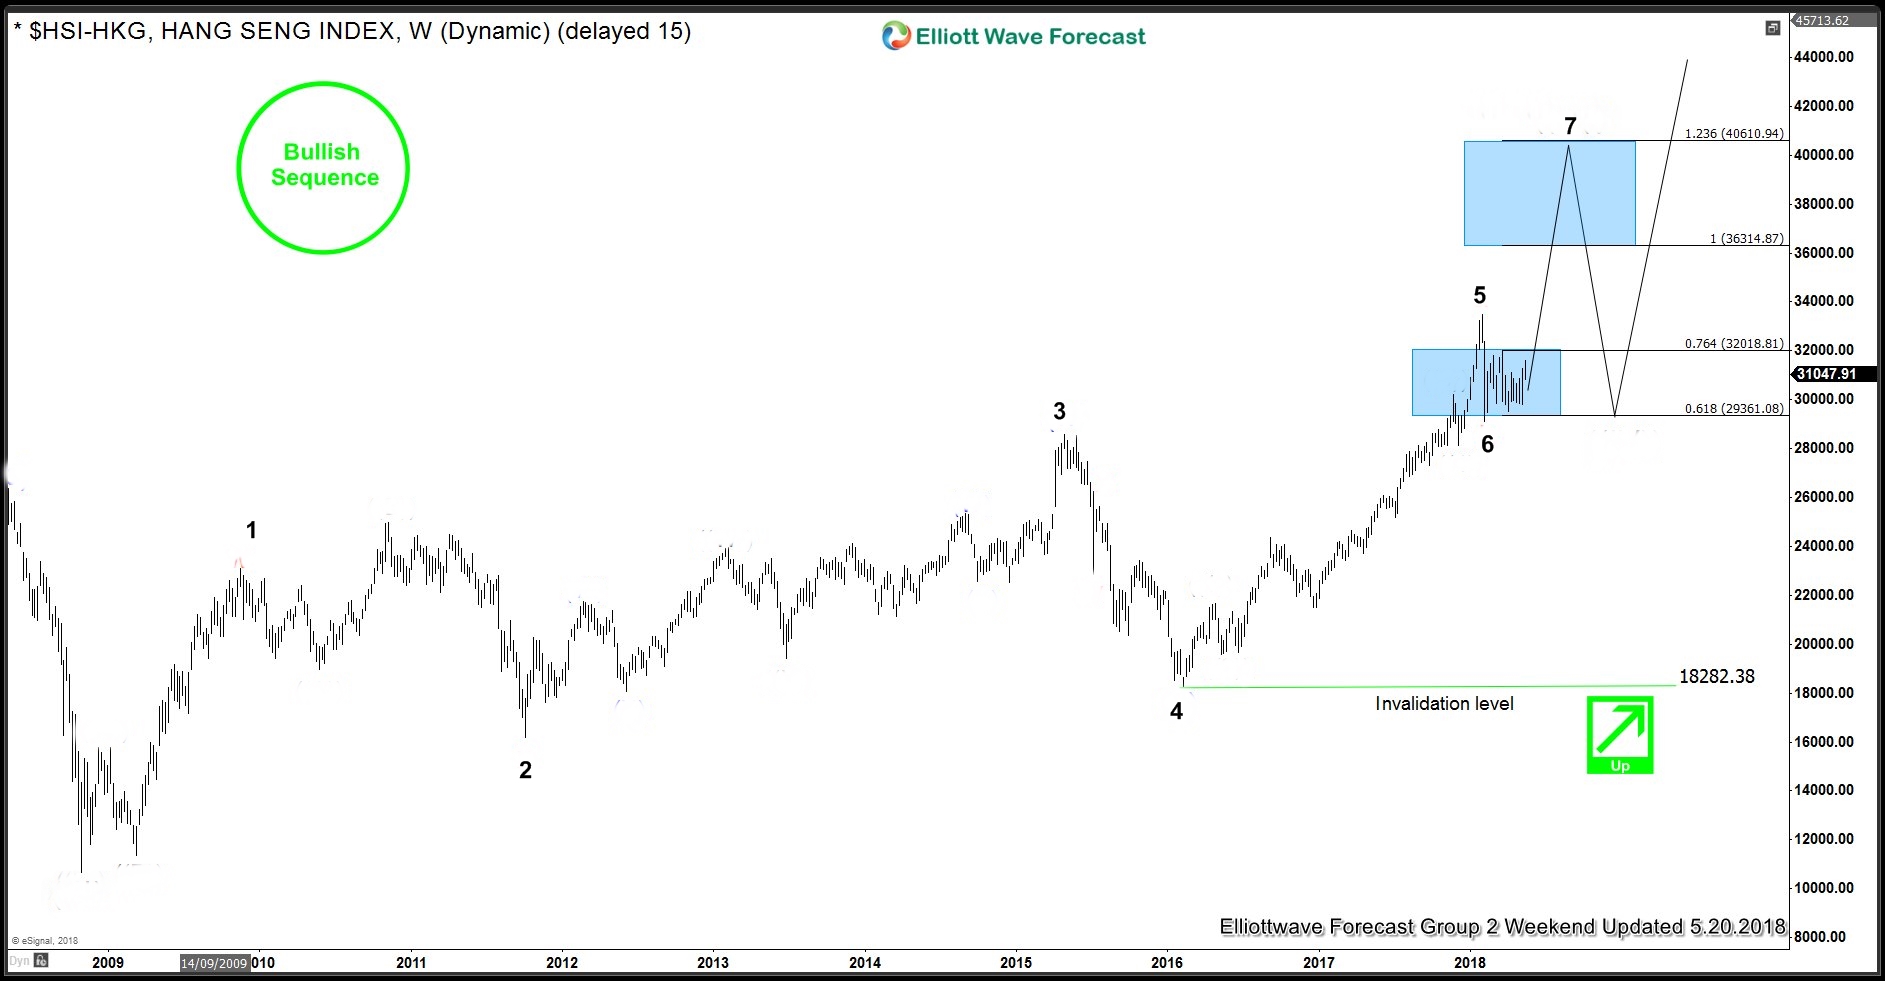
The Hang Seng Index Larger Bullish Cycles
Read MoreThe Hang Seng Index Larger Bullish Cycles. Firstly the Hang Seng index larger bullish cycles has been trending higher with other world indices. In April 2003 it put in a huge degree pullback low. From there the index rallied with other world indices again until October 2007. It then corrected the rally as did most […]
-
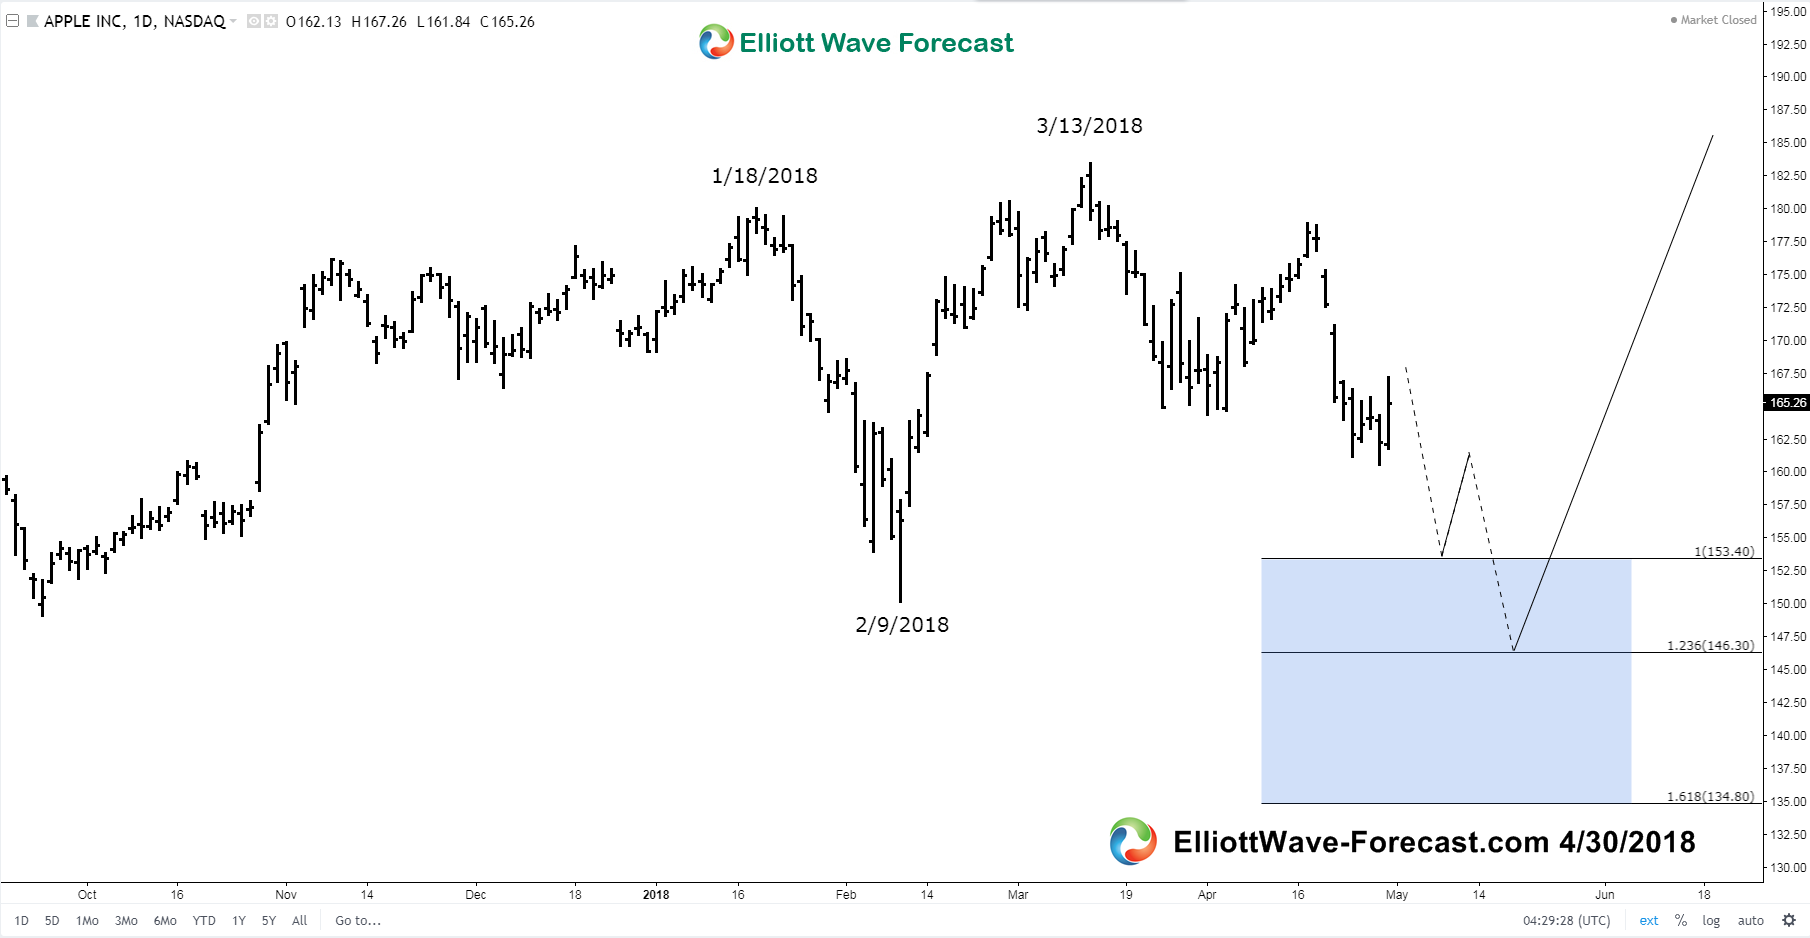
$AAPL Apple Expanded Flat from the 1/18/18 highs?
Read More$AAPL Apple Expanded Flat from the 1/18/18 highs? Is $AAPL Apple in an Expanded Flat from the 1/18/18 highs? Longer term on monthly and weekly charts it obviously appears that Apple remains in an uptrend. I will try to explain where the instrument can reach in the expanded flat from the 1/18/18 highs. I will […]
-
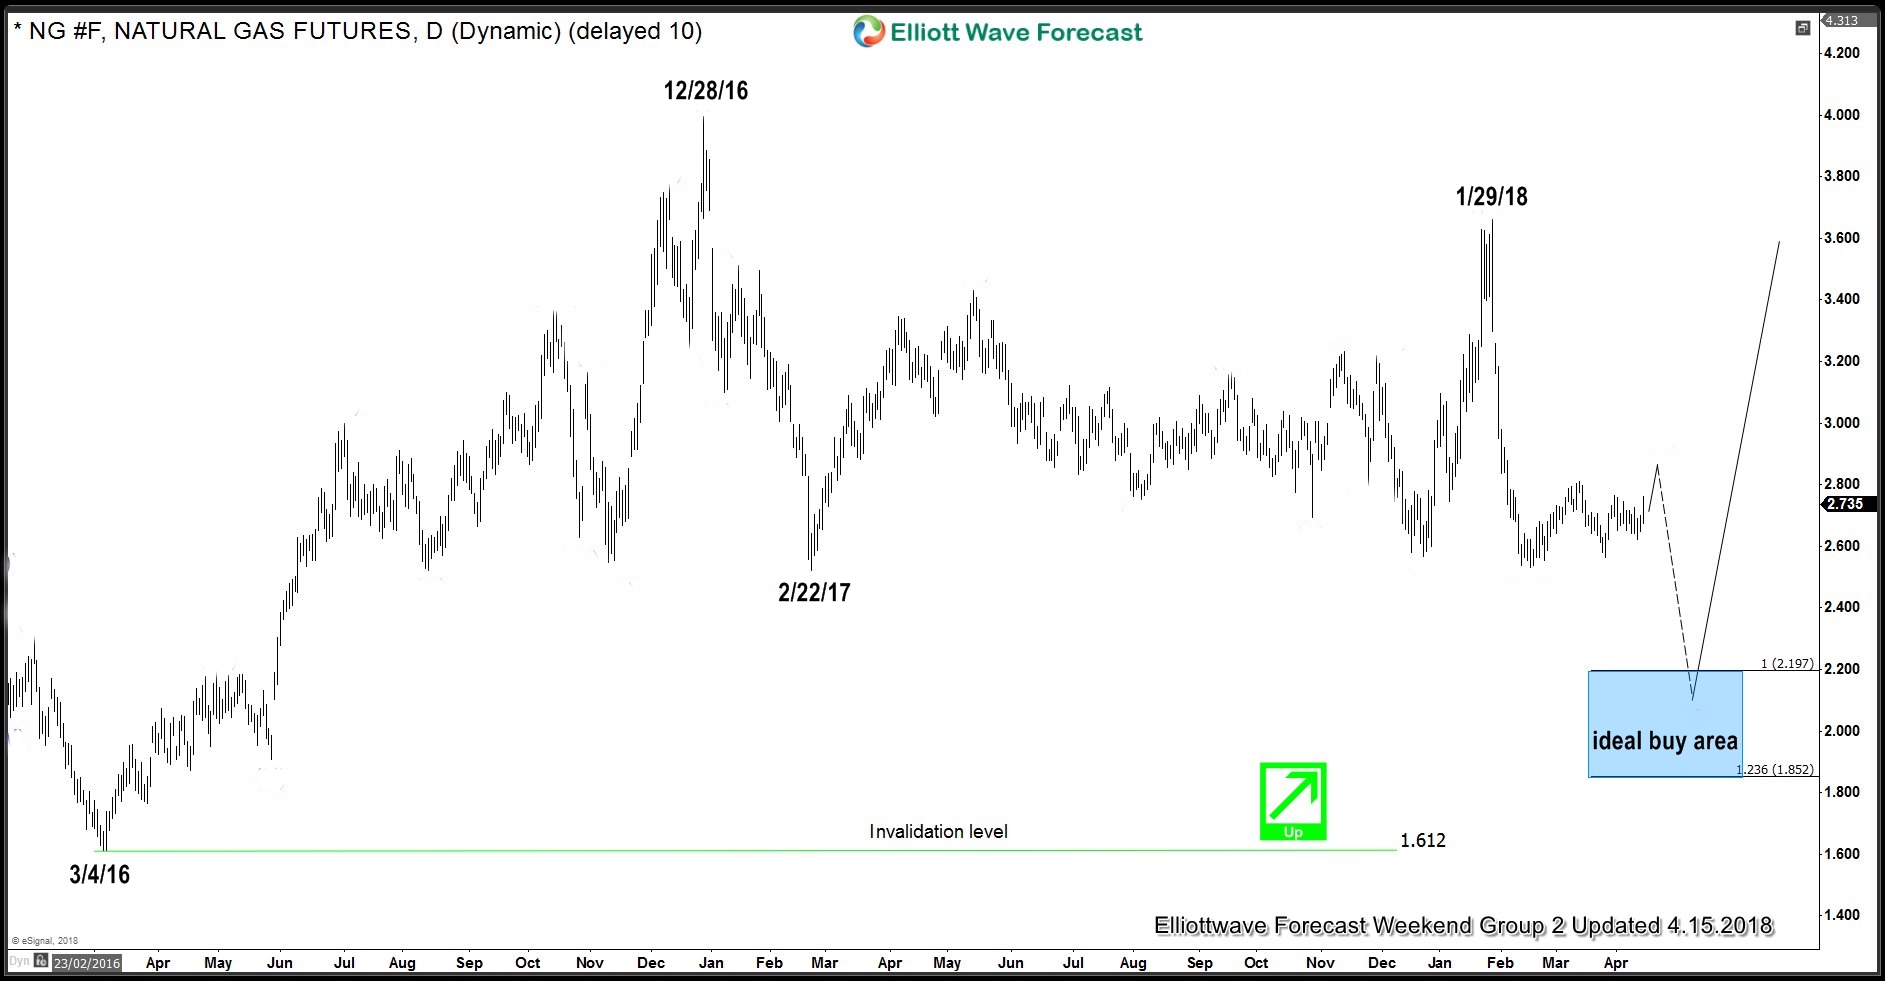
$NG_F Natural Gas Daily Corrective Cycle from 12/28/16
Read MoreAs seen in the daily graphic below you may notice it is absent of an Elliott Wave count. However the important dates with the swing highs and swing lows are highlighted that suggest the target area for buying that can be seen later. Currently Natural Gas is only showing a three swing move lower from […]
-
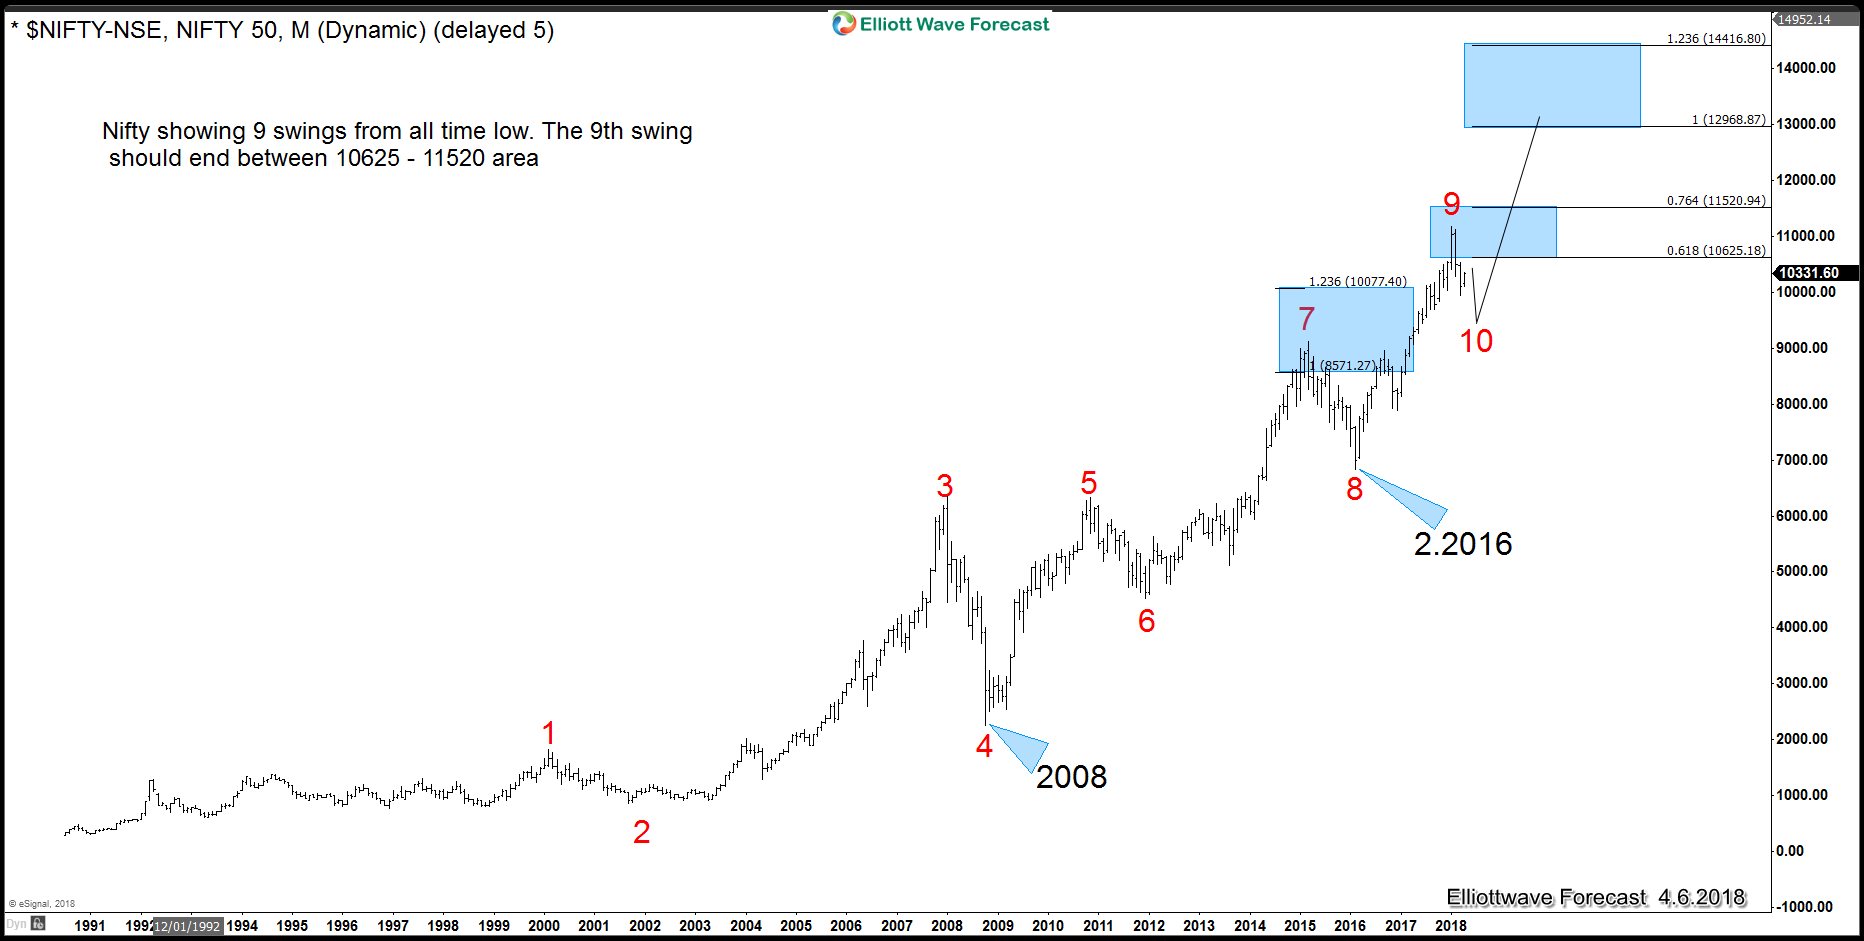
Nifty 50 Index Bullish Sequence to the All Time Highs
Read MoreThe Nifty 50 Index has a bullish sequence from the lows to the all time highs. The index currently shows nine swings up from the all time lows into the 2018 highs. It is now correcting the cycle higher from the February 2016 lows. This is noted on the chart with the red 8 label. In […]