
-
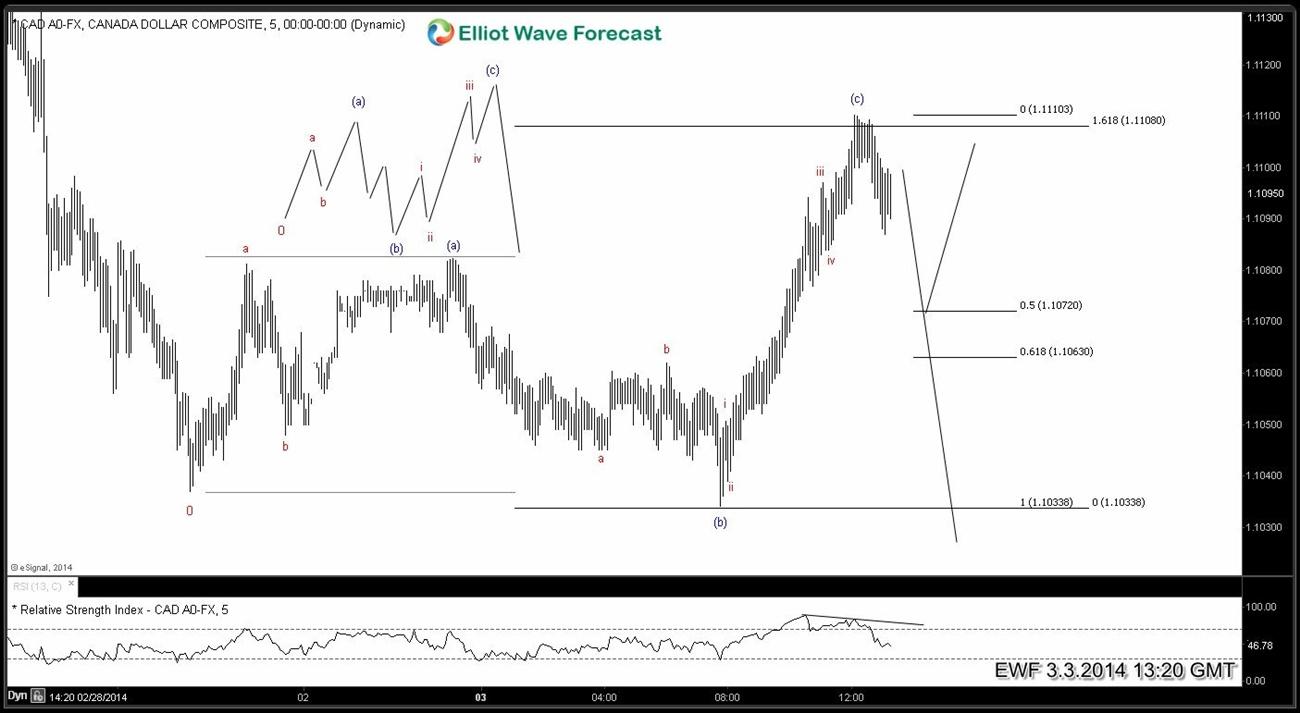
$USDCAD possible FLAT in 5 minute chart
Read MoreUSDCAD 5 min chart is showing a possible FLAT structure which is a 3-3-5 structure. We have 3 waves up from 1.1037 – 1.1082 and 3 waves down to 1.1033. After that we can count 5 waves up to 1.1110 level with divergence in RSI. As far as RSI divergence remains intact and price stays […]
-
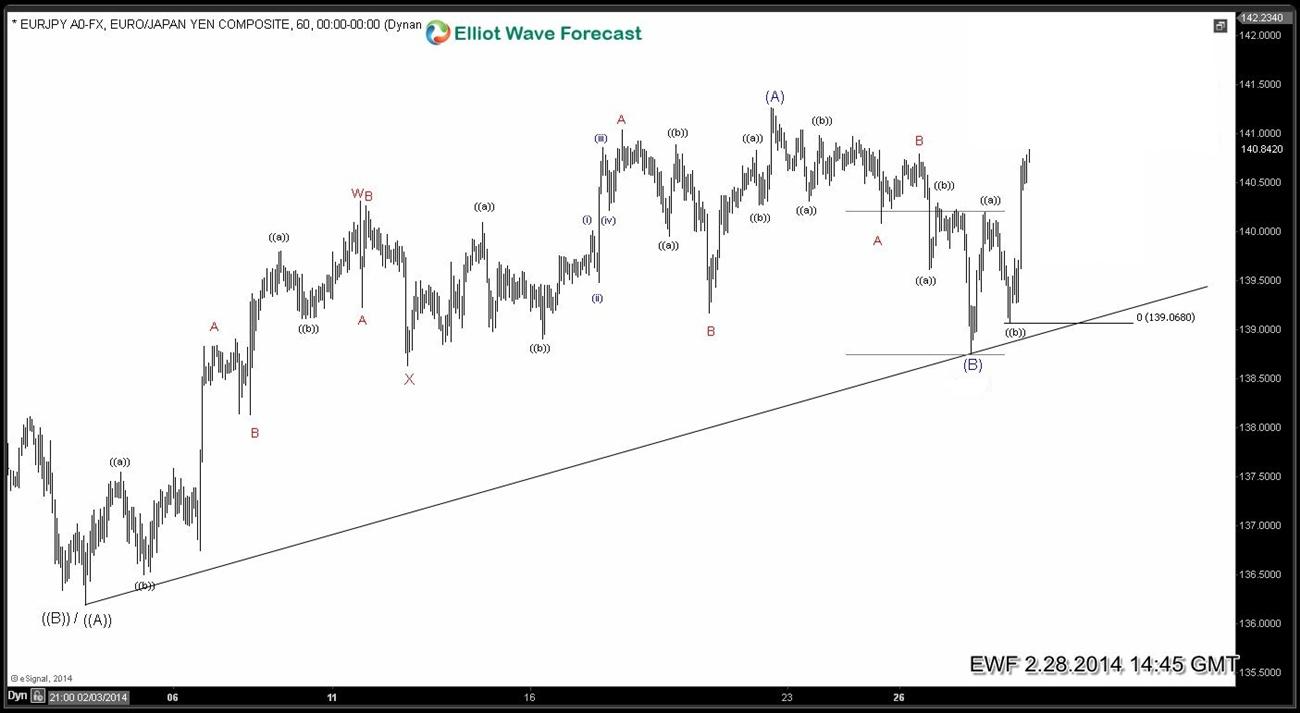
$EURJPY finds buyers on the dip
Read MoreEURJPY dropped hard on 2.27.2014 but members knew it was a great buying opportunity. Let’s take a look at some charts from members area before the drop, what was expected afterward and what actually happenend
-
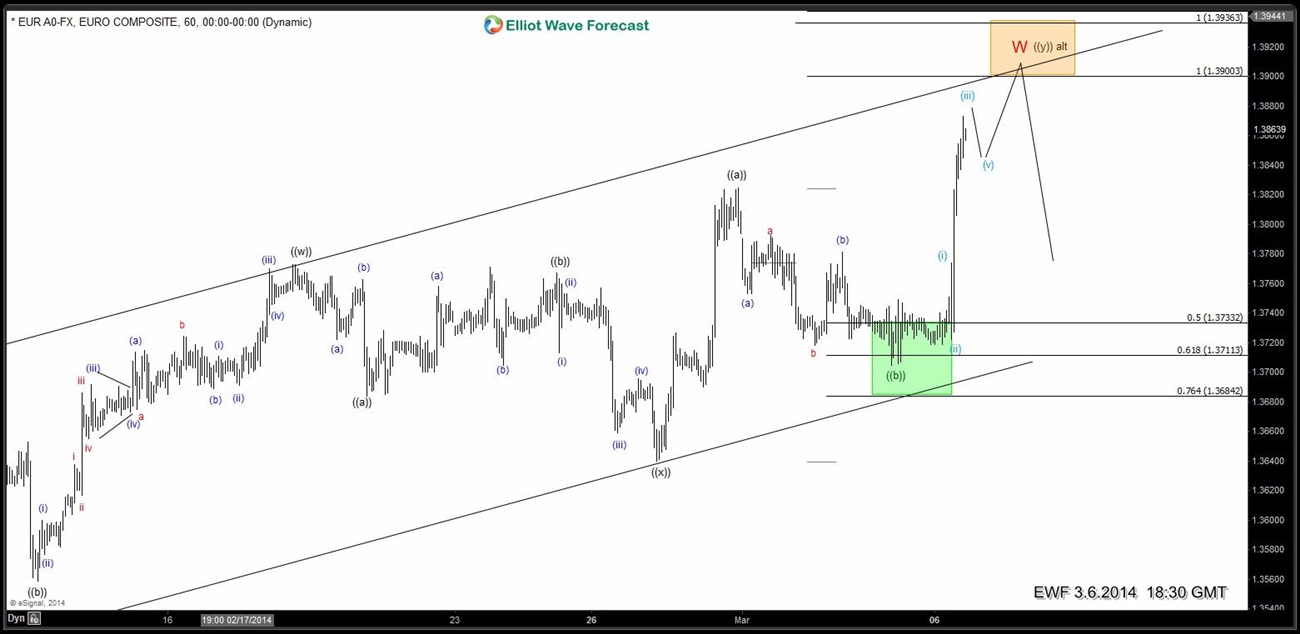
$EURUSD navigating the swings
Read MoreEURUSD spent a lot of time consolidating between 1.3773 – 1.3683 range before finally breaking lower and rallying to new highs. Let’s take a look at some charts from members area to see how it all unfolded
-
$HG_F (Copper) 1 Hour Elliott Wave Analysis (updated)
Read MoreWave B high is proposed to be in place at 3.32. Metal completed wave (( b)) & is currently trading lower in wave (( c )) of ((w)) which is expected to end in the orange zone which lies between 3.169 – 3.191. From here expect metal to recovery in a corrective fashion and resume […]
-
$HG_F (Copper) 1 Hour Elliott Wave Analysis
Read MoreWave B high is proposed to be in place at 3.32. Triangle consolidation broke lower as expected, expect a test of 3.209 – 3.225 area to produce a corrective (( b )) wave bounce and lower again.
-
$CL_F (Oil) 1 Hour Elliott Wave Analysis
Read MorePreferred view suggests wave B completed 99.40 and rally from this level is taking the form of impulse. Wave (( i )) was a leading diagonal which ended at 101.13, wave ((ii)) completed with a dip to 100.57 and wave (( iii )) was 1.618 ext of (( i )) which ended at 103.34. We […]