-

$GC_F (Gold) Elliott Wave Analysis 3.25.2014
Read MoreGold preferred Elliott wave count is showing a triple corrective structure down from 1392 peak when 1342 was 2nd wave (( x )). As channel resistance caps, Gold has scope to drop as low as 1296 and may be as low as 1282 to complete the cycle. 1262 – 1287 is 4 hour inflection zone […]
-
$XAGUSD (Silver) Elliott Wave Analysis 3.25.2014
Read MorePreferred Elliott wave view is that Silver has ended a cycle at 22.17 and 7 swings lower suggest wave “W” is nearing completion (another low to 19.53 – 19.76 is still expected) Soon, expect a recovery in wave “X” which can reach as high as 50 – 61.8 fib of the drop from 22.17 peak […]
-
$GC_F (Gold) 1 Hour Elliott Wave Analysis
Read MorePreferred Elliott wave view suggests the yellow metal has ended a cycle and wave (( B )) high is in place @ 1392. Decline from 1392 is taking the form of a triple corrective structure and can test 1288 – 1298 to complete wave A. After that metal should see a recovery in wave B […]
-
$GBPCHF: Elliott Wave B in progress
Read MorePreferred Elliott wave view is that mid-term peak has formed at 1.5123, wave A completed @ 1.4464 and wave B in progress toward 1.4750 – 1.4792 area from where the decline should resume. Rally from 1.4463 – 1.4648 consisted of 7 swings and completed wave (( a )) of B. Pair has already tested 50% […]
-
$EURGBP Wave B in progress
Read MorePair has been trading lower after a test of 0.8400 which we believe completed wave A (cycle from 0.8153 low). Decline so far is in 3 waves so it’s a corrective decline just like the previous updates had been reflecting. Reaction off today’s low suggests wave (( a )) is in place and pair is […]
-

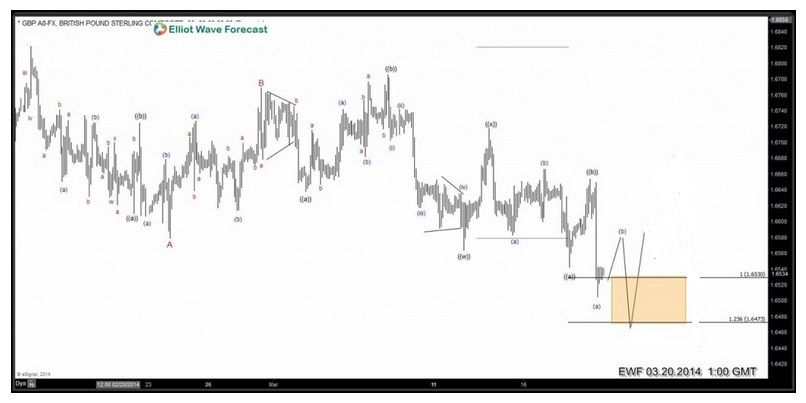
Tracking Cable: GBPUSD
Read MorePair has been trading lower for the last week or so. Let’s take a look at some charts from members area to see how NEW Elliott wave theory called the move lower in GBPUSD pair GBPUSD March 10/2014 (New York Update) GBPUSD March 12/2014 (Mid-day Update) GBPUSD March 13/2014 (London Update) GBPUSD […]