-

GBPUSD : Buy & Sell Patterns
Read MoreGBPUSD Bullish Scenario: A bullish pattern can be seen for another possible move higher but has yet to trigger buys at the BC 0.50% Fib. level. If looking to buy GBPUSD traders should be patient and wait for price to make a move lower towards the BC 0.50% Fib. retracement level at 1.2808. Waiting for price […]
-

NZDUSD : Wait for Pullback then Buy Again
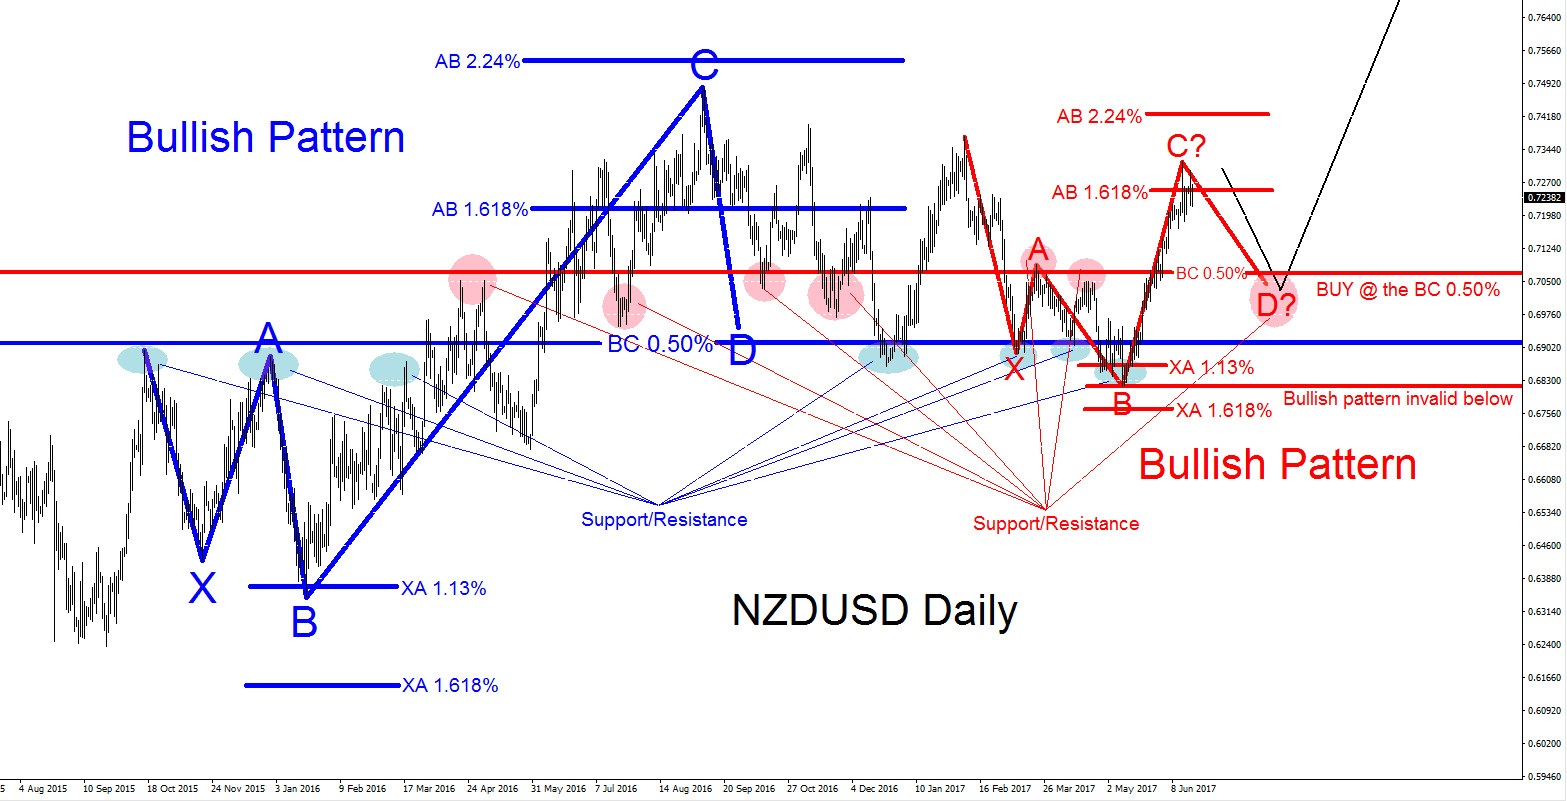
Read MoreNZDUSD is showing 2 bullish patterns on the daily chart so we are expecting for the pair to continue higher. A move lower will now give bulls a chance to push the pair higher. Below we will show the possible bullish scenarios where bulls can enter the market and catch the move higher. NZDUSD Daily Chart 2 […]
-

EURCAD : Sell the Bounce Bearish Pattern
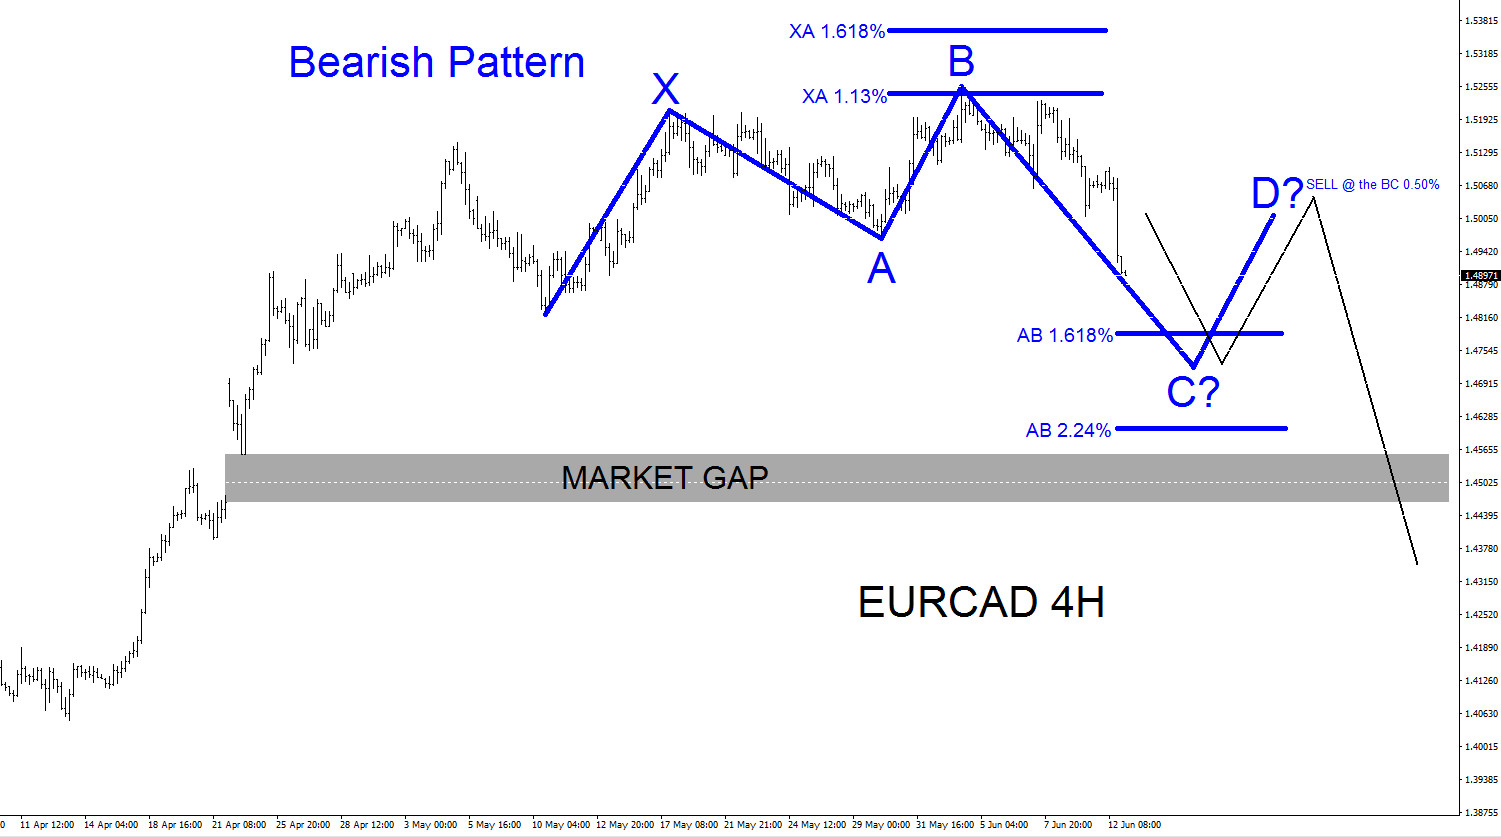
Read MoreToday’s price action confirms that a possible top has been formed at the June 2/2017 high and EURCAD can be on the way lower to close a market gap that formed on April 23/2017. The turn lower will now give bears a chance to push the pair lower. Below we will show a possible scenario/bearish pattern […]
-

AUDNZD Possible Bounce Higher?
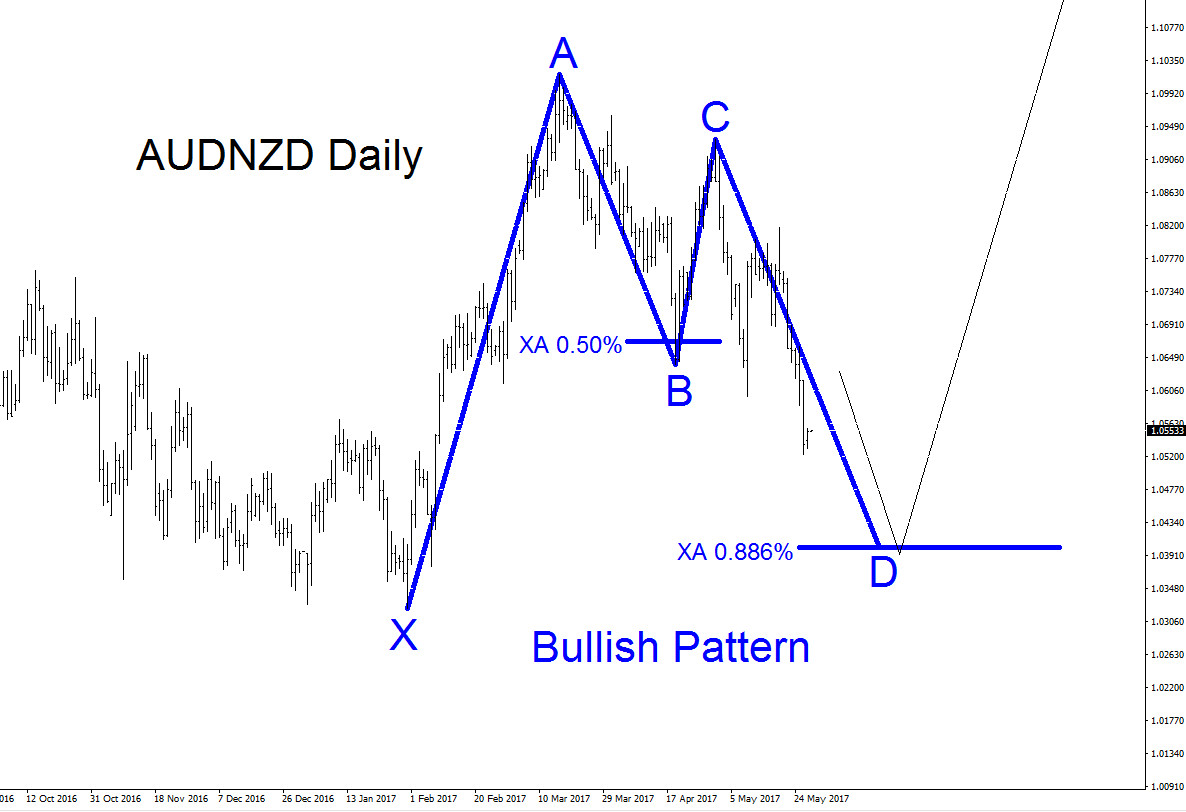
Read MoreAUDNZD since March 13/2017 has been moving lower. There are possible bullish patterns that can push the pair higher but traders need to see AUDNZD price action slow down and show possible signs that it wants to reverse and bounce higher. AUDNZD 4 hour Elliott Wave Analysis May 29/2017 : The pair can find support at […]
-

GBPNZD Short Term Bullish Patterns
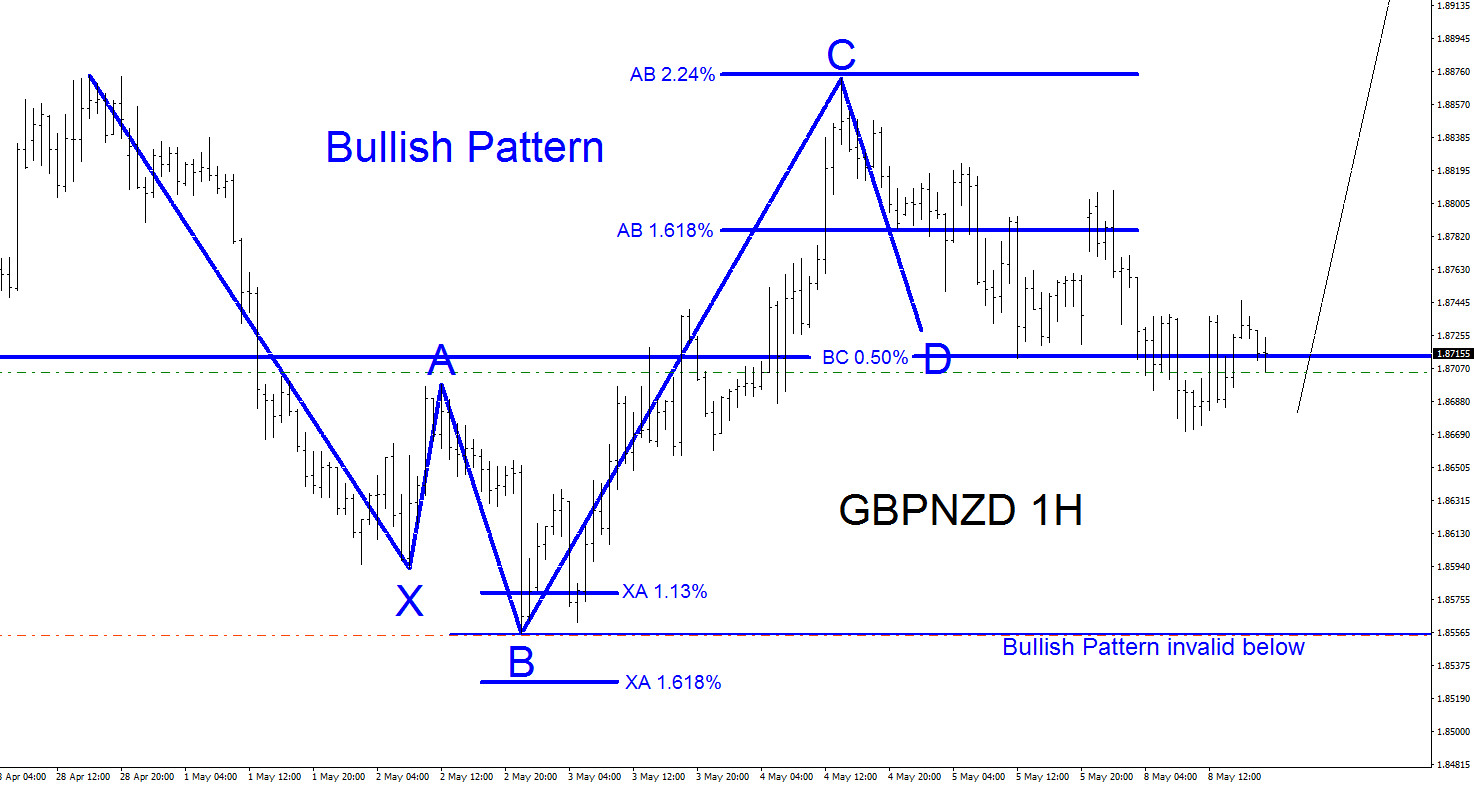
Read MoreGBPNZD on the Daily and 4 hour time frames has been pushing higher and is on a bullish trend. Shifting down to the 1 hour time frame we can see possible bullish scenarios where bullish patterns can offer support and push the pair higher. As long as GBPNZD stays above the May 2/2017 low (1.8555) […]
-

EURUSD Perfect Trade Higher April 23-25 2017
Read MoreEURUSD on April 23/2017 spiked higher at the open of the new trading week. A technical trader is never really concerned as to why the market spiked or dropped but more concerned in how to profit from the drastic market move. After the spike higher it became clear in which direction EURUSD wanted to take […]