
-
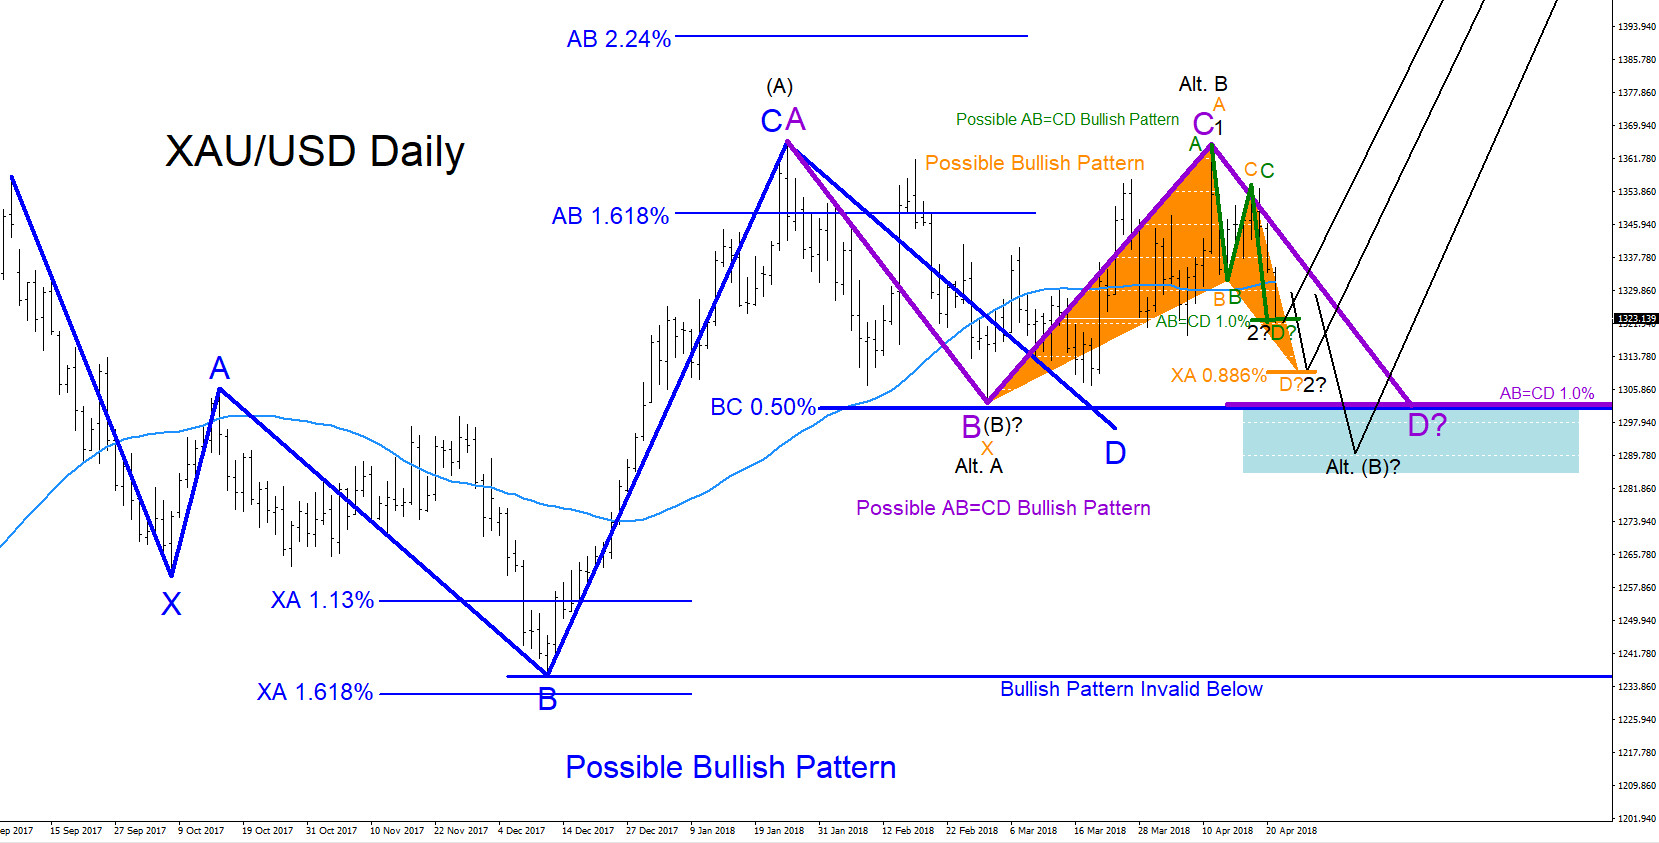
XAUUSD : Will Gold Rally Higher?
Read MoreXAUUSD (Gold) Technical Analysis 4.25.2018 XAUUSD (Gold) remains bullish as long as the December 12/2017 low remains untouched. On the Daily chart there are clear visible bullish patterns that can be seen. Bullish Elliott Wave counts can also add more reasons that a possible rally higher can be seen in the near future. In the […]
-
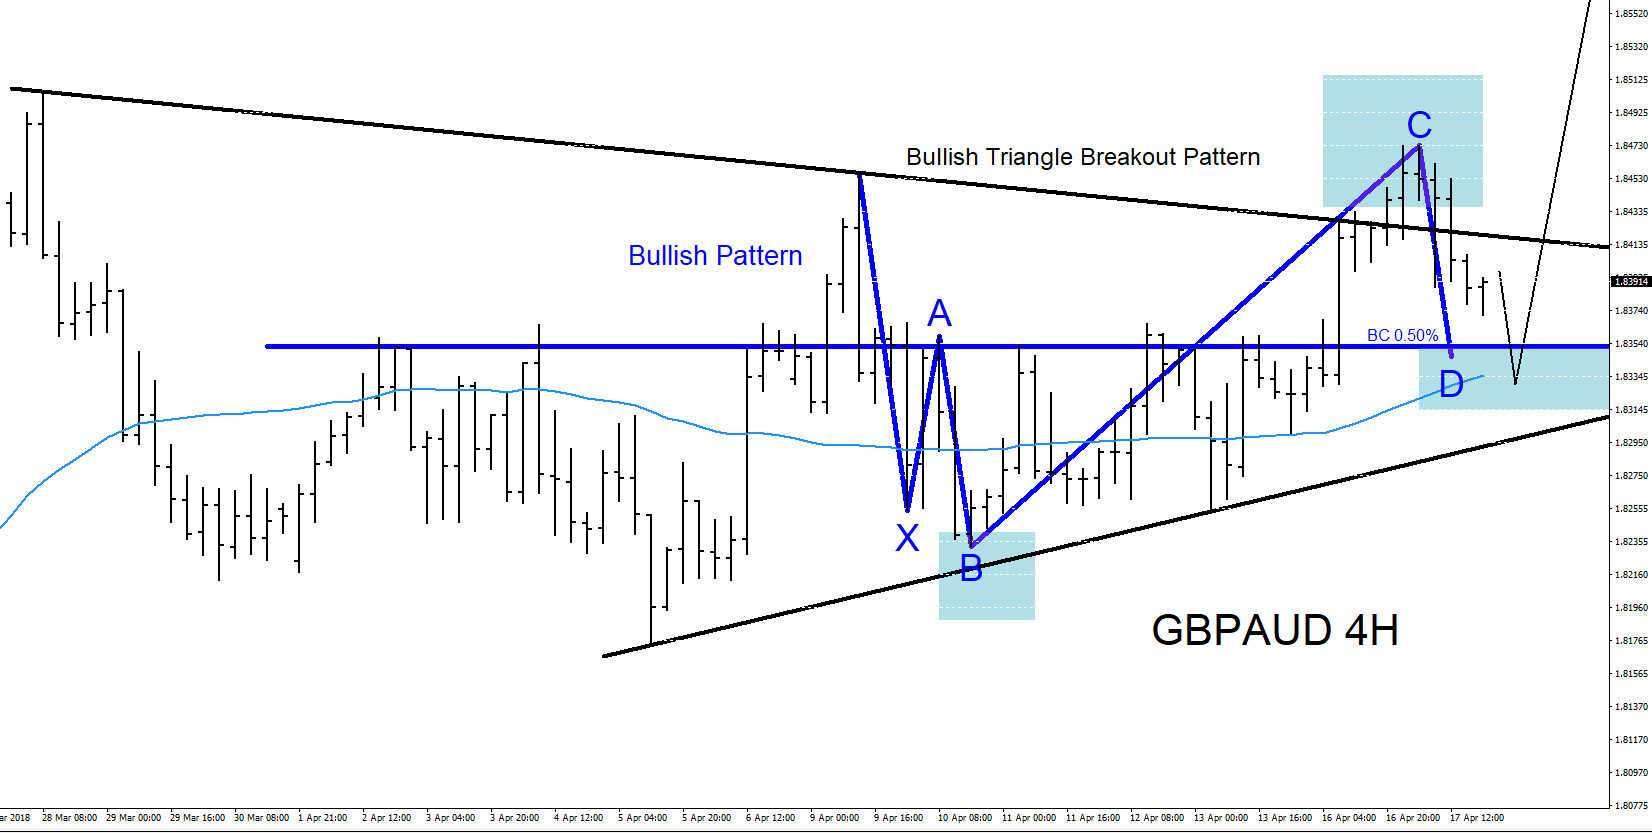
GBPAUD : Bullish Scenario Higher
Read MoreGBPAUD Technical Analysis 4.17.2018 GBPAUD has been trending higher since the pair found a bottom at the October 7/2016 low where GBPAUD reversed and bounced higher. Traders should remain looking for setups to BUY GBPAUD and should continue trading with the trend not against it. At the current moment there are a couple signs that […]
-

EURJPY : Possible Bearish Scenarios
Read MoreEURJPY Technical Analysis 4.11.2018 EURJPY has possibly formed a temporary top at the February 2/2018 high. As long as the pair stays below this high EURJPY can start another move lower below the March 23/2018 low. In the chart below, EURJPY is showing four bearish patterns that are clearly visible. On the 4 hour chart […]
-
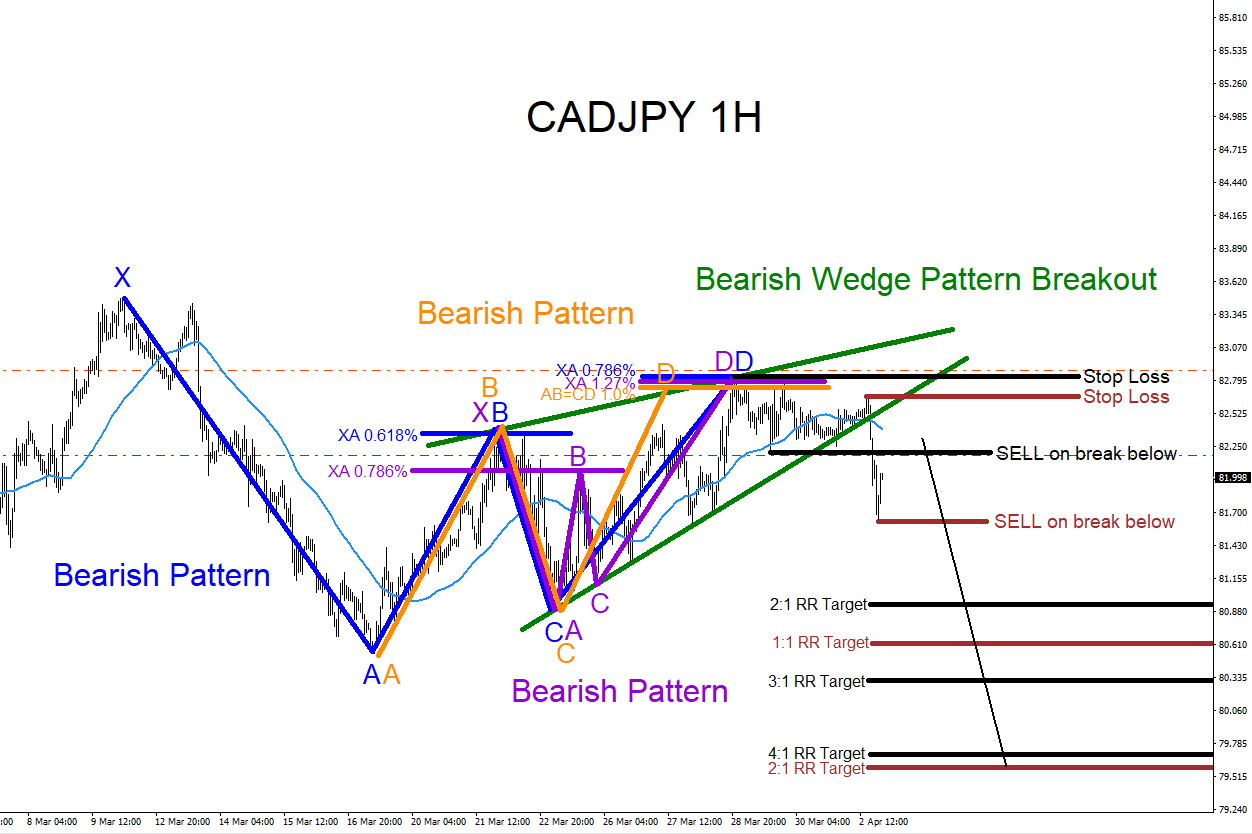
CADJPY : Bearish Patterns Calling Lower
Read MoreCADJPY Technical Analysis 4.3.2018 CADJPY has possibly formed a temporary top at the March 28/2018 high. As long as the pair stays below this high CADJPY can start another move lower below the March 19/2018 low. In the chart below, CADJPY is showing four bearish patterns that are clearly visible. Blue bearish pattern already triggered […]
-
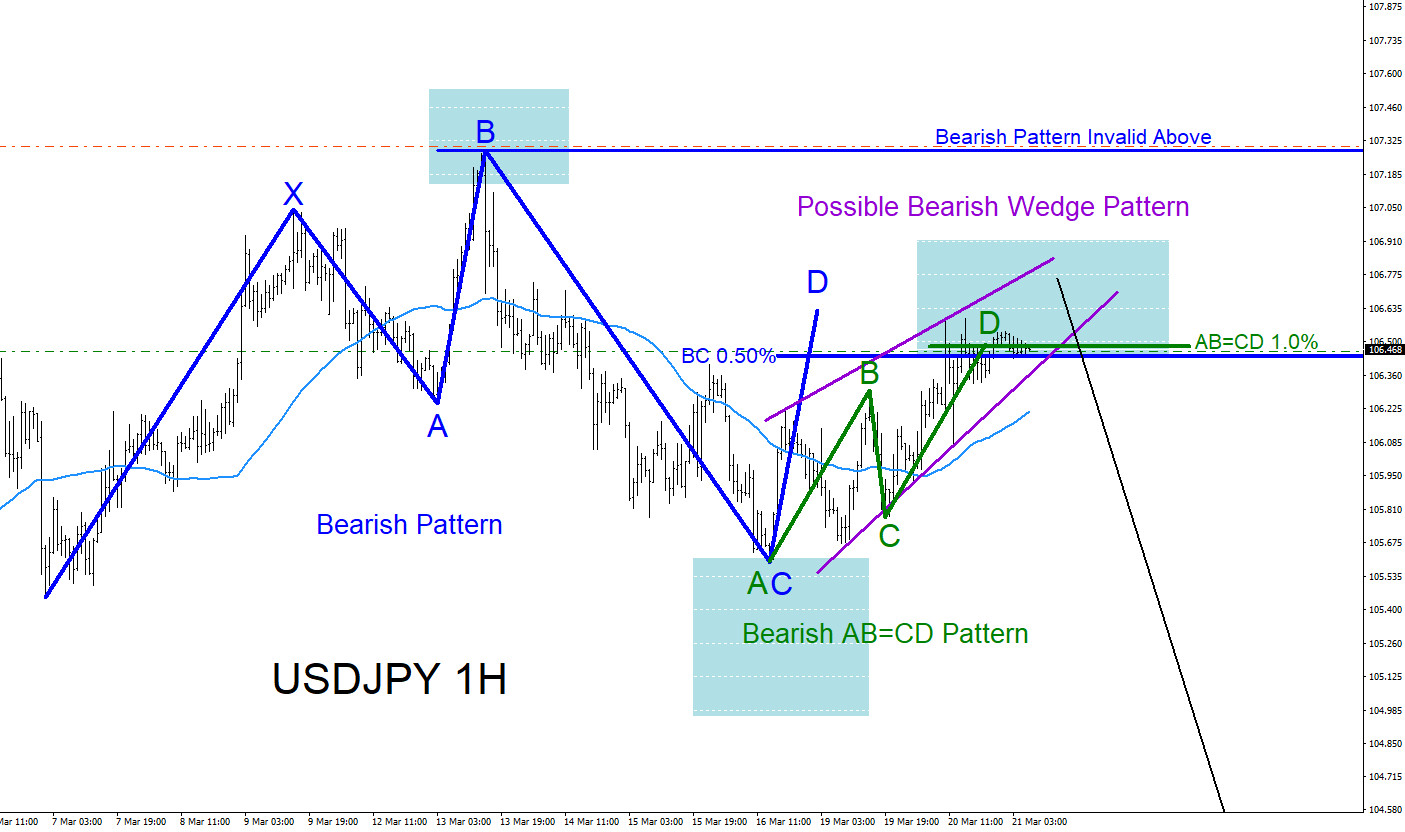
USDJPY : Trading Market Patterns
Read MoreUSDJPY 1 Hour Chart 3.21.2018 USDJPY was showing market patterns telling traders that the possiblity of the pair moving lower was coming. On March 21/2018 I posted the above USDJPY 1 hour chart trade setup on Twitter @AidanFX calling that the pair will make another move lower. Market patterns were clearly visible for bears to […]
-
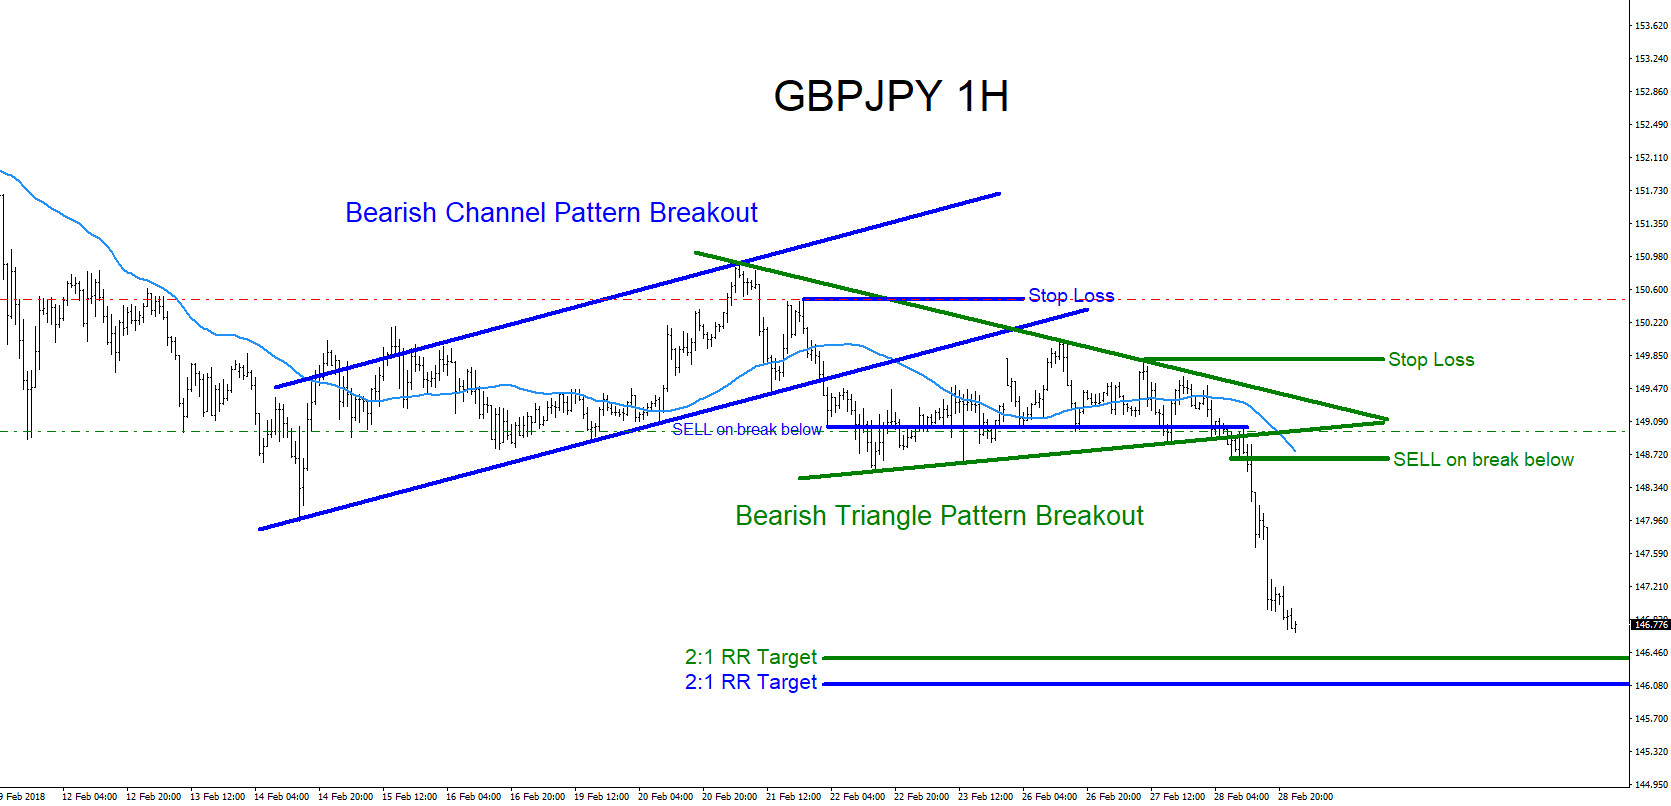
GBPJPY : Trading Market Patterns
Read MoreGBPJPY Elliott Wave pattern, Harmonic pattern, Head and Shoulder pattern, Channel pattern, Wedge pattern, Triangle pattern, Cup and Handle pattern, W. Wave pattern, Double and Triple Bottom/Top patterns, Pennant pattern, Flag pattern are all market patterns that every trader sees everyday on every time frame. These market patterns all have precise trading entry levels and […]