
-

USDCAD : Market Patterns Calling the Move Lower
Read MoreUSDCAD Technical Analysis The USDCAD pair since end of 2018 has been moving lower. The July 2019 low confirmed a lower low/lower high sequence. The possibility of the pair continuing the trend lower was visible but traders needed to wait on other signals/patterns to add more confirmation. In the charts below, clear bearish market patterns […]
-
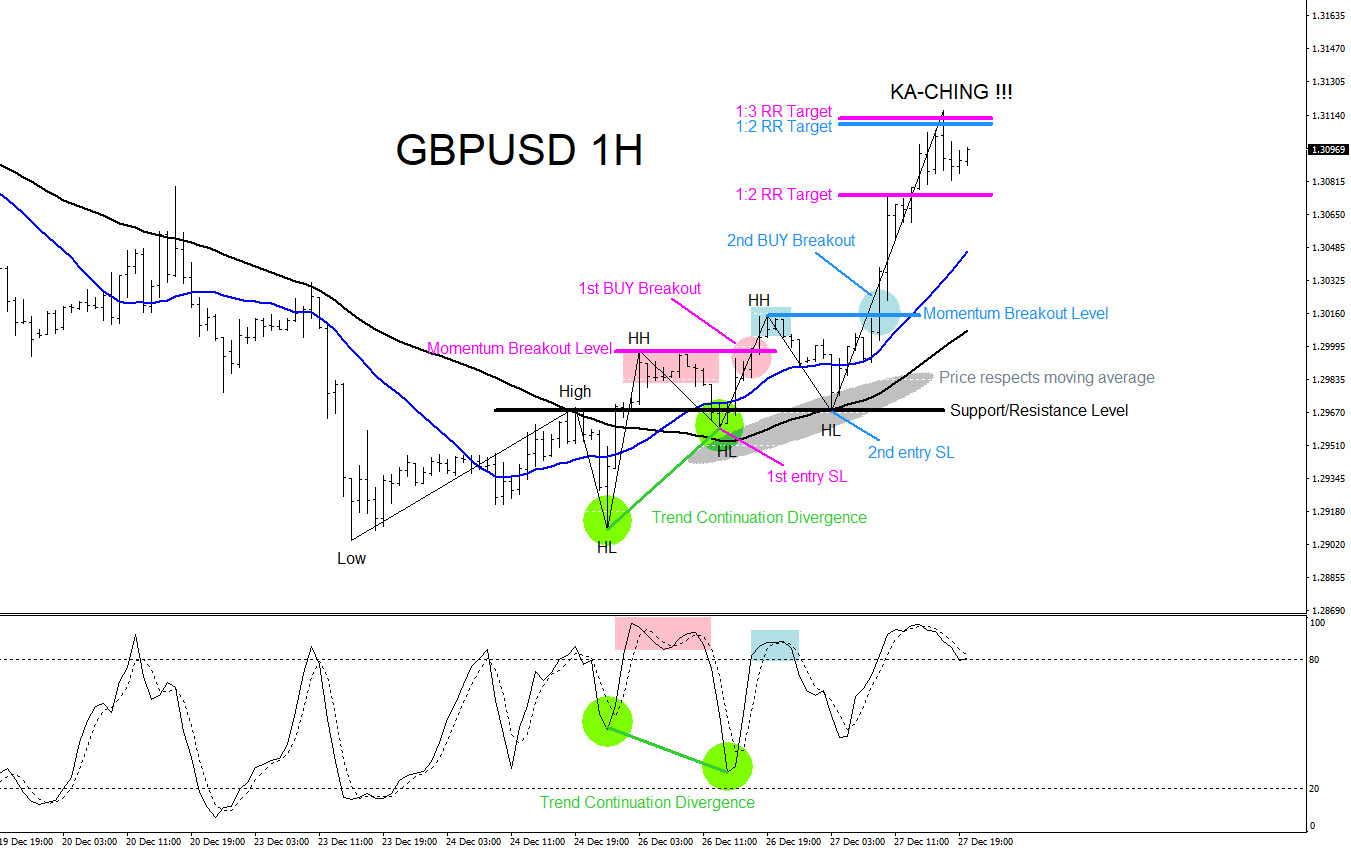
GBPUSD : Buying the Breakout Higher
Read MoreGBPUSD Technical Analysis GBPUSD : In the chart below, the pair made a bounce higher on December 23 2019. The pair found a temporary bottom and started a reversal by making higher highs and higher lows. Understanding how a possible short term trend can be forming is key to catching trade possibilities. Using trading filters/confirmations […]
-
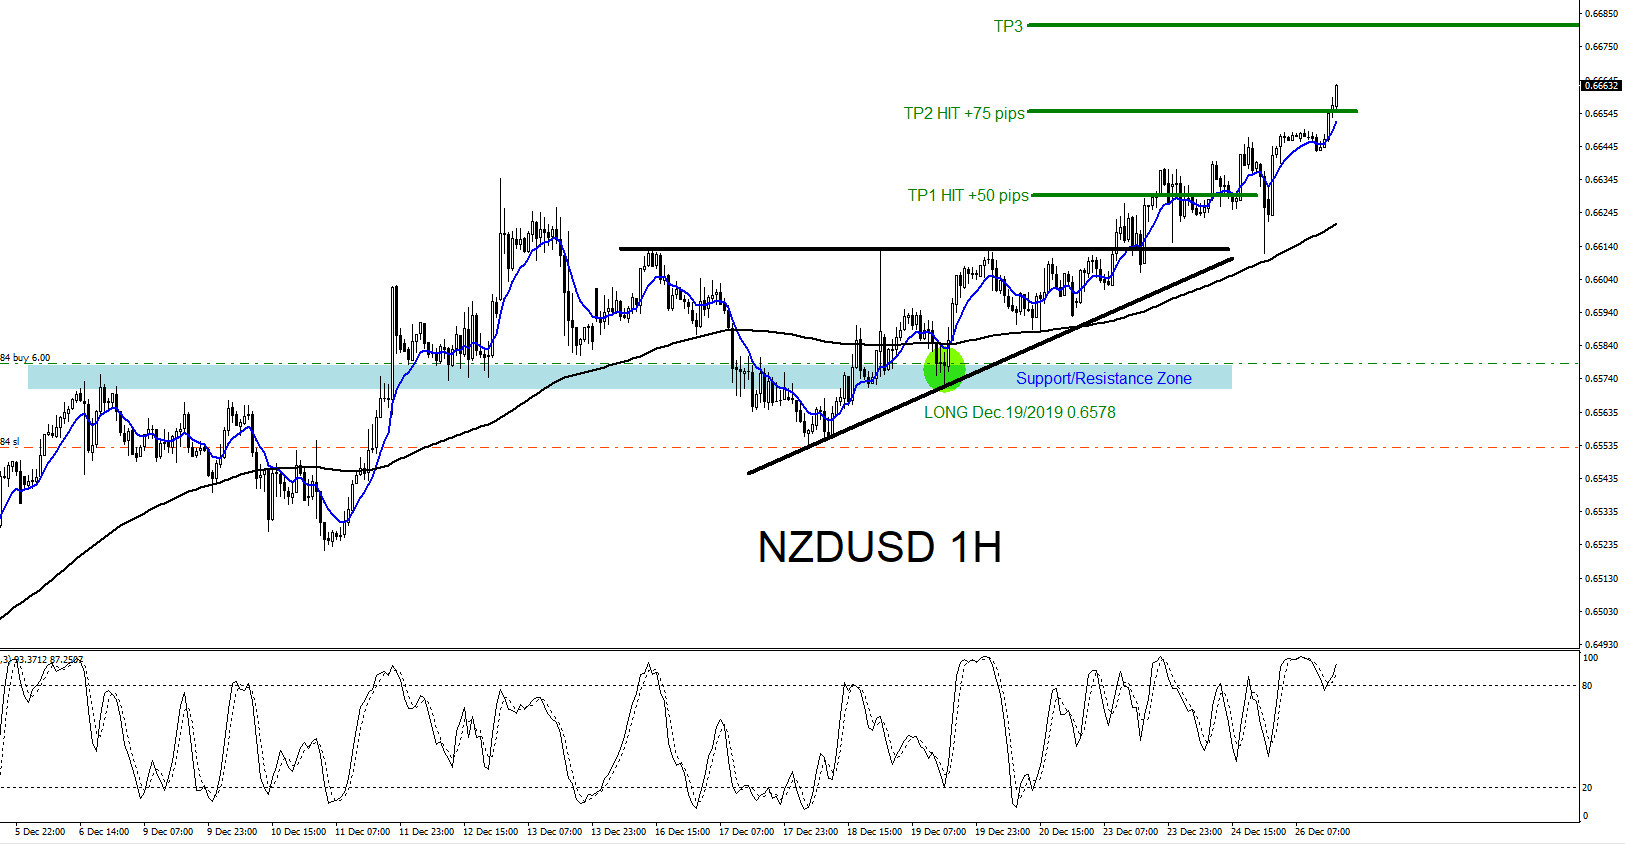
NZDUSD : Trading the Move Higher
Read MoreNZDUSD Technical Analysis On December 17/2019 EWF clients/members were advised that NZDUSD would bounce/rally higher. We use blue boxes to advise clients of potential reversal areas. In the chart below there is a clear Elliott Wave bullish impulse wave forming and we showed our clients the wave (4) termination in the blue box. Our clients […]
-
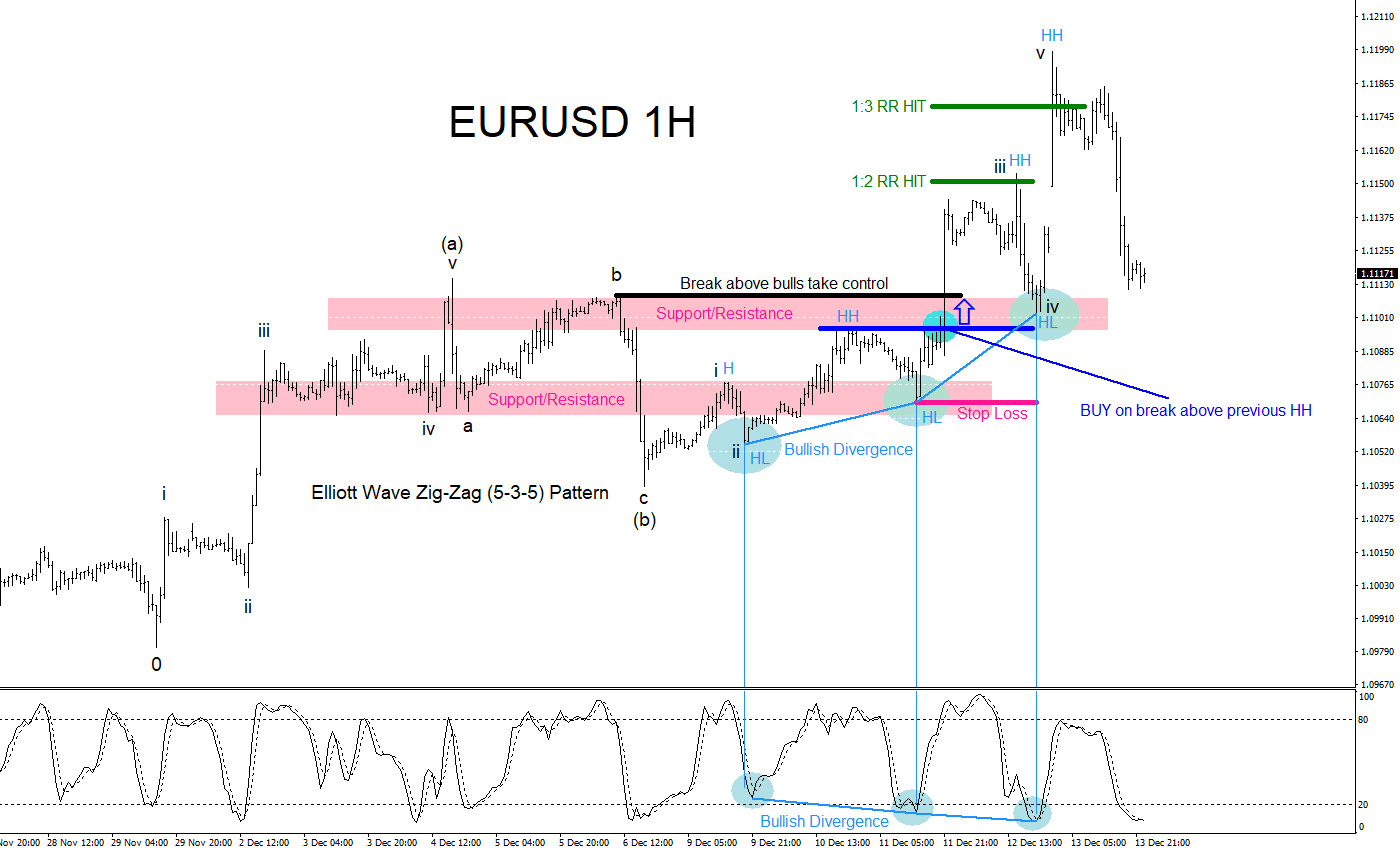
EURUSD : Identifying and Trading the Elliott Wave Zig Zag Pattern
Read MoreEURUSD Technical Analysis EURUSD : An Elliott Wave Zig-Zag pattern is a 3 wave (A,B,C) pattern consisting of a 5-3-5 wave structure. 5 waves for the wave A, followed by 3 waves for wave B and finally another 5 waves for wave C to complete the Zig Zag pattern. The Zig Zag pattern is a […]
-
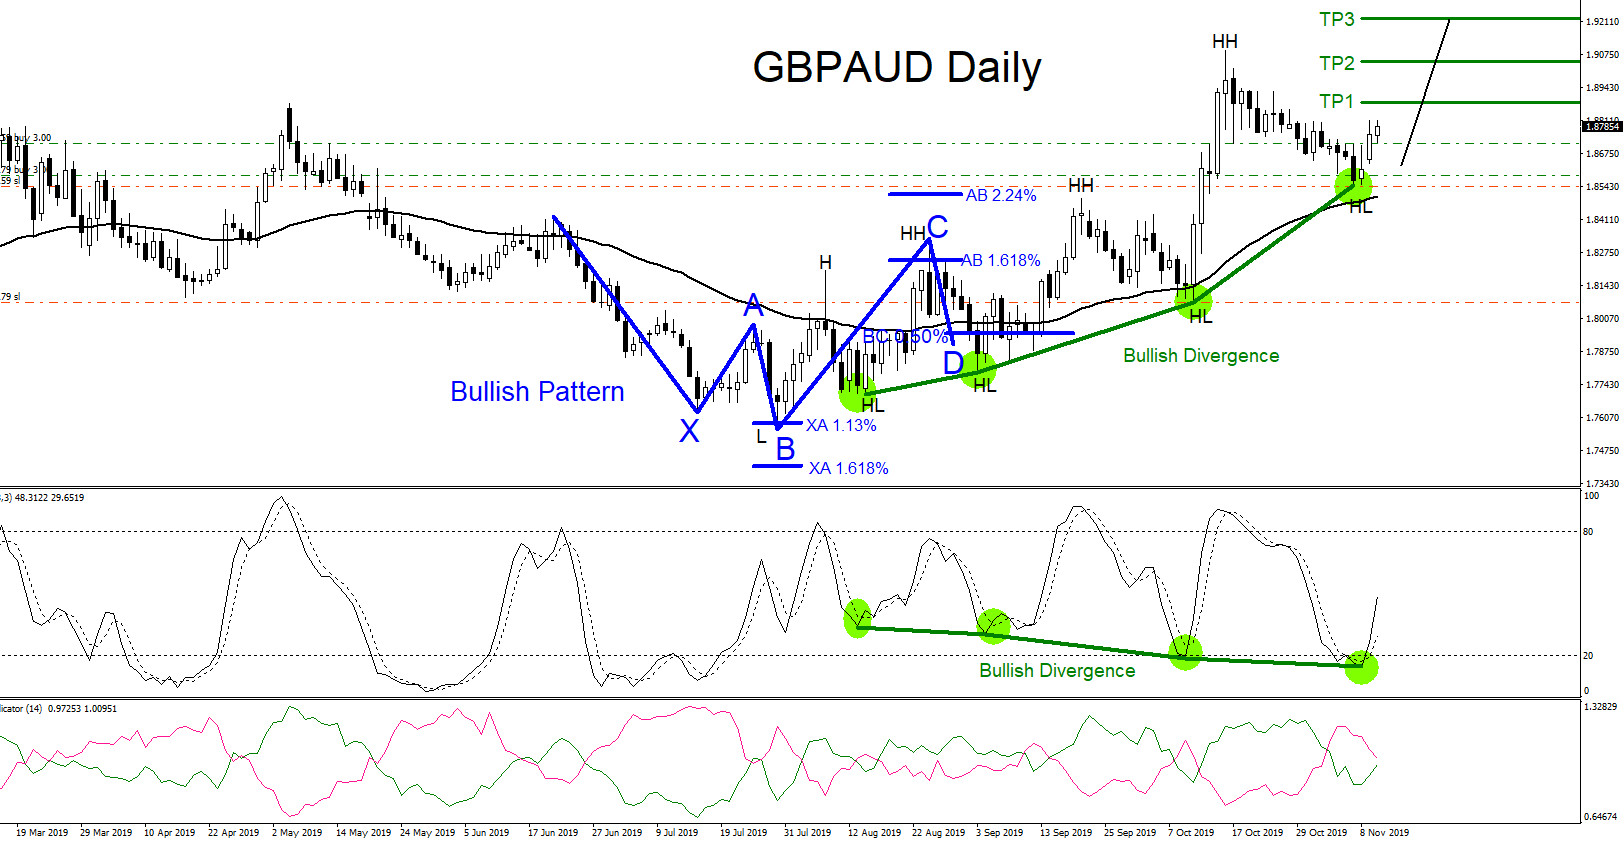
GBPAUD : Calling the 800 Pip Rally Higher
Read MoreGBPAUD Technical Analysis GBPAUD : On July 30/2019 the pair found a bottom and has bounced higher since. GBPAUD, on the daily chart, has been making higher highs and higher lows from the July 30/2019 lows indicating that the pair is trending to the upside. Trading with the trend is always recommended at EWF. After […]
-
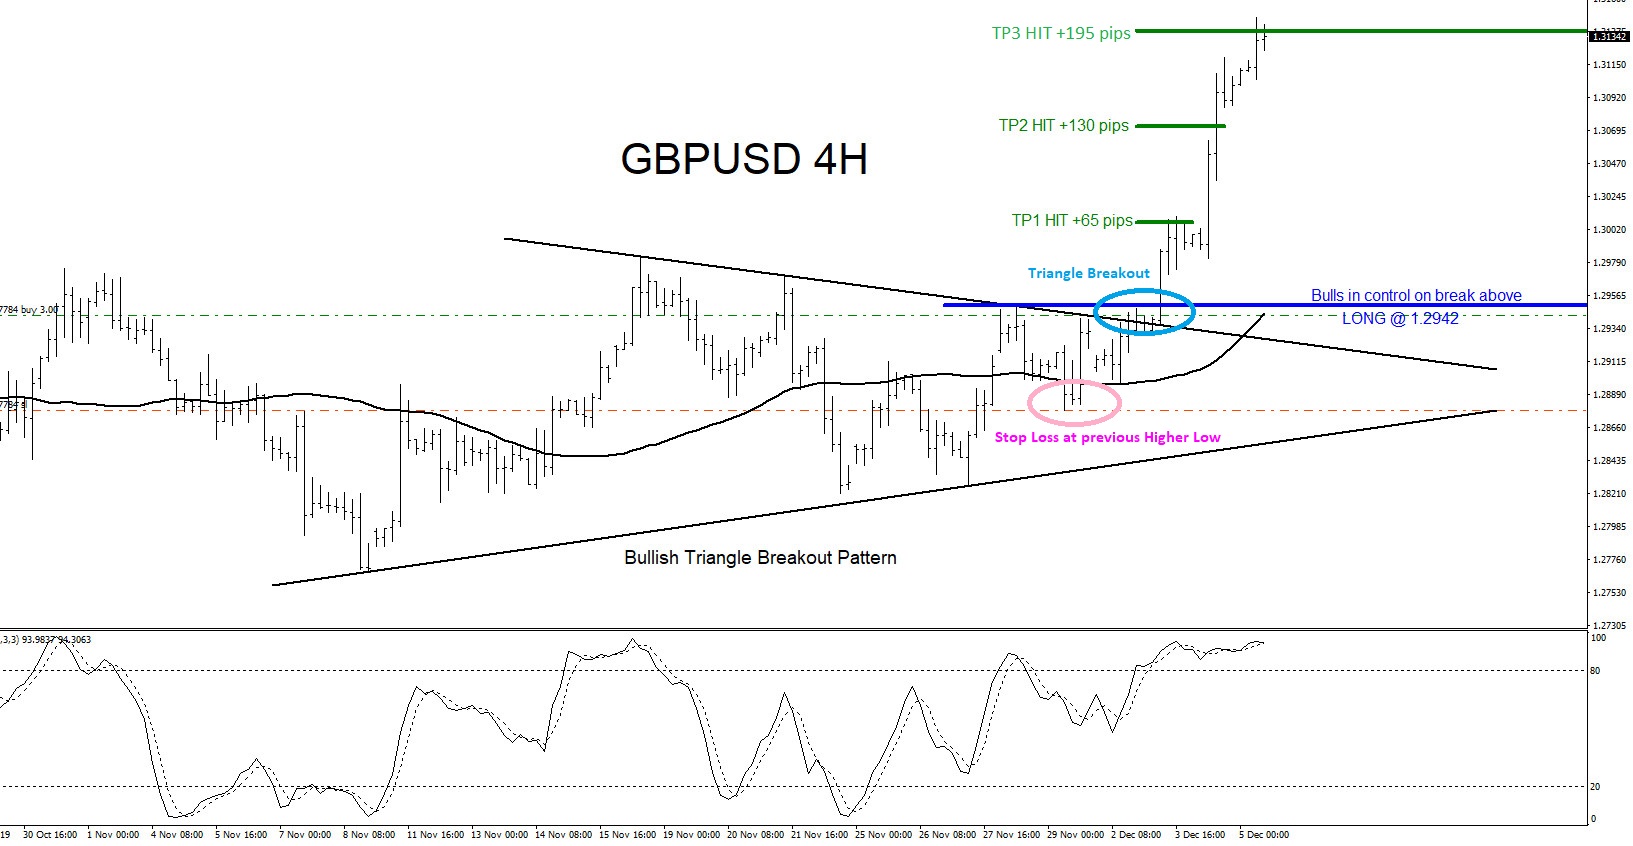
GBPUSD : Triangle Breakout Pattern
Read MoreGBPUSD Technical Analysis GBPUSD : On September 3/2019 the pair found a bottom and has bounced higher since. GBPUSD has been making higher highs and higher lows from the September 3/2019 lows indicating that the pair is trending to the upside. Trading with the trend is always recommended at EWF. Near the start of December […]