
-
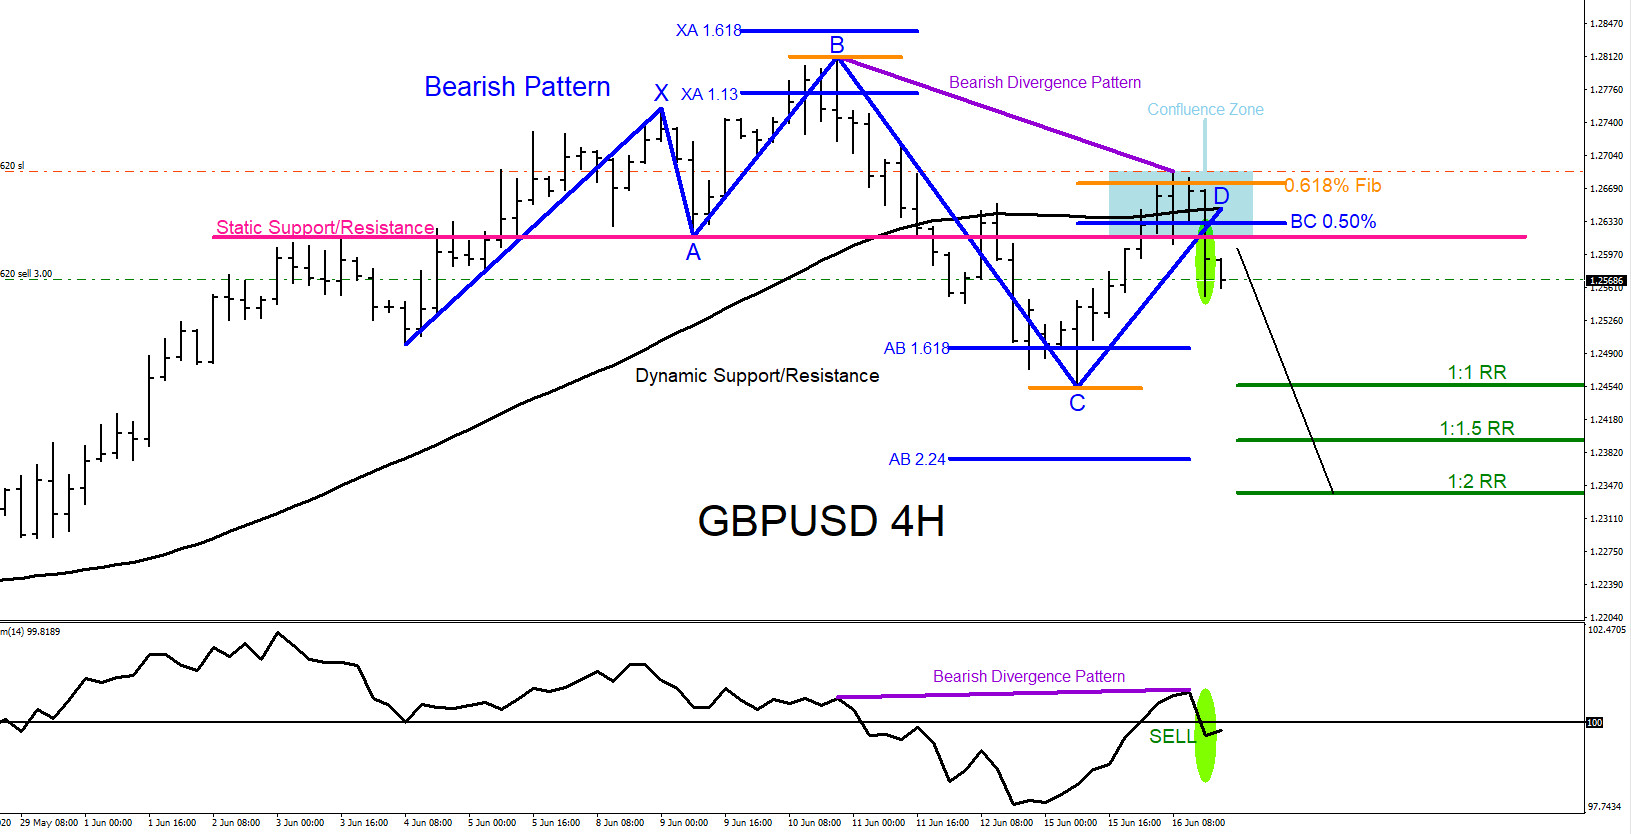
GBPUSD : Market Patterns Signalling the Move Lower
Read MoreOn June 16 2020 I posted on social media Stocktwits/Twitter @AidanFX “GBPUSD watching for SELLS“. The chart below was also posted on social media StockTwits/Twitter @AidanFX June 16 2020 showing that a bearish market pattern (blue) formed which then triggered the pair to react with a move lower. A bearish divergence pattern (purple) also formed […]
-
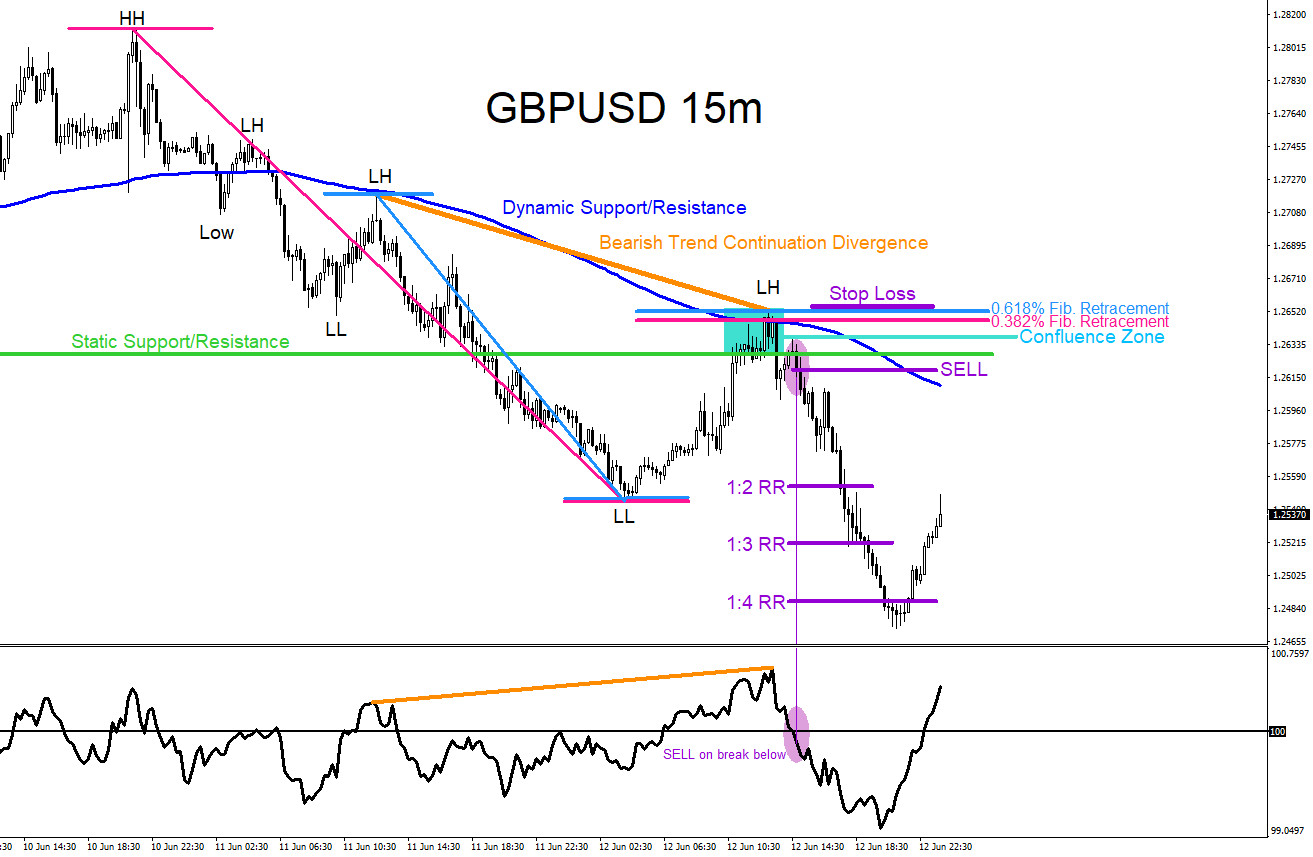
GBPUSD : Spotting and Trading Confluence Zones
Read MoreThe GPBUSD pair last week formed a temporary top and reversed lower. Towards the end of the trading week GBPUSD made lower lows and lower highs signalling the pair was in a downside trend. Traders use confluence zones to catch possible trade setups. Confluence zones are when 2 or more trading techniques/strategies come together and […]
-
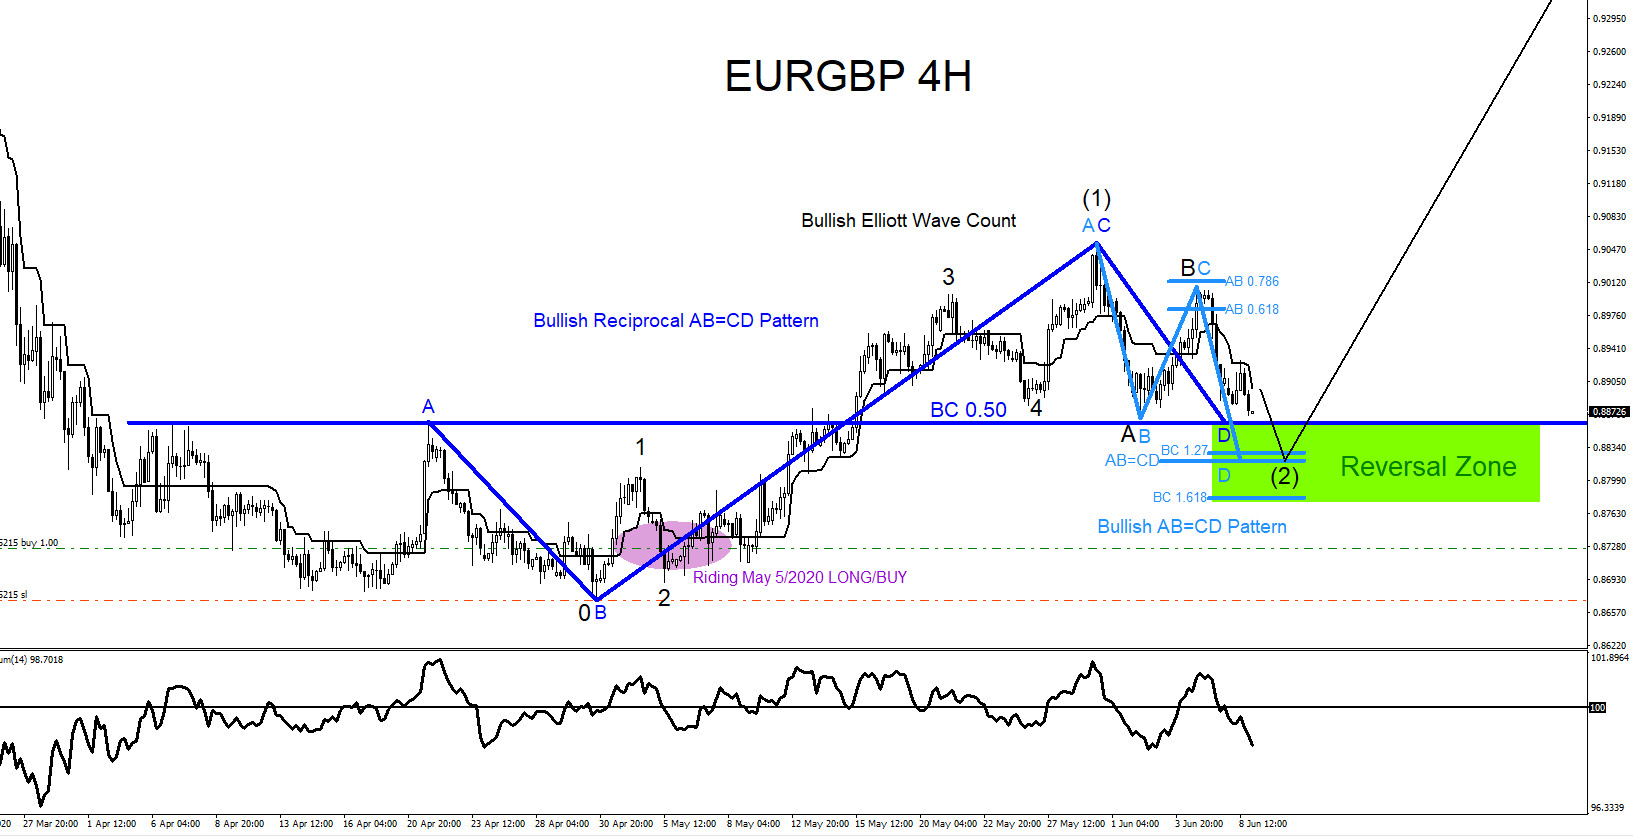
EURGBP : Watch For Possible Buying Opportunities
Read MoreEURGBP June 8 2020 Possible bullish patterns are visible on the EURGBP 4 hour time frame. The dark blue bullish reciprocal AB=CD pattern still needs to make a push lower to complete point D at the BC 0.50% Fib. retracement buy level and the light blue bullish AB=CD pattern also still needs to make a […]
-
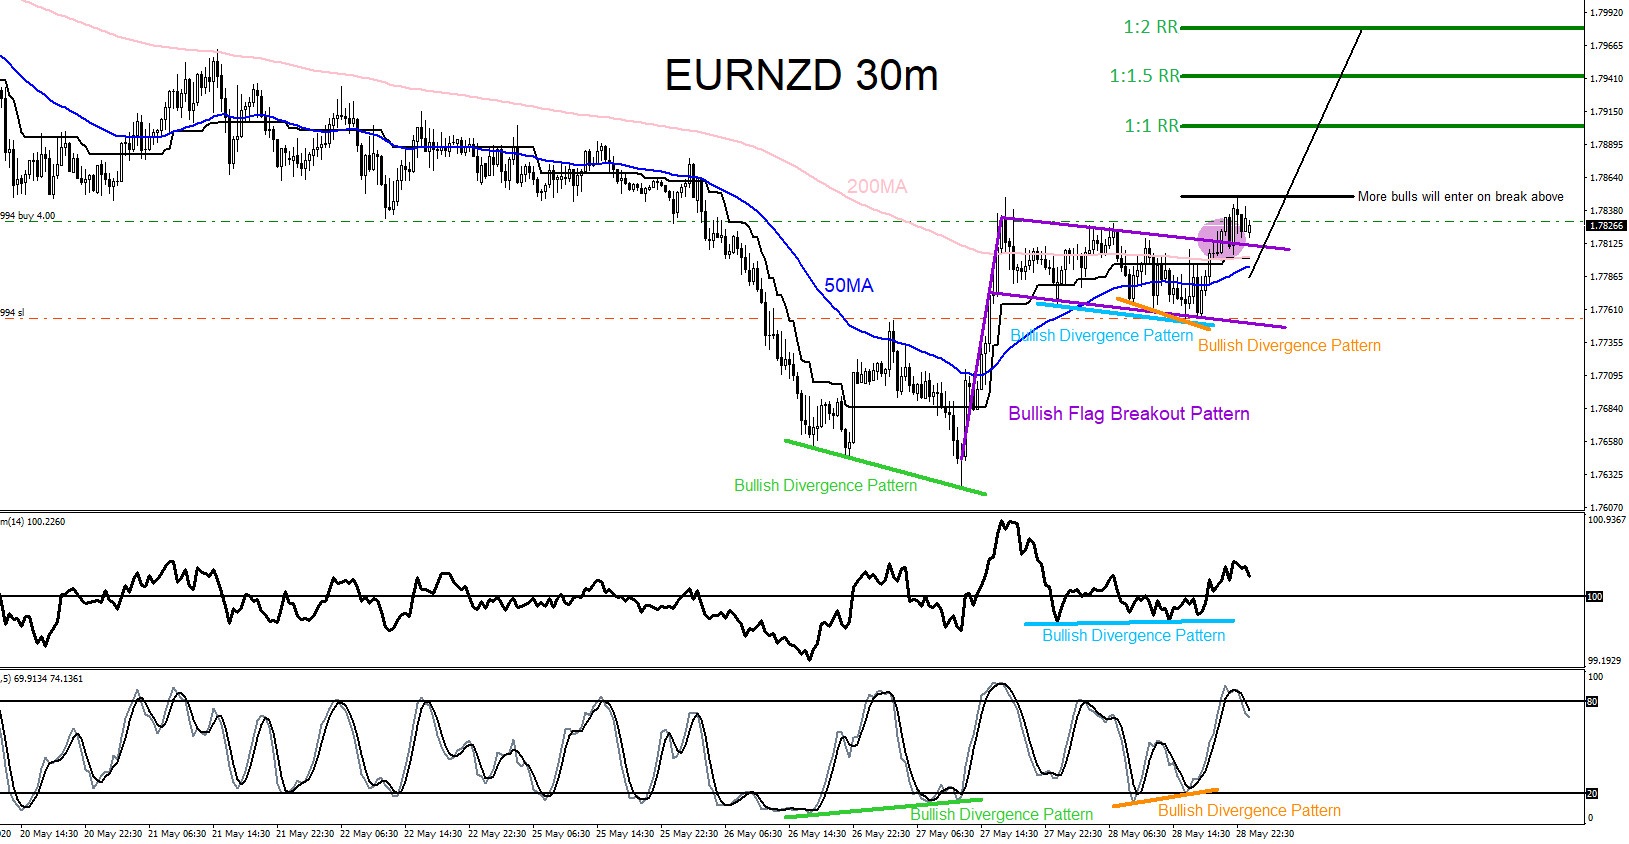
EURNZD : Catching the Move Higher
Read MoreOn May 28 2020 I posted on social media Stocktwits/Twitter @AidanFX “EURNZD Break above 1.7830 will look to BUY targeting the 1.7900 area“. The chart below shows that there were clearly visible bullish patterns calling for a breakout higher. EURNZD formed a bullish flag breakout pattern (purple) and broke above the top of flag signalling […]
-
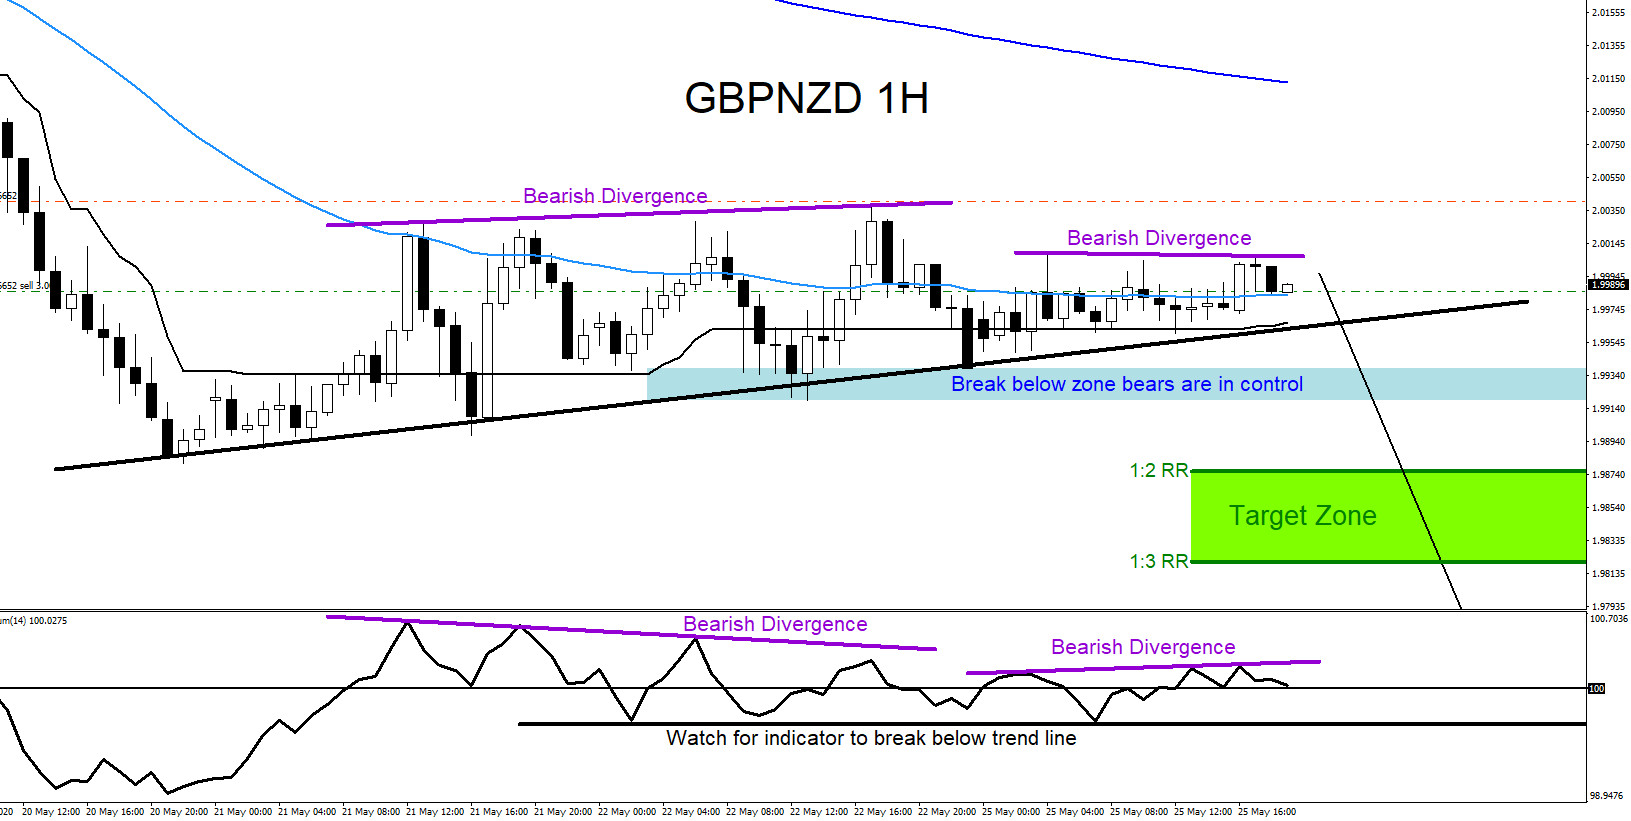
GBPNZD : Trading the Move Lower
Read MoreOn May 25 2020 I posted on social media Stocktwits/Twitter @AidanFX “GBPNZD will be watching for selling opportunities“. GBPNZD has been trending lower since April 2020 so the clear path will be to trade with the trend and not against it. The chart below was also posted on social media StockTwits/Twitter @AidanFX May 25 2020 showing that […]
-
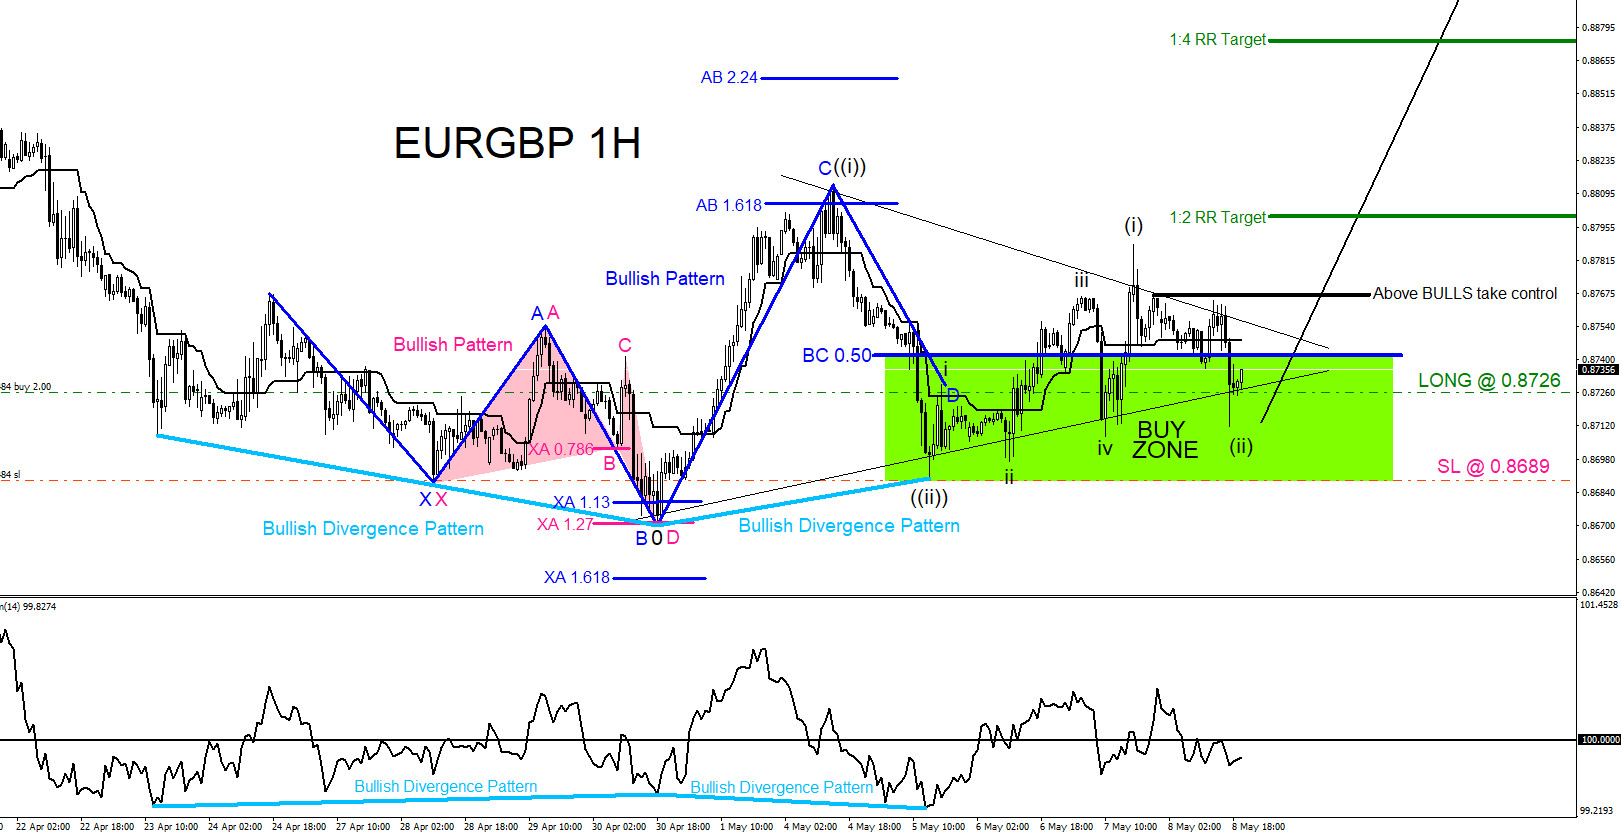
EURGBP : Market Patterns Calling the Move Higher
Read MoreEURGBP Technical Analysis On May 5/2020 I posted on social media (Stocktwits/Twitter) @AidanFX “$EURGBP will be watching for possible buying opportunities.“ EURGBP 1 Hour Chart May 8.2020 : The charts below was also posted on social media (StockTwits/Twitter) @AidanFX May 8/2020 showing that a bullish pattern (blue) has formed and price has entered the buy zone looking […]