
-
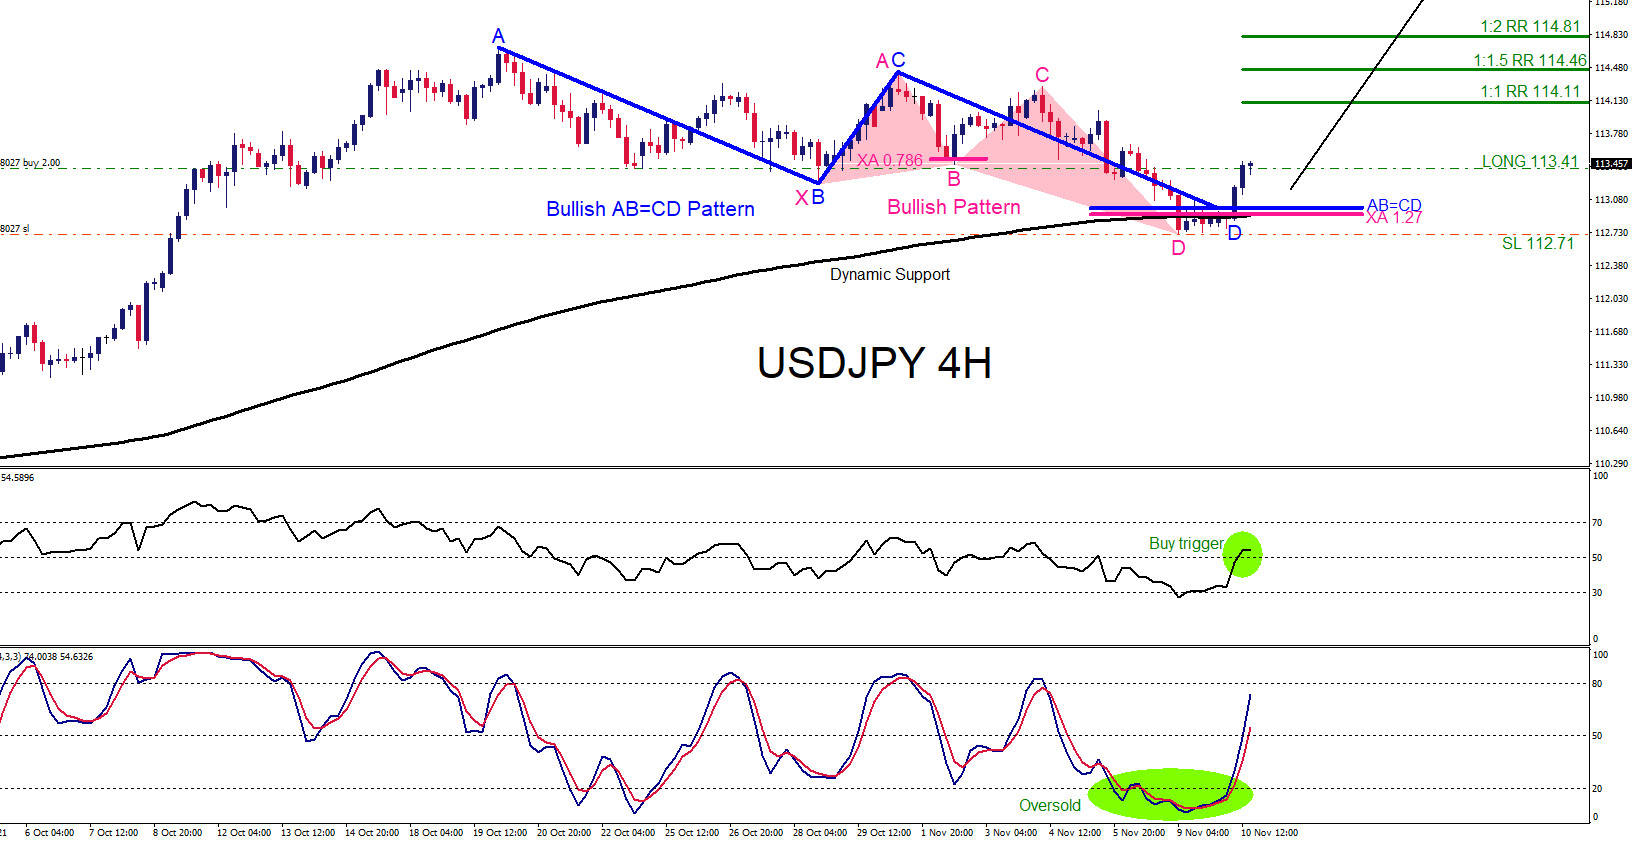
USDJPY : Market Patterns Signalled the Move Higher
Read MoreThere were several patterns that signalled the USDJPY pair would rally higher on November 10 2021. Since the start of 2021 USDJPY has been trending to the upside so it would only make sense to trade with the trend and not against it. Confluence trading is a combination of two or more trading strategies/techniques that […]
-
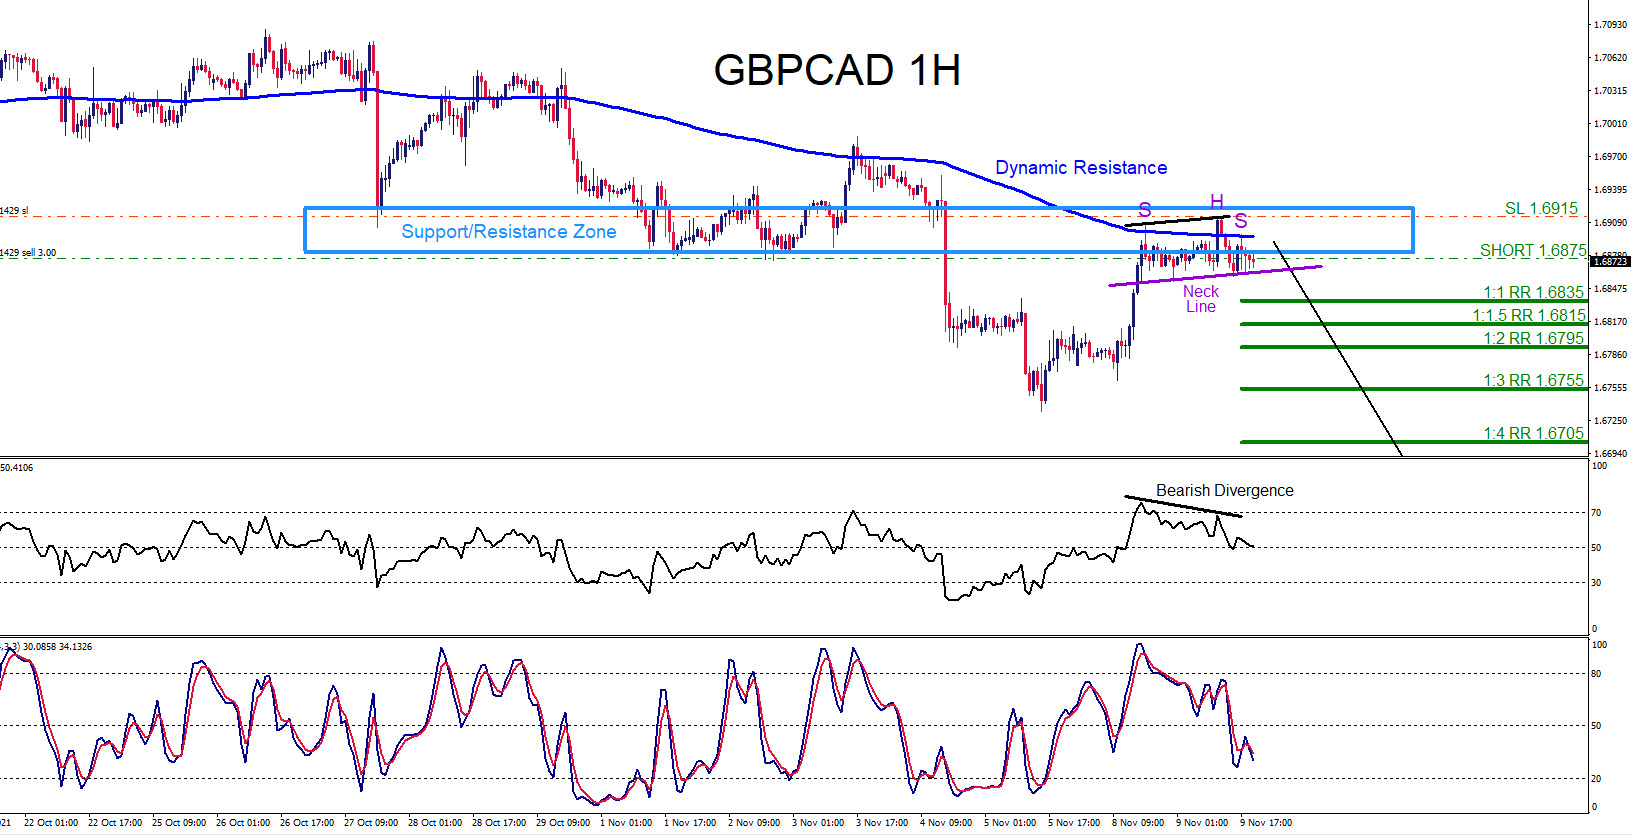
GBPCAD : Trading the Move Lower
Read MoreOn November 9 2021 I posted on social media @AidanFX “ GBPCAD can push lower towards 1.6810 area. Watch for possible selling opportunities. “ Confluence trading is a combination of two or more trading strategies/techniques that come together and form a high probability buy/sell zone in a certain area in the market. Market patterns (Elliott […]
-
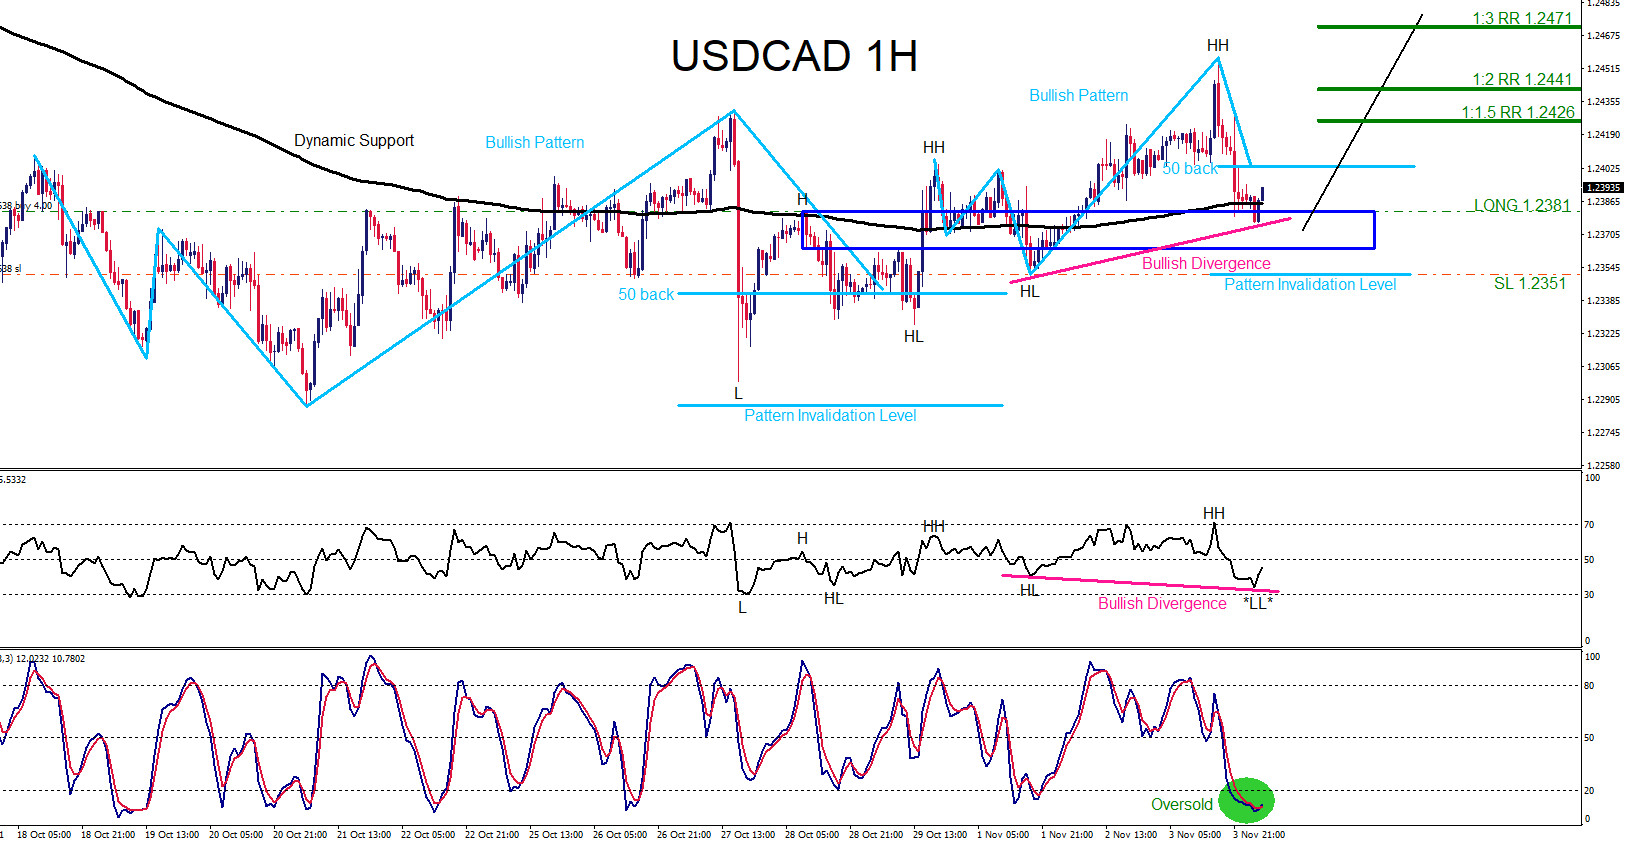
USDCAD : Trading the Move Higher
Read MoreOn November 3 2021 I posted on social media @AidanFX “ USDCAD can still push higher as long as price stays above 1.2351. Will be looking for buying opportunities. “ Confluence trading is a combination of two or more trading strategies/techniques that come together and form a high probability buy/sell zone in a certain area […]
-
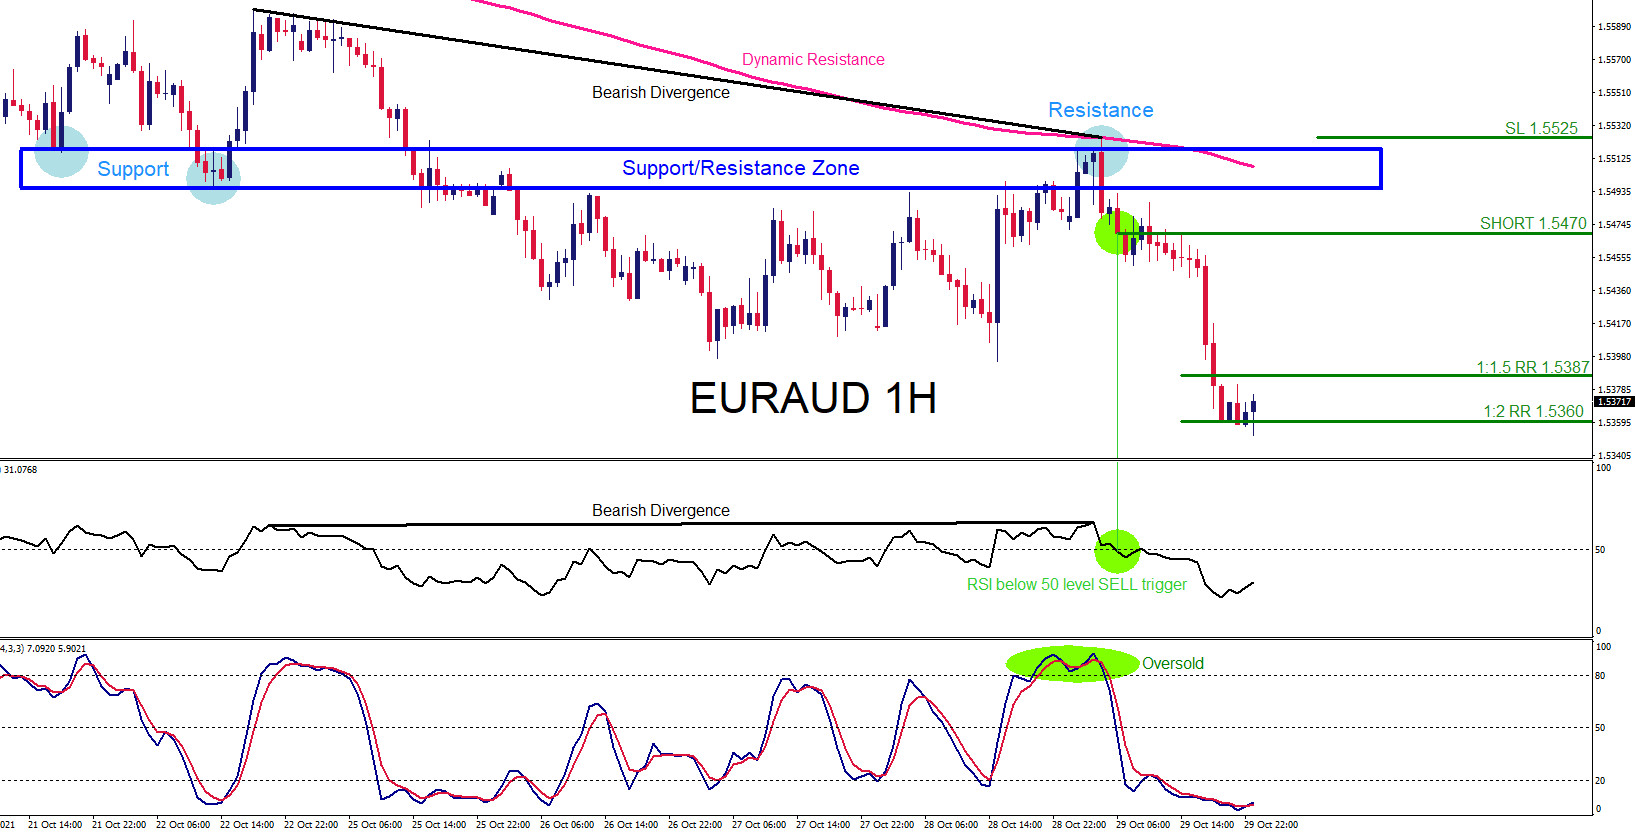
EURAUD : Confluence Trading
Read MoreConfluence trading is a combination of one or more trading strategies/techniques that come together and form a high probability buy/sell zone in a certain area in the market. Market patterns (Elliott Waves, Harmonic, Candlestick patterns etc.), price action (Support & Resistance, Supply & Demand Zones, Fibonacci retracements etc.) and indicators (RSI, Moving Average, Stochastic etc.) […]
-
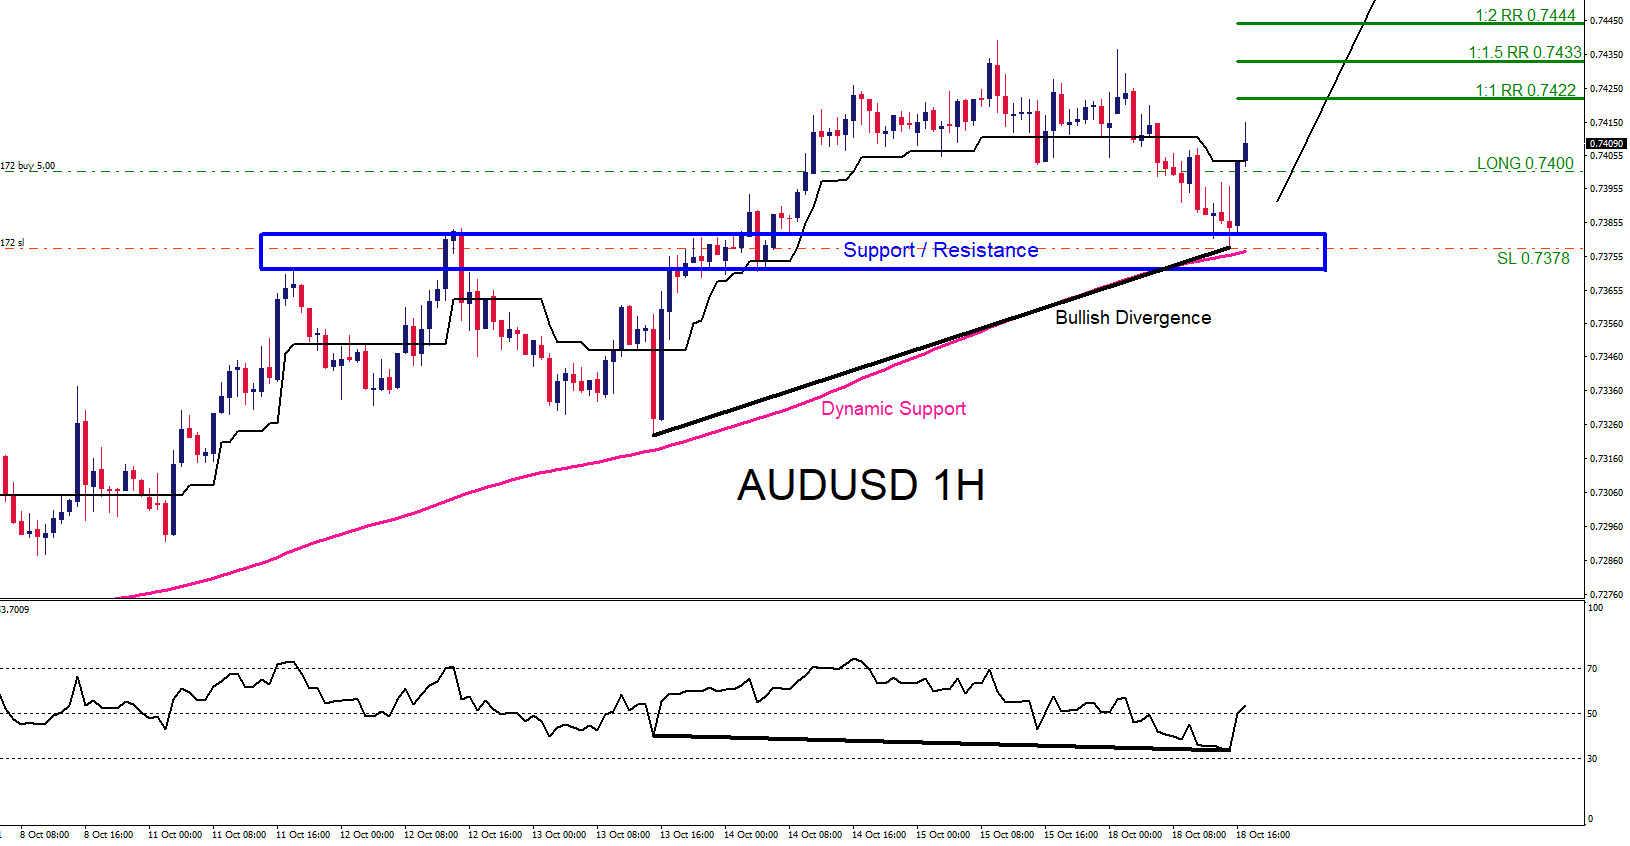
Confluence Trading
Read MoreConfluence trading is a combination of one or more trading strategies/techniques that come together and form a high probability buy/sell zone in a certain area in the market. Market patterns (Elliott Waves, Harmonic, Candlestick patterns etc.), price action (Support & Resistance, Supply & Demand Zones, Fibonacci retracements etc.) and indicators (RSI, Moving Average, Stochastic etc.) […]
-
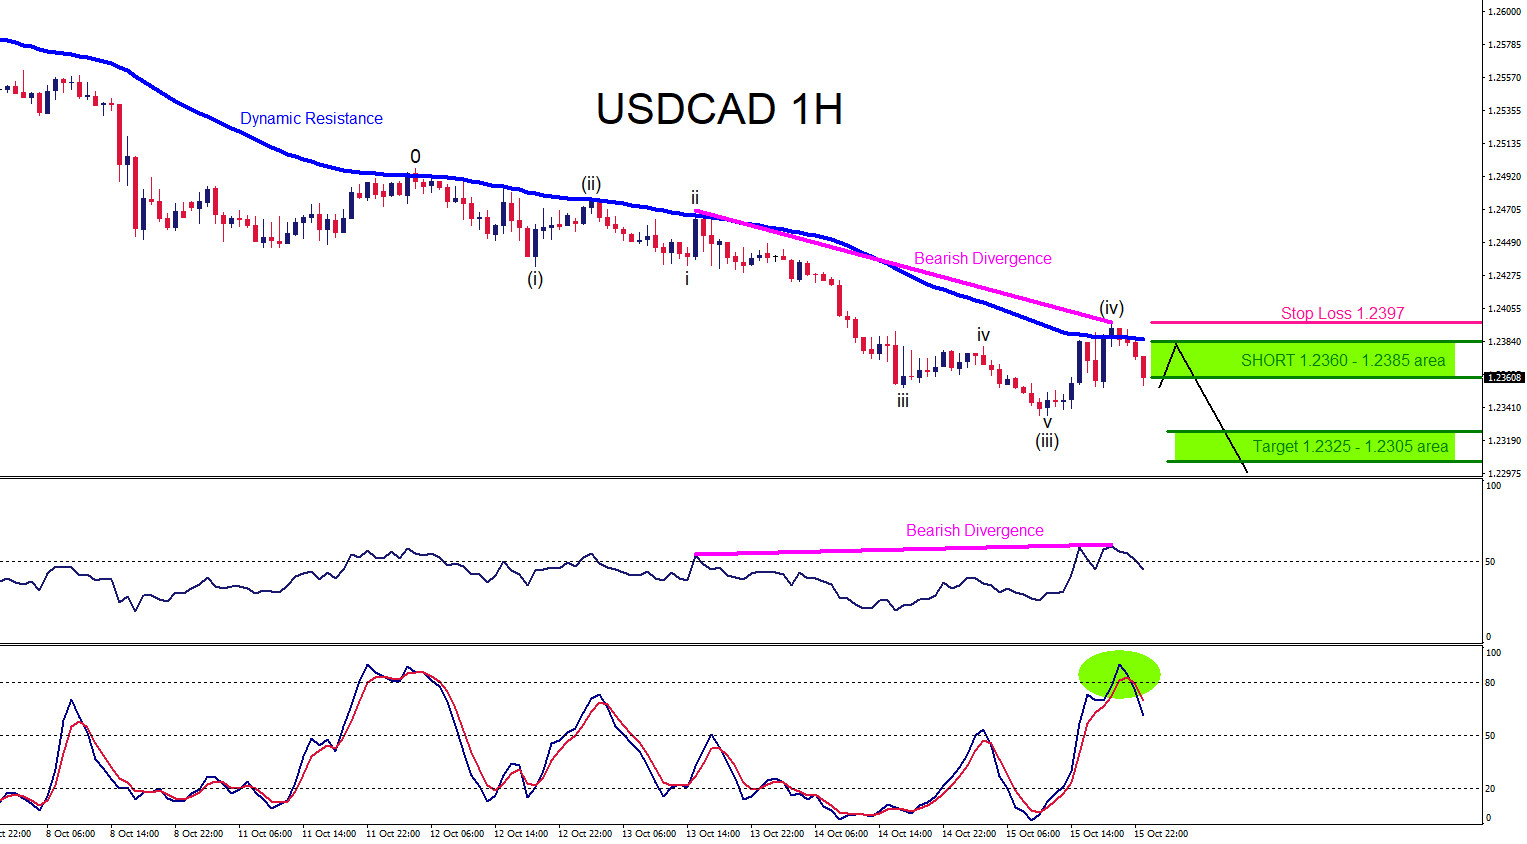
USDCAD : Watch for a Continuation Move Lower
Read MoreOn October 15 2021 I posted on social media @AidanFX “ USDCAD can be setting up for another push lower. As long price stays below 1.2415 the pair can dip lower towards the 1.2320 area. “ In the 1 hour chart below, the pair has been moving lower forming a lower low/lower high sequence signalling […]