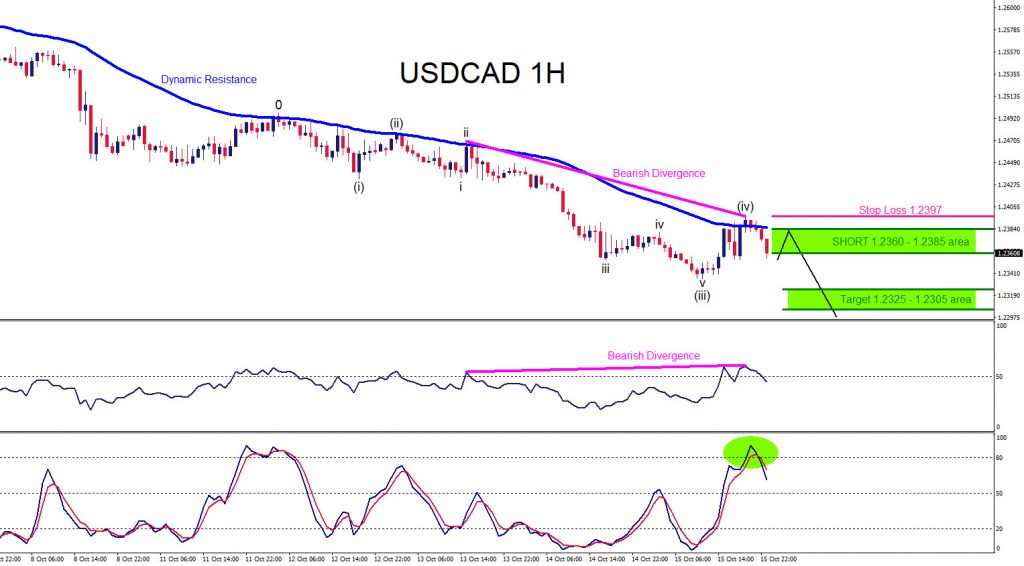
On October 15 2021 I posted on social media @AidanFX “ USDCAD can be setting up for another push lower. As long price stays below 1.2415 the pair can dip lower towards the 1.2320 area. “
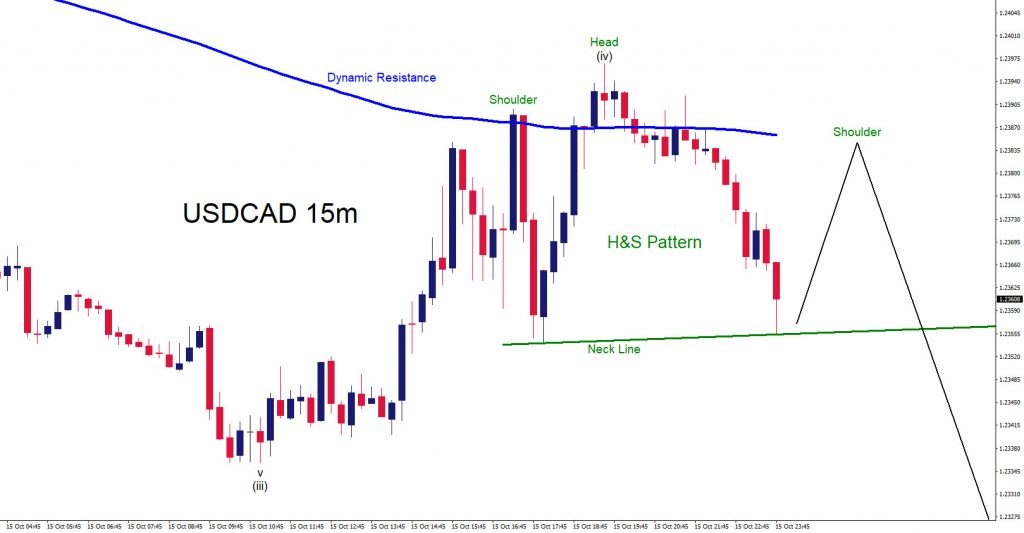
In the 1 hour chart below, the pair has been moving lower forming a lower low/lower high sequence signalling traders the pair is on a down trend. A bearish trend continuation divergence pattern (pink) formed at the October 15 2021 high also signalling for more downside. Added bearish sentiment is a possible bearish impulse wave still calling for the wave (v) lower. More added bearish sentiment is a possible bearish Head and Shoulders pattern is visible on the 15 minute chart. Watch for any selling opportunities with stops at 1.2397 and expect for a possible move lower towards the 1.2325 – 1.2305 target zone. Only time will tell what USDCAD will do but for now we remain bearish.
USDCAD 1 Hour Chart October 16 2021
USDCAD 15 Minute Chart October 16 2021
A trader should always have multiple strategies all lined up before entering a trade. Never trade off 1 simple strategy. When multiple strategies all line up it allows a trader to see a clearer trade setup.
Of course, like any strategy/technique, there will be times when the strategy/technique fails so proper money/risk management should always be used on every trade. Hope you enjoyed this article and follow me on social media for updates and questions> @AidanFX
At Elliottwave-Forecast we cover 78 instruments (Forex, Commodities, Indices, Stocks and ETFs) in 4 different time frames and we offer 5 Live Session Webinars everyday. We do Daily Technical Videos, Elliott Wave Trade Setup Videos and we have a 24 Chat Room. Our clients are always in the loop for the next market move.
Try Elliottwave-Forecast for 14 days FREE !!! Just click here –> 14 day FREE trial
Back


