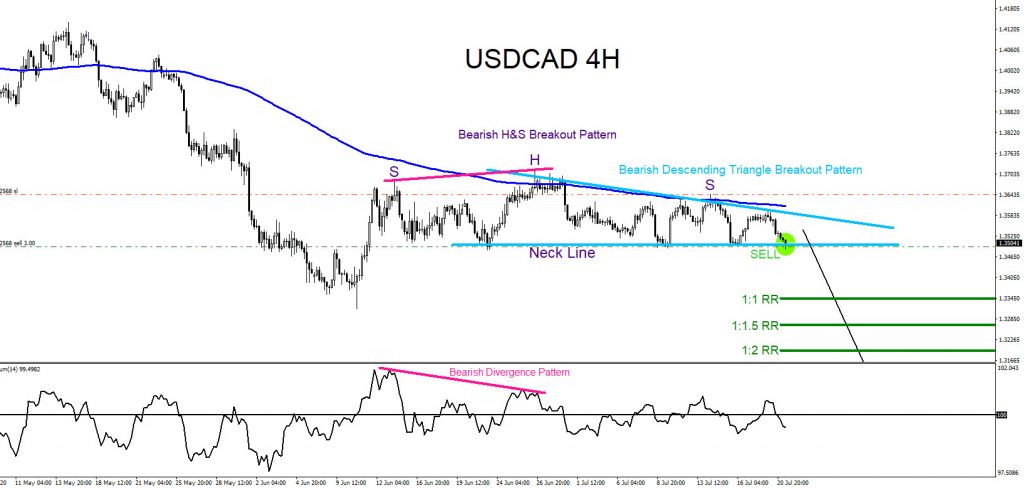
The chart below of the USDCAD pair was posted on social media StockTwits/Twitter @AidanFX July 21 2020 showing that a bearish market pattern (light blue descending triangle) formed and triggered SELLS when price broke below the triangle. A bearish Head and Shoulders (purple) pattern also signalled sellers to enter on the breakout below the neckline which was also the same bottom trend line of the triangle pattern. Bearish divergence pattern (pink) formed in June 2020 and was clearly visible which signalled traders to look for possible selling opportunities.
I called for traders to SELL USDCAD and only a move above the triangle pattern and above the top of the right shoulder of the H&S pattern would invalidate the SELL trade setup. Stop loss was set above the right shoulder of the H&S pattern targeting the green 1:1 RR and 1:2 RR targets.
USDCAD 4 Hour Chart July 21.2020
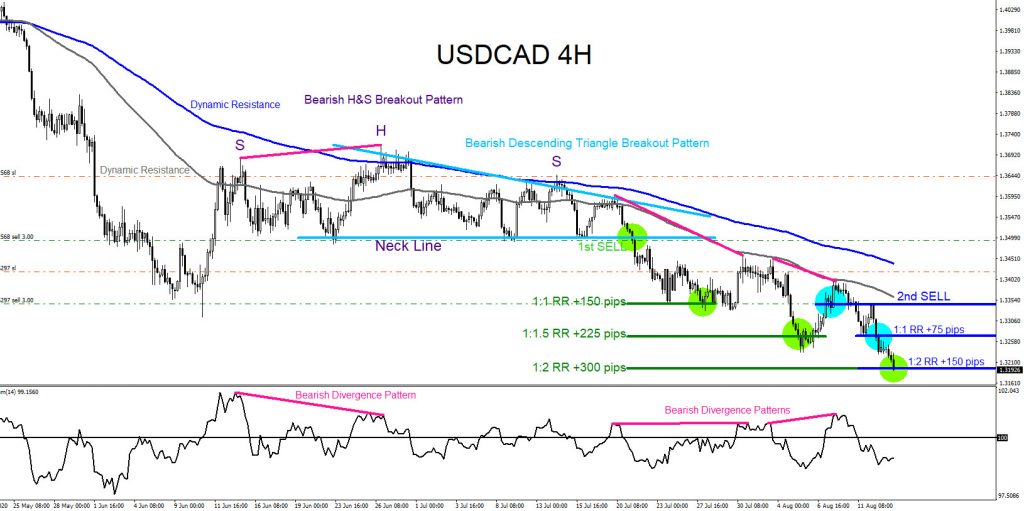
USDCAD 4 Hour Chart August 13.2020
USDCAD continues lower and on August 13 2020 price reaches the 1:2 RR target at 1.3193 from 1.3493 1st entry for +300 pips. The 2nd SELL entry (dark blue) was tweeted August 6.2020 and also hit the 1:2 RR target at 1.3195 from 1.3345 entry for +150 pips. If you followed me on Twitter/Stocktwits @AidanFX you too could have caught the USDCAD move lower.
Of course, like any strategy/technique, there will be times when the strategy/technique fails so proper money/risk management should always be used on every trade. Hope you enjoyed this article and follow me on Twitter for updates and questions> @AidanFX or chat me on Skype > EWF Aidan Chan
At Elliottwave-Forecast we cover 78 instruments (Forex, Commodities, Indices, Stocks and ETFs) in 4 different time frames and we offer 3 Live Session Webinars everyday. We do Daily Technical Videos, Elliott Wave Trade Setup Videos and we have a 24 Chat Room. Our clients are always in the loop for the next market move.
Try Elliottwave-Forecast for 14 days FREE !!! Just click here –> 14 day FREE trial
Back


