USDCAD Technical Analysis
The USDCAD pair since end of 2018 has been moving lower. The July 2019 low confirmed a lower low/lower high sequence. The possibility of the pair continuing the trend lower was visible but traders needed to wait on other signals/patterns to add more confirmation. In the charts below, clear bearish market patterns were visible on the Daily chart which eventually got SELLERS to push USDCAD lower.
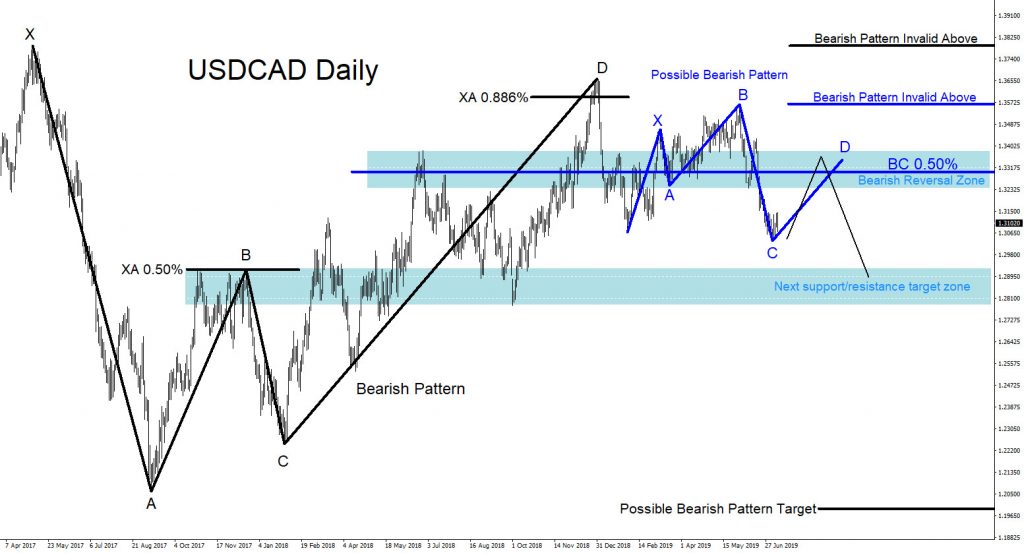
USDCAD Daily Chart 7.10.2019
On July 10/2019 I posted this chart on Twitter explaining the possible area where the pair will find resistance and reverse lower. Bears would be waiting at the blue bearish pattern BC 0.50% Fib. level.
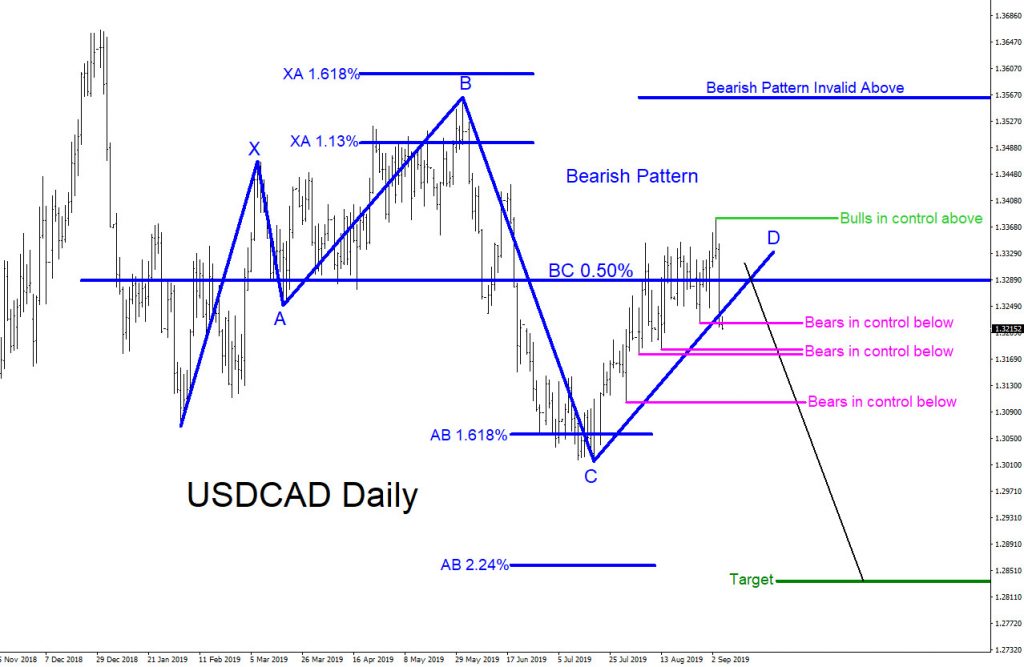
USDCAD Daily Chart 9.5.2019
On September 5/2019 I posted this chart on Twitter explaining the blue bearish pattern BC 0.50% Fib. level was reached and SELLERS were getting in. The chart shows the levels (pink) that need to break to add more bears to get in the market with confidence.
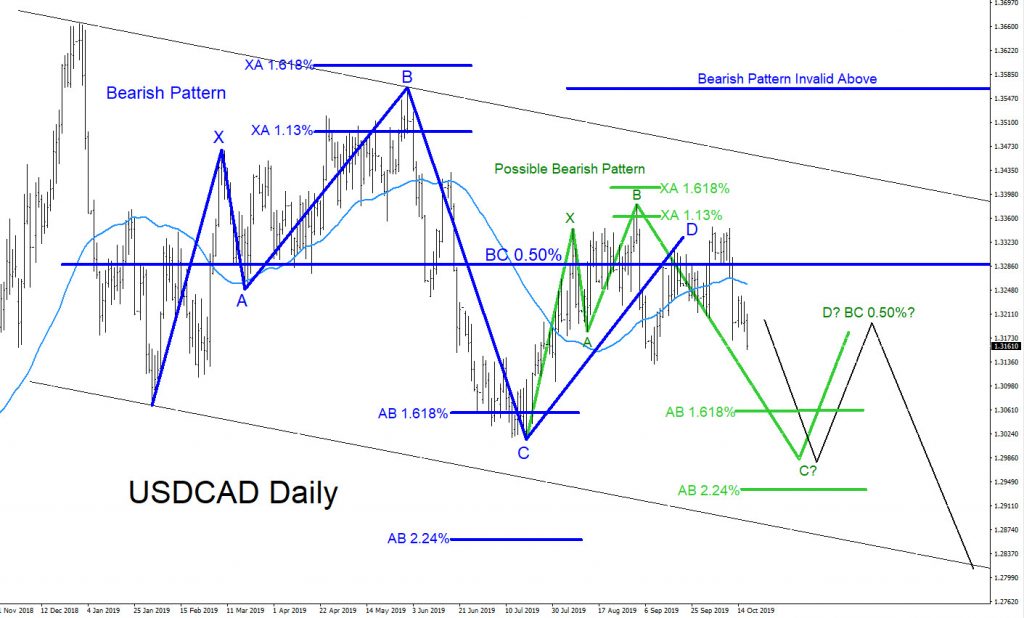
USDCAD Daily Chart 10.17.2019
By October 17/2019 another visible bearish pattern (green) was forming. I posted this chart explaining to watch for more selling opportunities after the price registers below AB 1.618% Fib. level and bounces/retraces to the green BC 0.50% Fib. level where more bears will be waiting to push the pair lower.
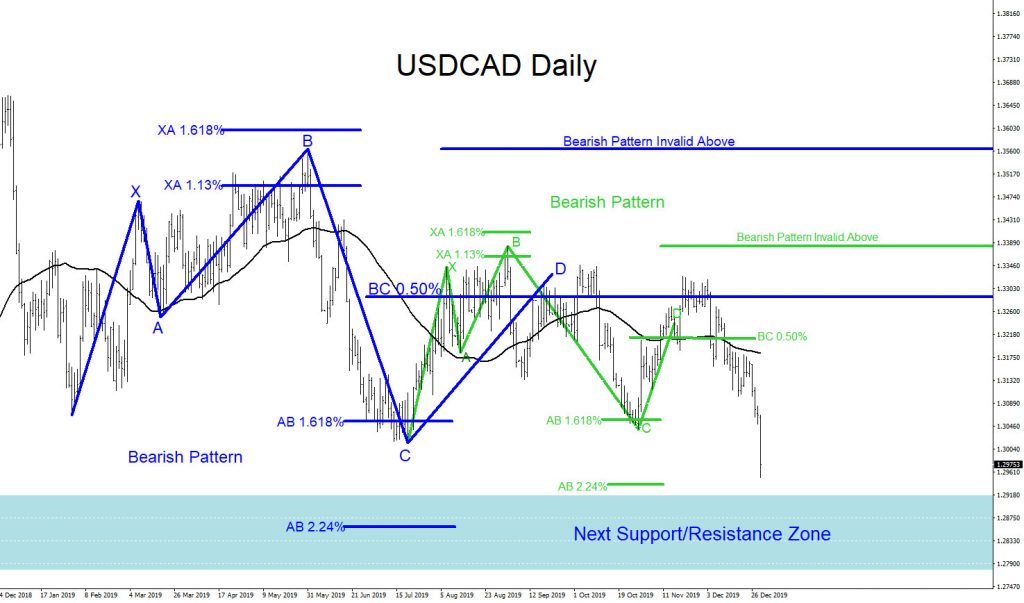
USDCAD Daily Chart 12.31.2019
USDCAD bounced off the green AB 1.618% Fib. level and triggered more SELLERS at the green BC 0.50% Fib. level which pushed USDCAD lower. All bearish patterns remained active and both patterns remained below the pattern invalidation levels. Expecting USDCAD to continue lower and hit the next support/resistance zone that was forecasted back in July 2019.
Of course, like any strategy/technique, there will be times when the strategy/technique fails so proper money/risk management should always be used on every trade. Hope you enjoyed this article and follow me on Twitter for updates and questions> @AidanFX or chat me on Skype > EWF Aidan Chan
*** Always use proper risk/money management according to your account size ***
At Elliottwave-Forecast we cover 78 instruments (Forex, Commodities, Indices, Stocks and ETFs) in 4 different timeframes and we offer 5 Live Session Webinars everyday. We do Daily Technical Videos, Elliott Wave Trade Setup Videos and we have a 24 Chat Room. Our clients are always in the loop for the next market move.
Try Elliottwave-Forecast for 14 days FREE !!! Just click here –> 14 day FREE trial
Back


