Trading a currency basket allows a trader to see the overall strength or weakness of the certain currency. Tracking a currency basket also allows a trader to search and enter multiple trading entries, meaning if a certain currency is showing strength or weakness, you can be sure that it is showing it’s strength or weakness across the board against other currencies. The charts below shows breakout patterns and other trading strategies to confirm which side to trade which was Aussie weakness this past trading week (January 26/2020 – January 31/2020).
A trader should never trade off one strategy and should always combine strategies together to get a better read of the market.
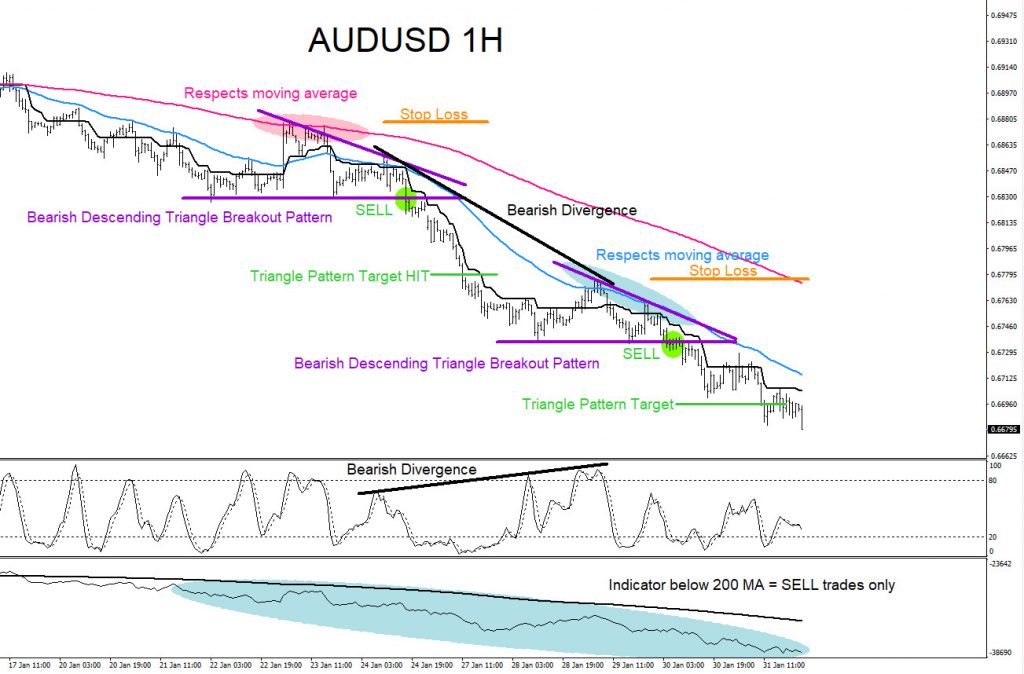
AUDUSD 1 Hour Chart 1.31.2020 : Bearish triangle breakout patterns were visible and triggered SELLS January 24 and 30/2020 eventually hitting the pattern targets. Other bearish strategies also signalled a trader that the move would be to the downside.
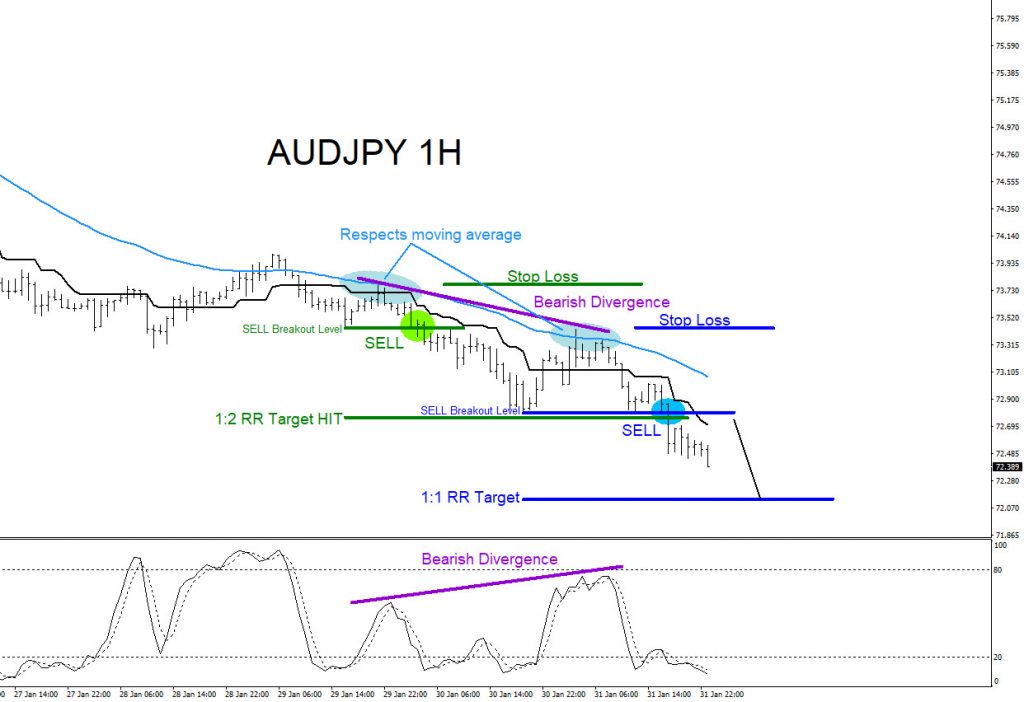
AUDJPY 1 Hour Chart 1.31.2020 : Aussie weakness was also visible in the AUDJPY pair. Bearish Momentum Price Action Breakouts triggered SELLS January 30/2020 and January 31/2020. 1st green entry HIT target and expecting to see 2nd blue entry HIT target in the coming trading week. Other bearish strategies also signalled a trader that the move would be to the downside.
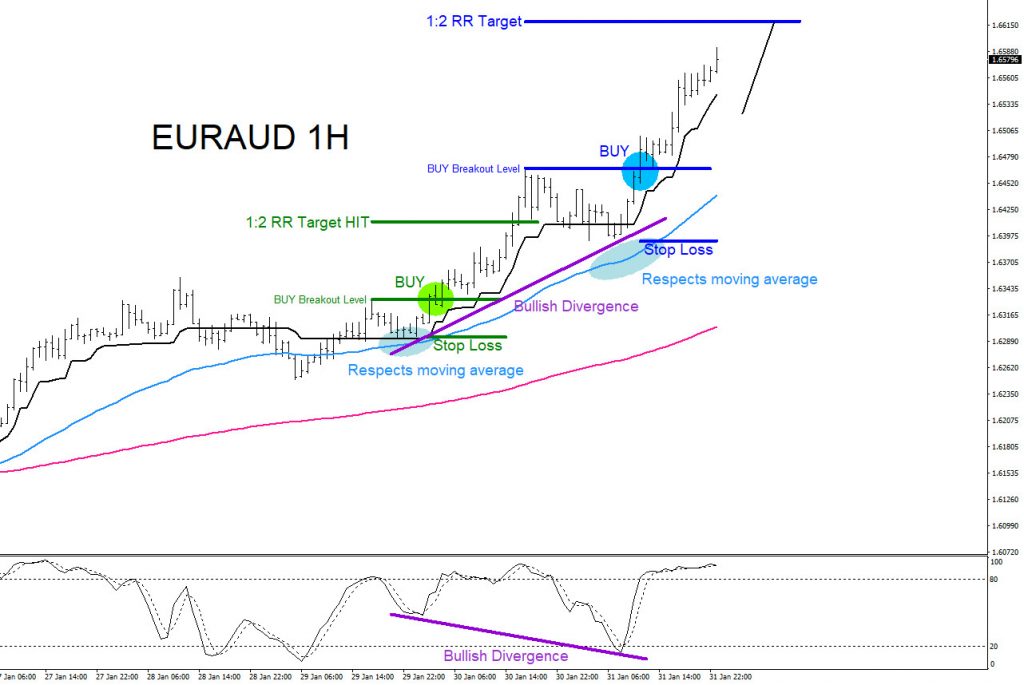
EURAUD 1 Hour Chart 1.31.2020 : Aussie weakness was also visible in the EURAUD pair. Bullish Momentum Price Action Breakouts triggered BUYS January 30/2020 and January 31/2020. 1st green entry HIT target and expecting to see 2nd blue entry HIT target in the coming trading week. Other bullish strategies also signalled a trader that the move would be to the upside.
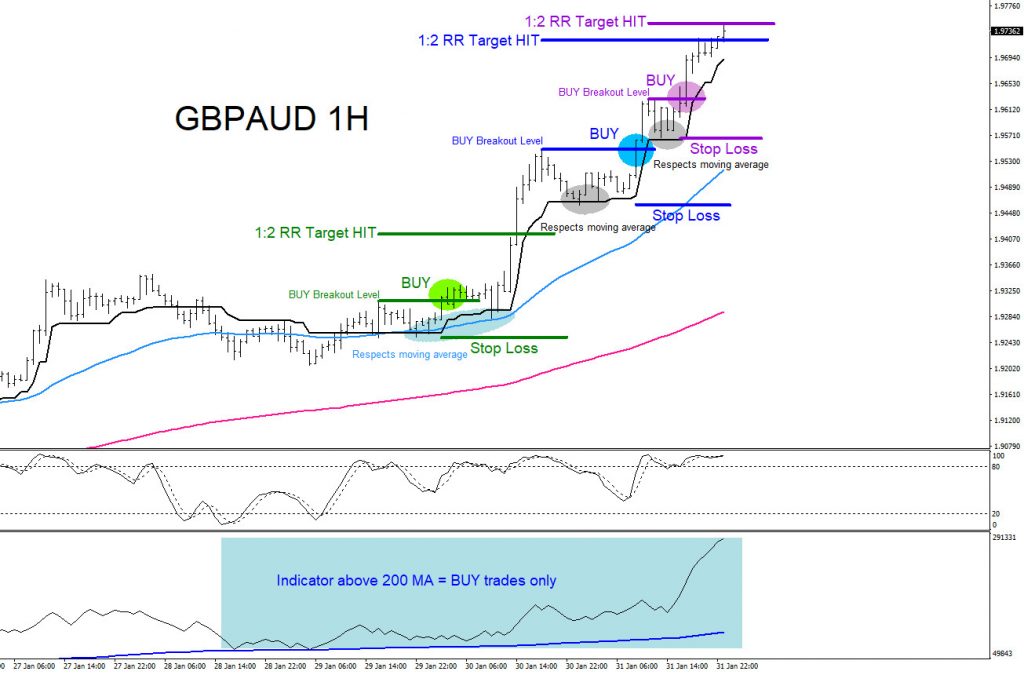
GBPAUD 1 Hour Chart 1.31.2020 : Aussie weakness was also visible in the GBPAUD pair. Bullish Momentum Price Action Breakouts triggered BUYS January 30/2020 and January 31/2020. All 3 BUY entries HIT their targets. Other bullish strategies also signalled a trader that the move would be to the upside.
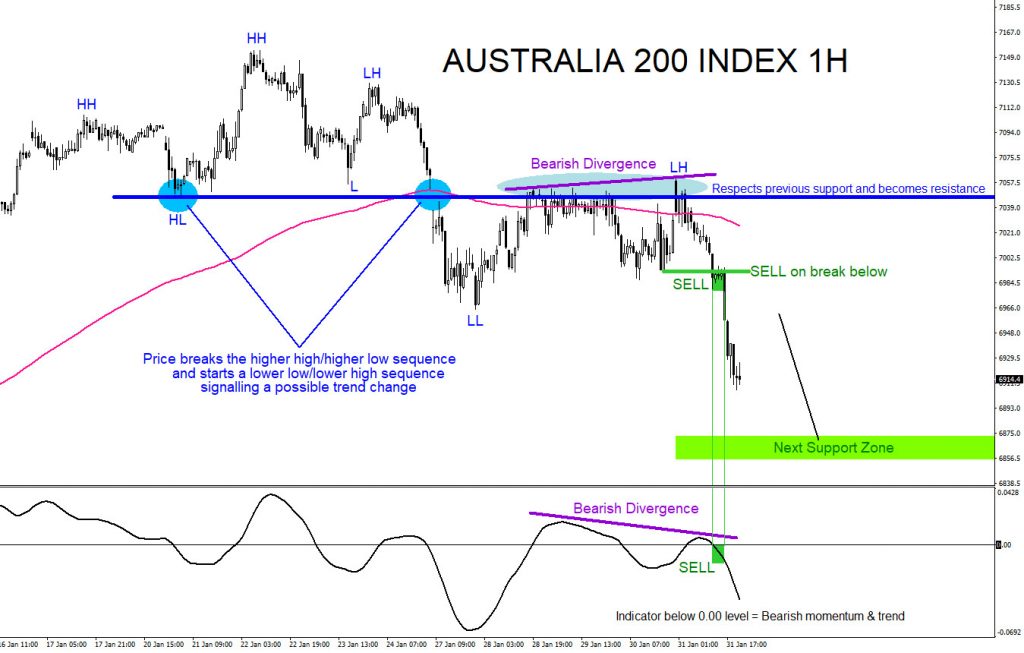
AU200 1 Hour Chart 1.31.2020 : The Australian 200 Index also showed a bearish sentiment. Bearish Divergence was visible and occurred perfectly at the Support/Resistance zone triggering more sellers to enter the market on the break lower January 31/2020. Expecting price to continue lower towards the next support level. Other bearish strategies also signalled a trader that the move would be to the downside.
Of course, like any strategy/technique, there will be times when the strategy/technique fails so proper money/risk management should always be used on every trade. Hope you enjoyed this article and follow me on Twitter for updates and questions> @AidanFX or chat me on Skype > EWF Aidan Chan
*** Always use proper risk/money management according to your account size ***
At Elliottwave-Forecast we cover 78 instruments (Forex, Commodities, Indices, Stocks and ETFs) in 4 different timeframes and we offer 5 Live Session Webinars everyday. We do Daily Technical Videos, Elliott Wave Trade Setup Videos and we have a 24 hour Chat Room. Our clients are always in the loop for the next market move.
Try Elliottwave-Forecast for 14 days FREE !!! Just click here –> 14 day FREE trial
Back