
-

EURNZD : Bearish Market Patterns Signalling the Move Lower
Read MoreOn February 12/2021 EURNZD was showing bearish market patterns that was signalling traders that there was a high probability that the pair could make a move lower. The pair has been trending and moving lower since the March 2020 peak high and we at EWF always advise our members to trade with the trend and […]
-
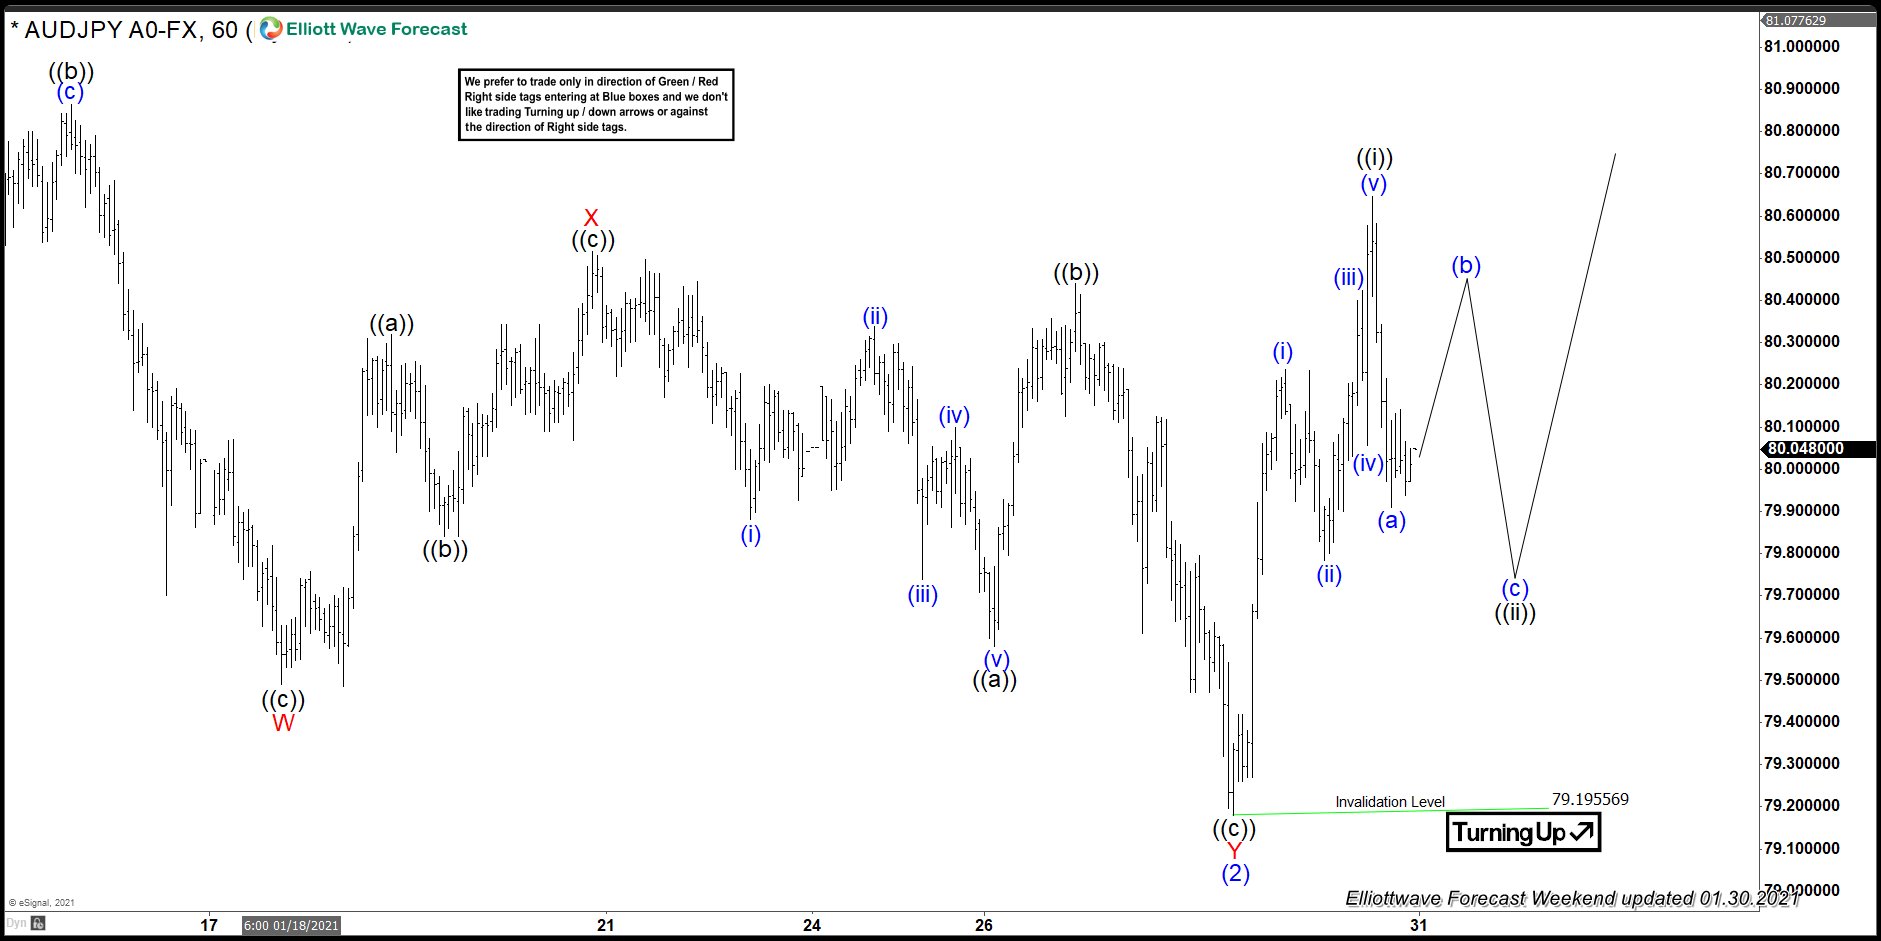
AUDJPY Moves Higher as Expected
Read MoreThe AUDJPY chart below was posted in the EWF members only area January 30/2021 (Weekend update) showing any dips should be looked at as buying opportunities against the invalidation level at 79.19. Wave count was calling for another push lower where the wave ((ii)) black should terminate which would signal for buyers to get in […]
-
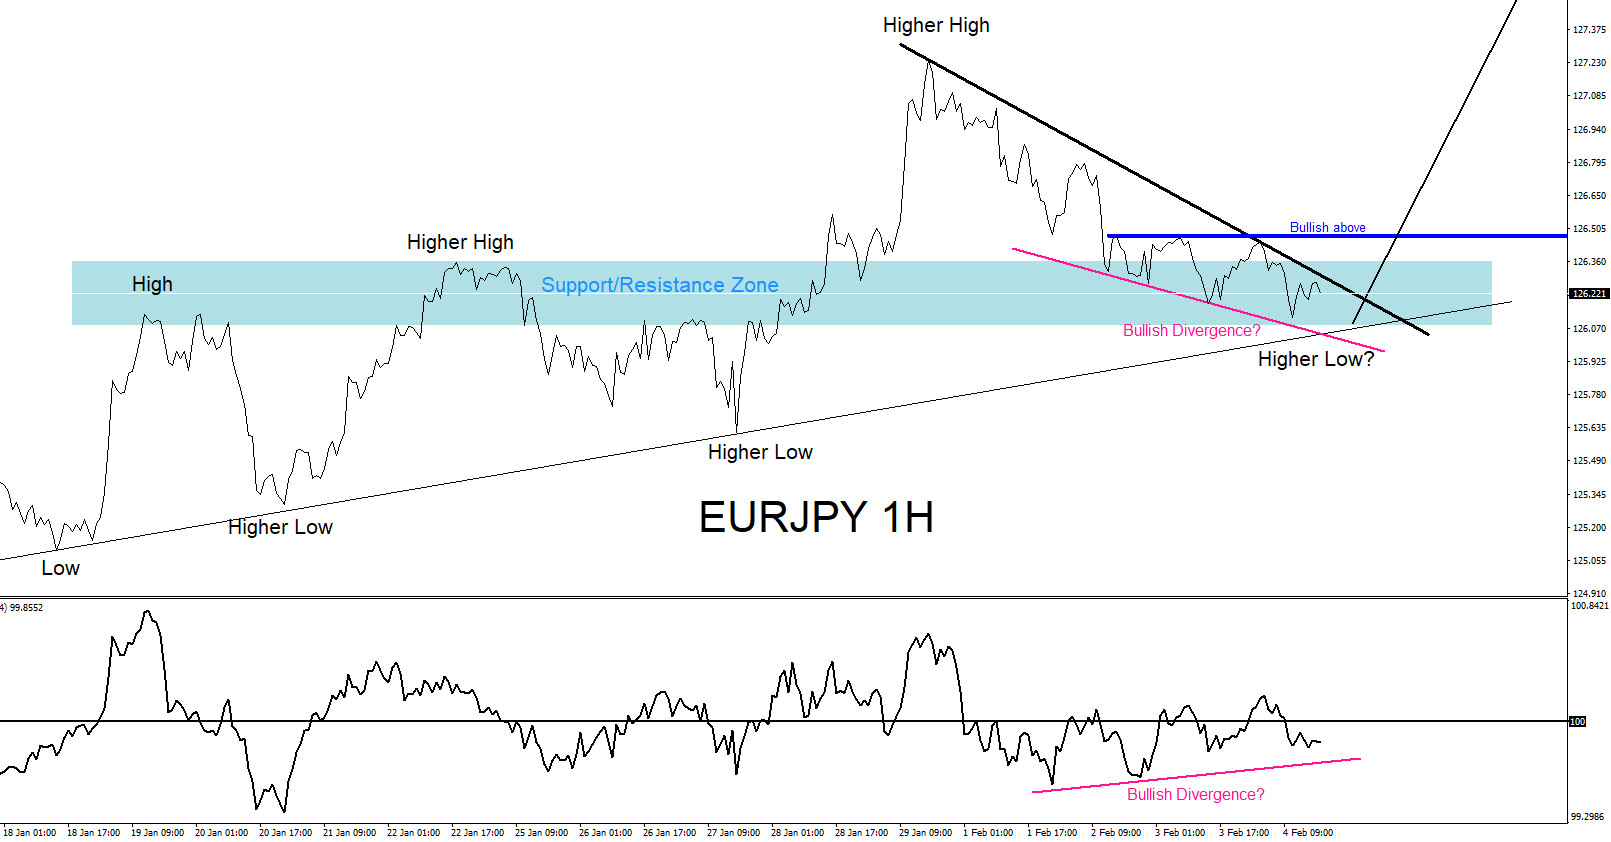
EURJPY : Expecting More Upside
Read MoreOn February 2/2021 I posted on social media @AidanFX “EURJPY as long price stays above 125.59 the pair can push higher.” and “GBPJPY EURJPY will be watching for buying opportunities. Both pairs can push higher.“ The chart below was also posted on social media @AidanFX February 4/2021 showing that EURJPY was entering a zone where the pair can […]
-
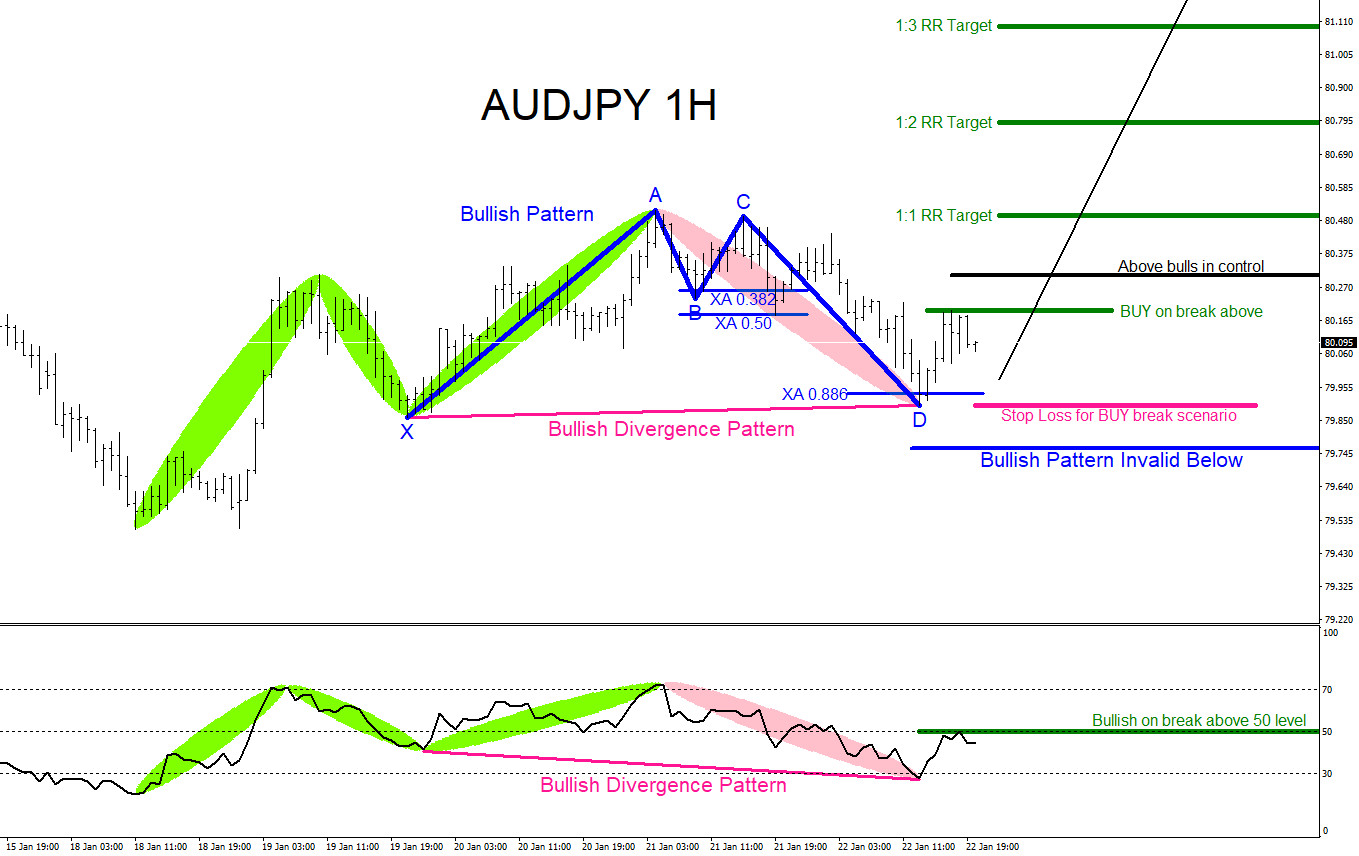
AUDJPY : Will the Pair Move Higher?
Read MoreIn the chart below there are clear visible bullish market patterns that are calling for another move higher for the AUDJPY pair. Blue bullish market pattern already triggered BUYS at the XA 0.886% Fib. retracement level. Also a bullish trend continuation divergence pattern (pink) has formed at the same XA 0.886% level which is adding […]
-
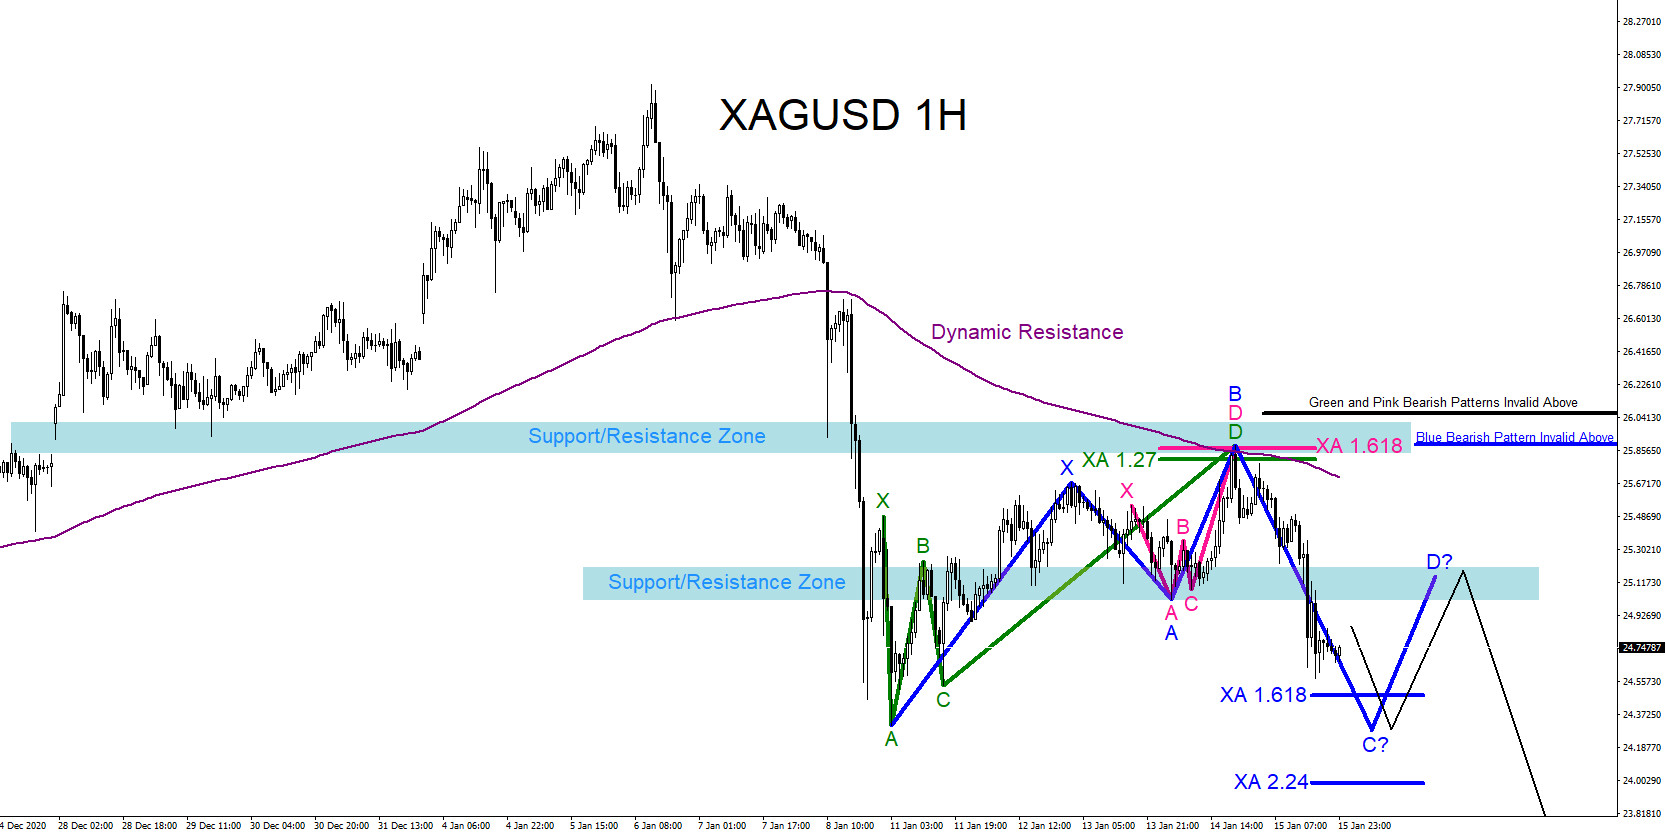
XAGUSD : Market Patterns Signalling More Downside
Read MoreOn January 14/2021 XAGUSD hit a confluence zone where the pair reversed lower. Price hit an area where different market patterns and technical levels aligned which allowed sellers to push silver lower. In the chart below it is clearly visible that on January 14/2021 price found resistance at the previous support zone (light blue) and […]
-
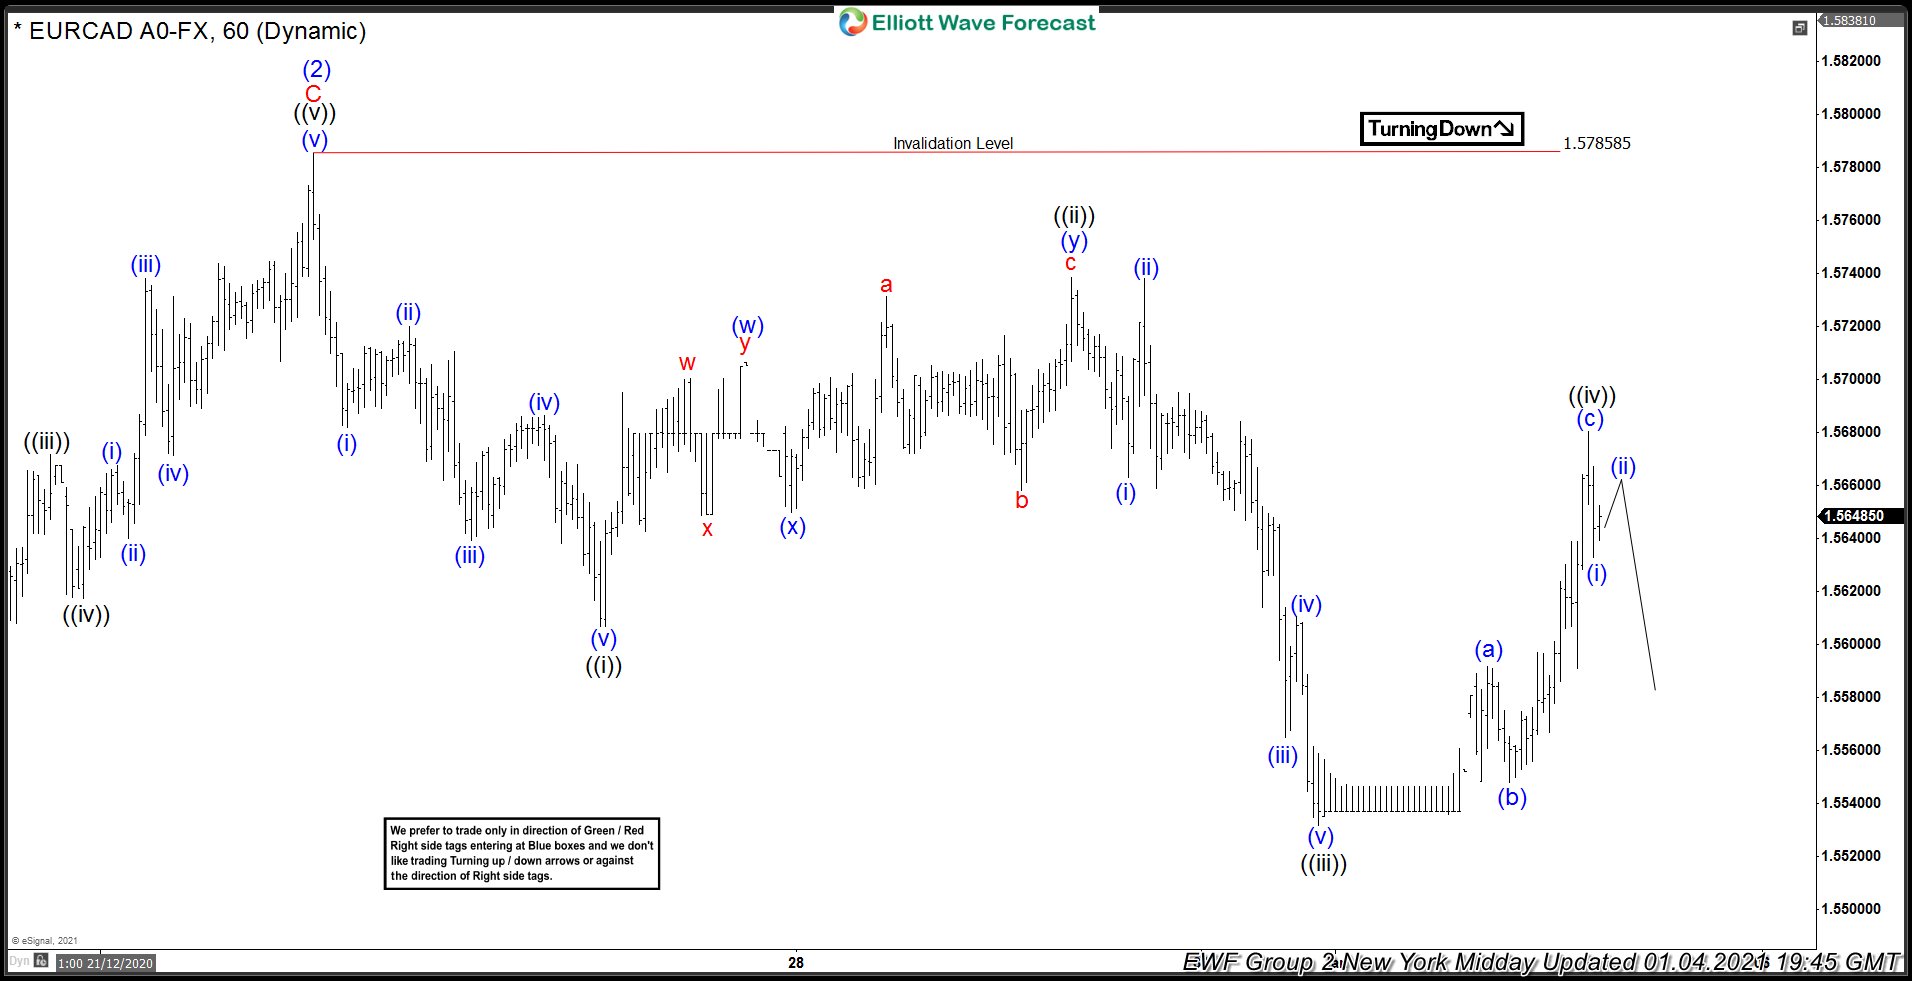
EURCAD : Trading the Downside Move
Read MoreOn January 4 2021 we advised traders, in our members area, that EURCAD was in a position where the pair will make another move lower. Since December 22 2020, the pair has been pushing lower and has moved in a lower low/lower high sequence signalling a possible downside trend. EURCAD 1 Hour Chart New York […]