
-
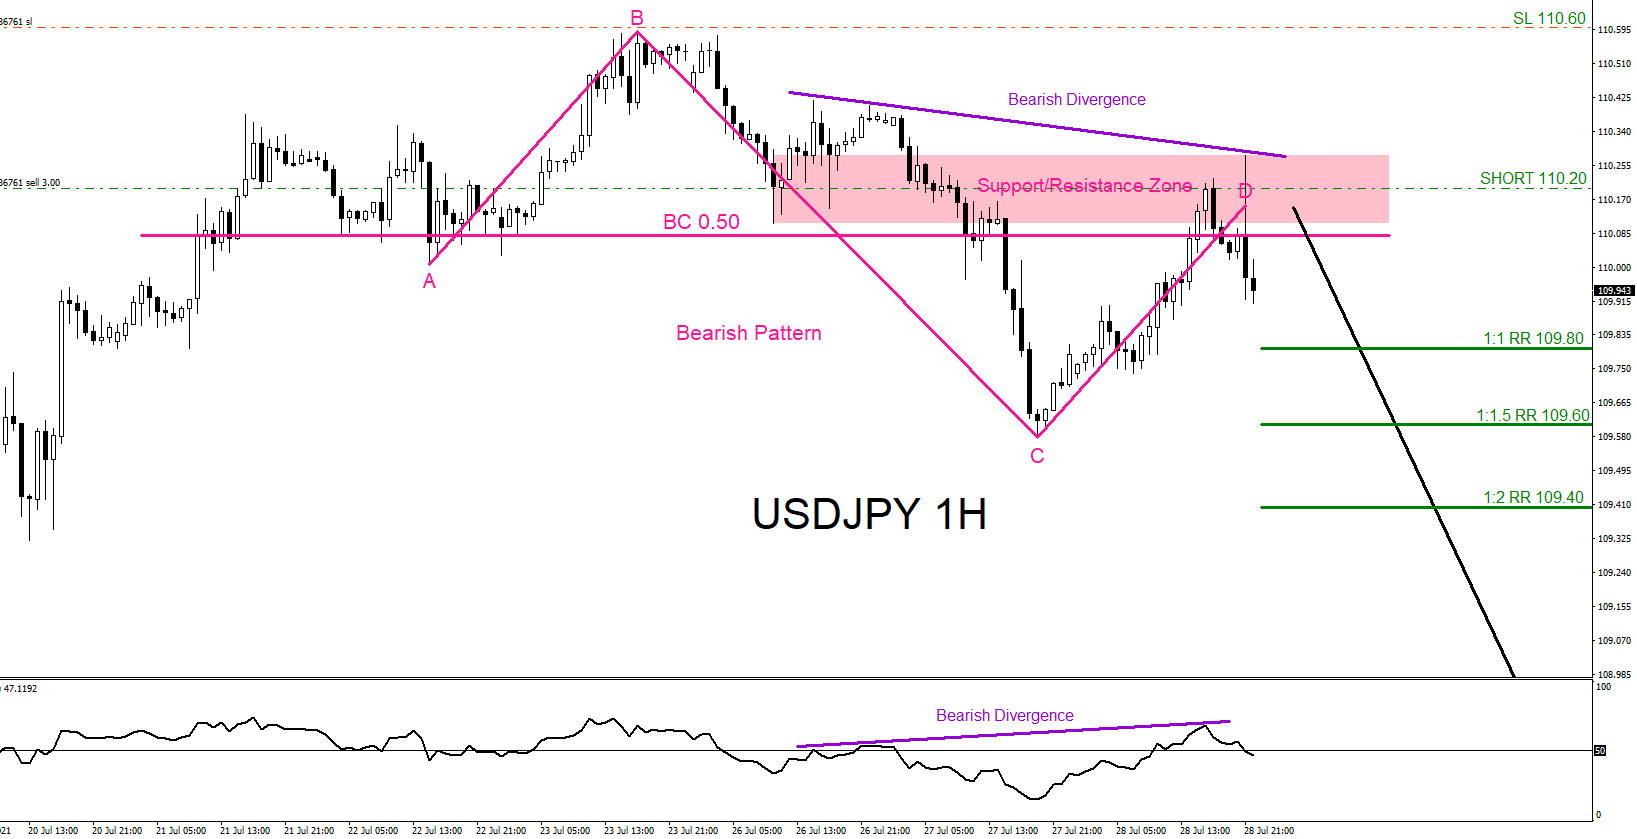
USDJPY : Bearish Market Patterns Calling the Move lower
Read MoreThe USDJPY chart below was posted on social media @AidanFX July 28 2021 showing a possible bearish market pattern where bears/sellers could be waiting to get in the market. The pink bearish pattern triggers SELLS at the BC 0.50% Fib. retracement level. Traders would need to be patient and wait for the pair to pullback […]
-
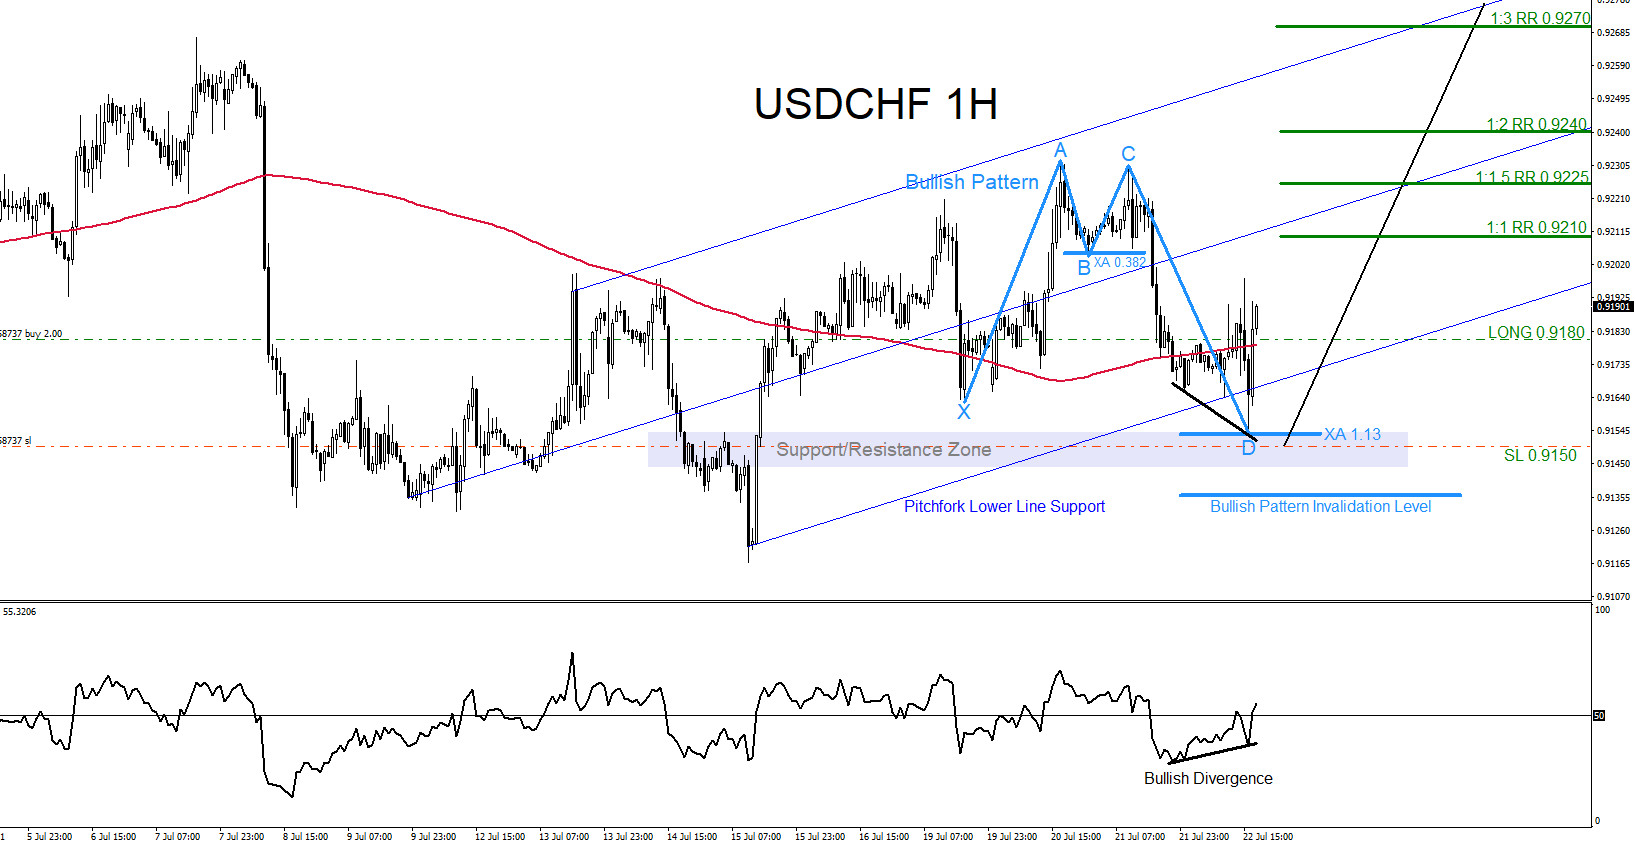
USDCHF : Will the Pair Continue Higher?
Read MoreThere are visible bullish patterns on the USDCHF 1 Hour time frame that can be signalling traders of a move higher. The light blue bullish market pattern already triggered buyers at the XA 1.13% Fib. retracement level and the pair has reacted with a push higher from this level. Price also found support from the […]
-
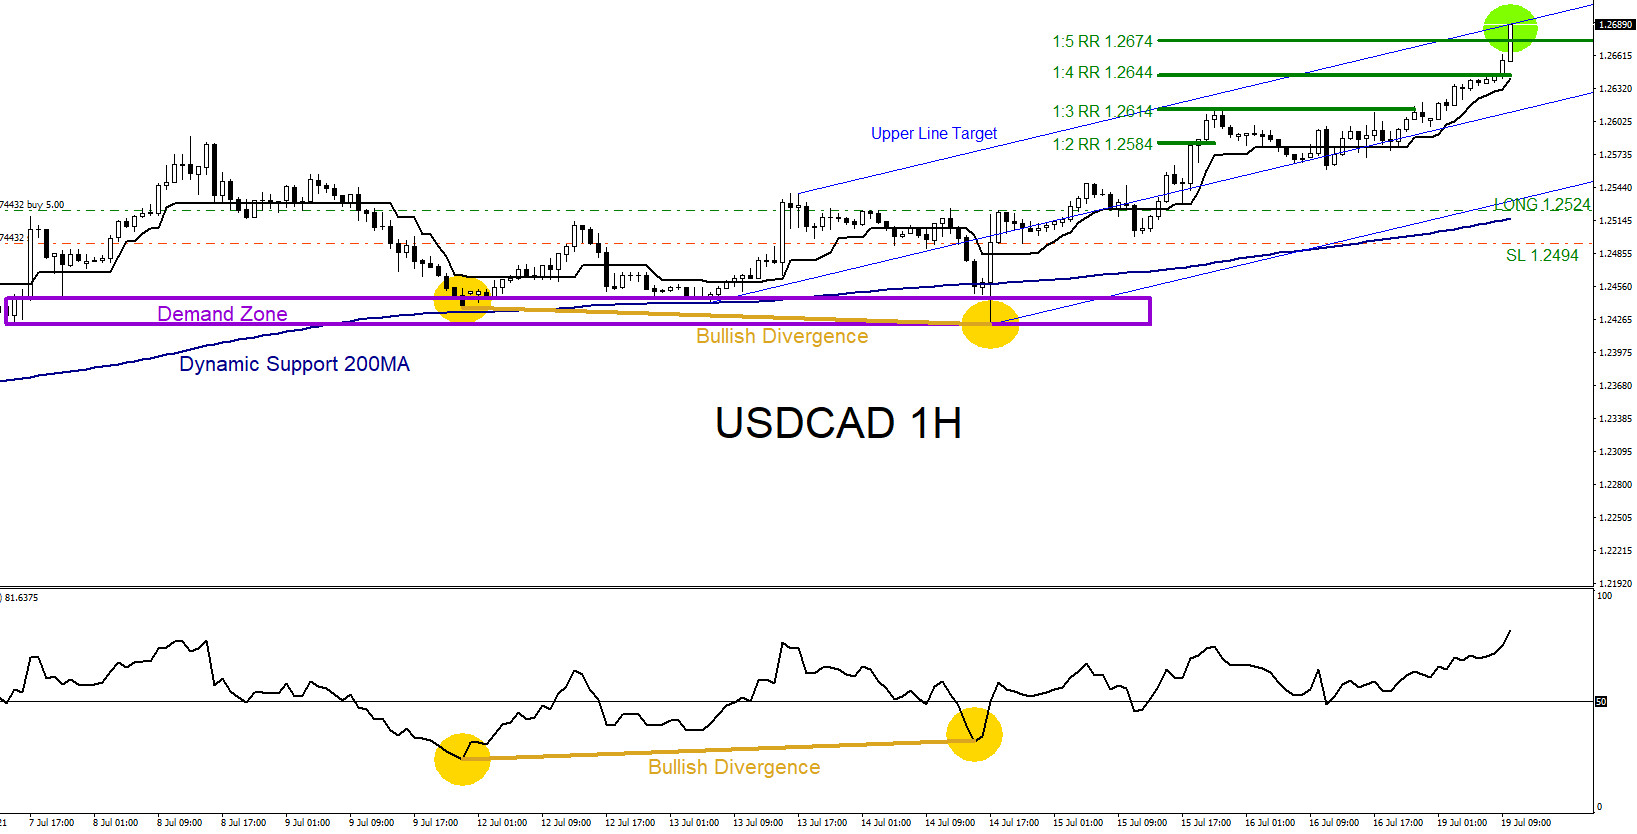
USDCAD Moves Higher as Expected
Read MoreOn July 14 2021 I posted on social media @AidanFX “USDCAD will push higher towards the 1.2574 – 1.2614 area. Look for BUYING opportunities.“ The chart below was also posted on social media @AidanFX July 15 2021 showing the possible bullish scenario. Price bounced off the Dynamic Support 200MA which also formed a bullish divergence pattern. […]
-
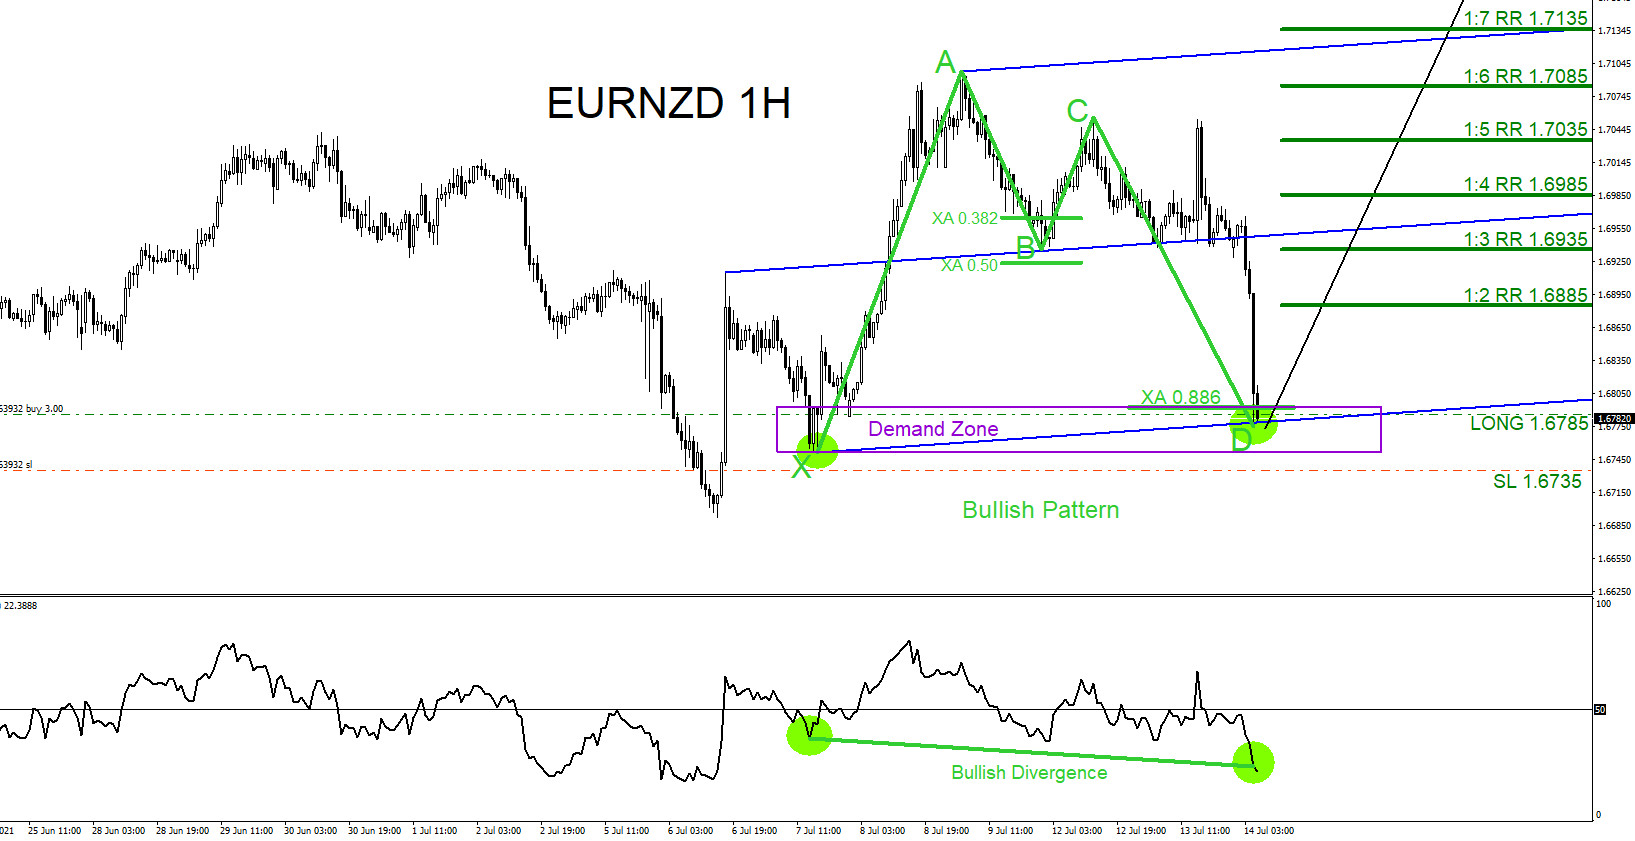
EURNZD : Bullish Patterns Calling for Move Higher
Read MoreThe EURNZD chart below was posted on social media @AidanFX July 13 2021 showing the possible bullish patterns. Green bullish pattern triggered BUYS at the XA 0.886% Fib. retracement level which was perfectly in the purple demand zone. More added reason the pair could push higher was a bullish divergence pattern also formed in the […]
-

EURNZD : Tracking and Trading the Move Lower
Read MoreOn July 1 2021 EURNZD was showing several bearish patterns that was signalling the pair would move lower. The pair was stalling at key pattern SELL trigger levels that was signalling traders that sellers/bears were getting in the market. The chart below shows a bearish pattern (blue) completing point D at the BC 0.50% Fib. […]
-
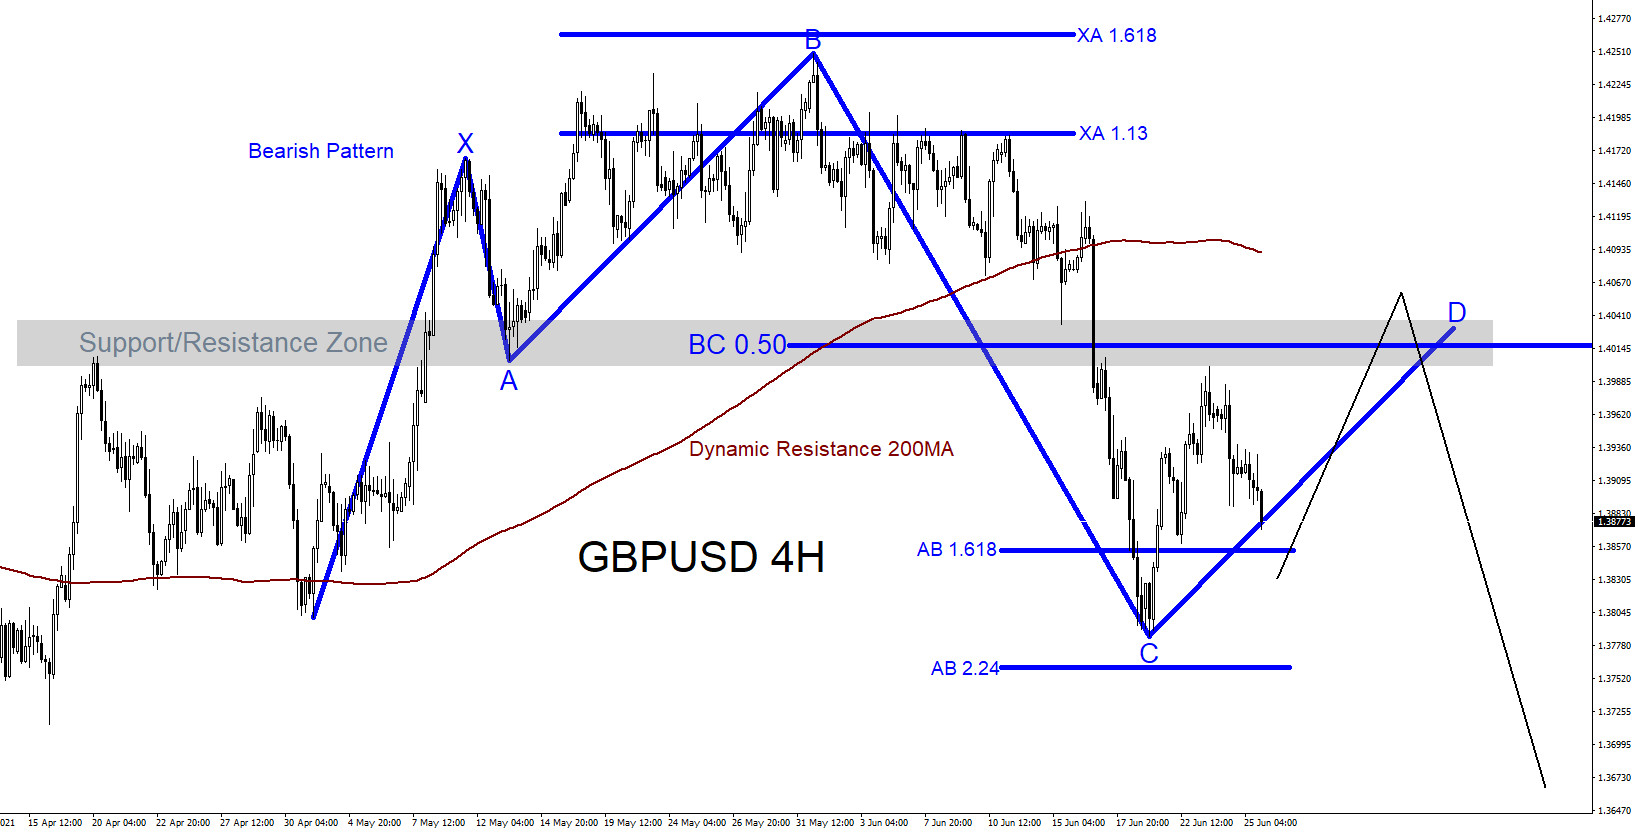
GBPUSD : Possible Bearish Pattern?
Read MoreA possible bearish pattern is visible on the GBPUSD 4 hour time frame. The blue bearish pattern still needs to make a push higher to complete point D at the BC 0.50% Fib. retracement level where GBPUSD can possibly find sellers to push the pair lower. The BC 0.50% Fib. level is also situated in […]