
-
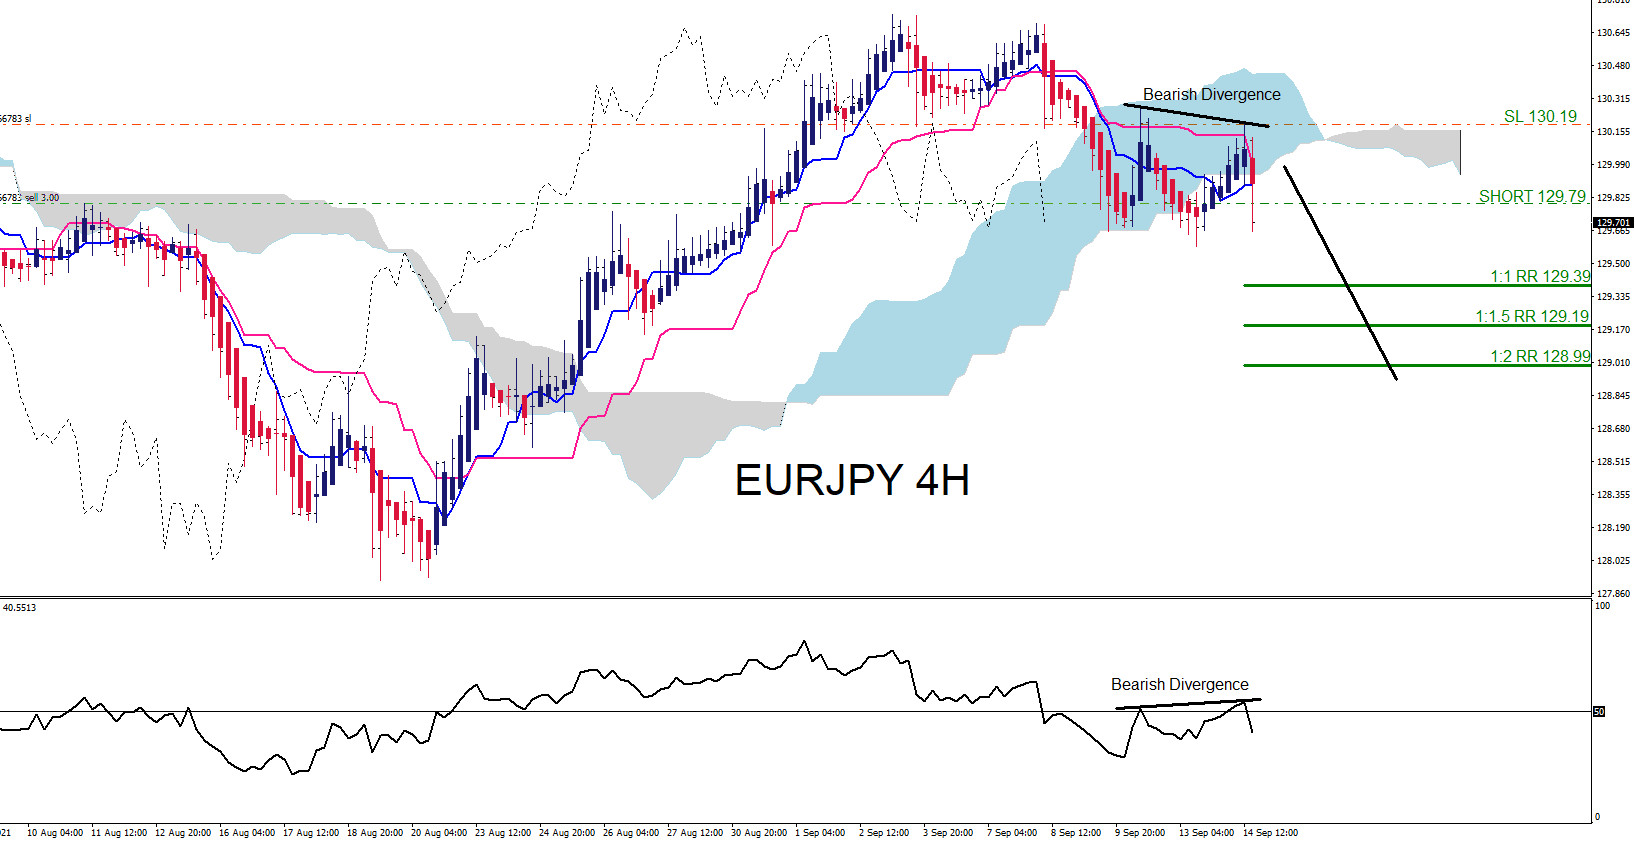
EURJPY : Trading the Move Lower
Read MoreOn September 14 2021 I posted on social media @AidanFX “EURJPY SHORT 129.79 Stop Loss 130.19 Target 129.39 – 128.99 area.“ The chart below was also posted on social media @AidanFX September 14 2021 showing the possible EURJPY bearish scenario. Price formed a bearish divergence pattern (black) on indicator and price on September 14 2021 and […]
-
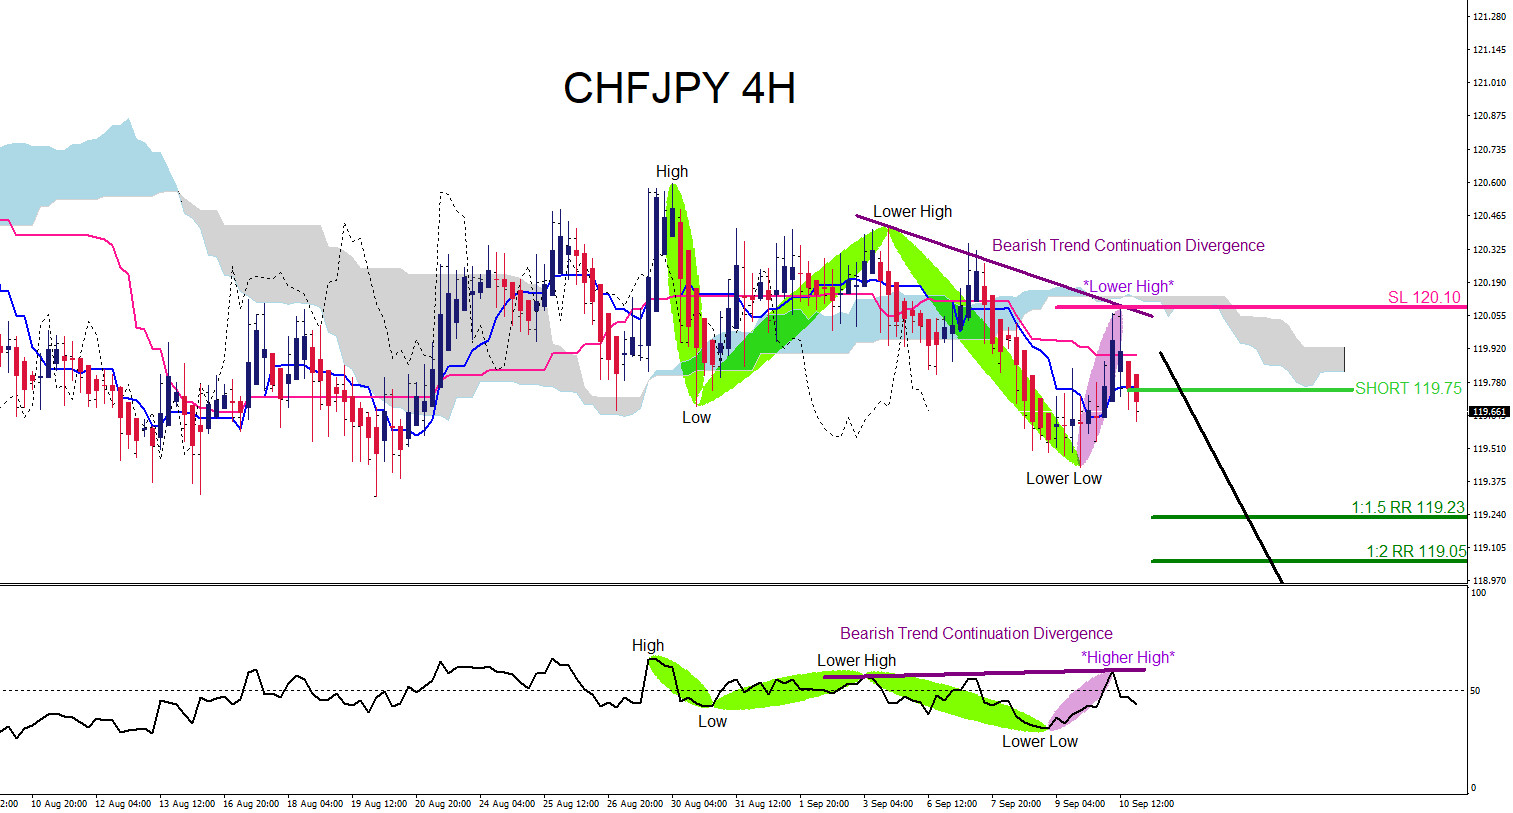
CHFJPY : Will the Pair Dip Lower?
Read MoreOn September 12 2021 I posted on social media @AidanFX “ CHFJPY for coming trading week watch for selling opportunities as long price remains below 120.10 looking for a move lower towards 119.23 – 119.05 area. “ CHFJPY can be getting ready for a possible dip lower. In the 4 hour chart below, it is visible […]
-
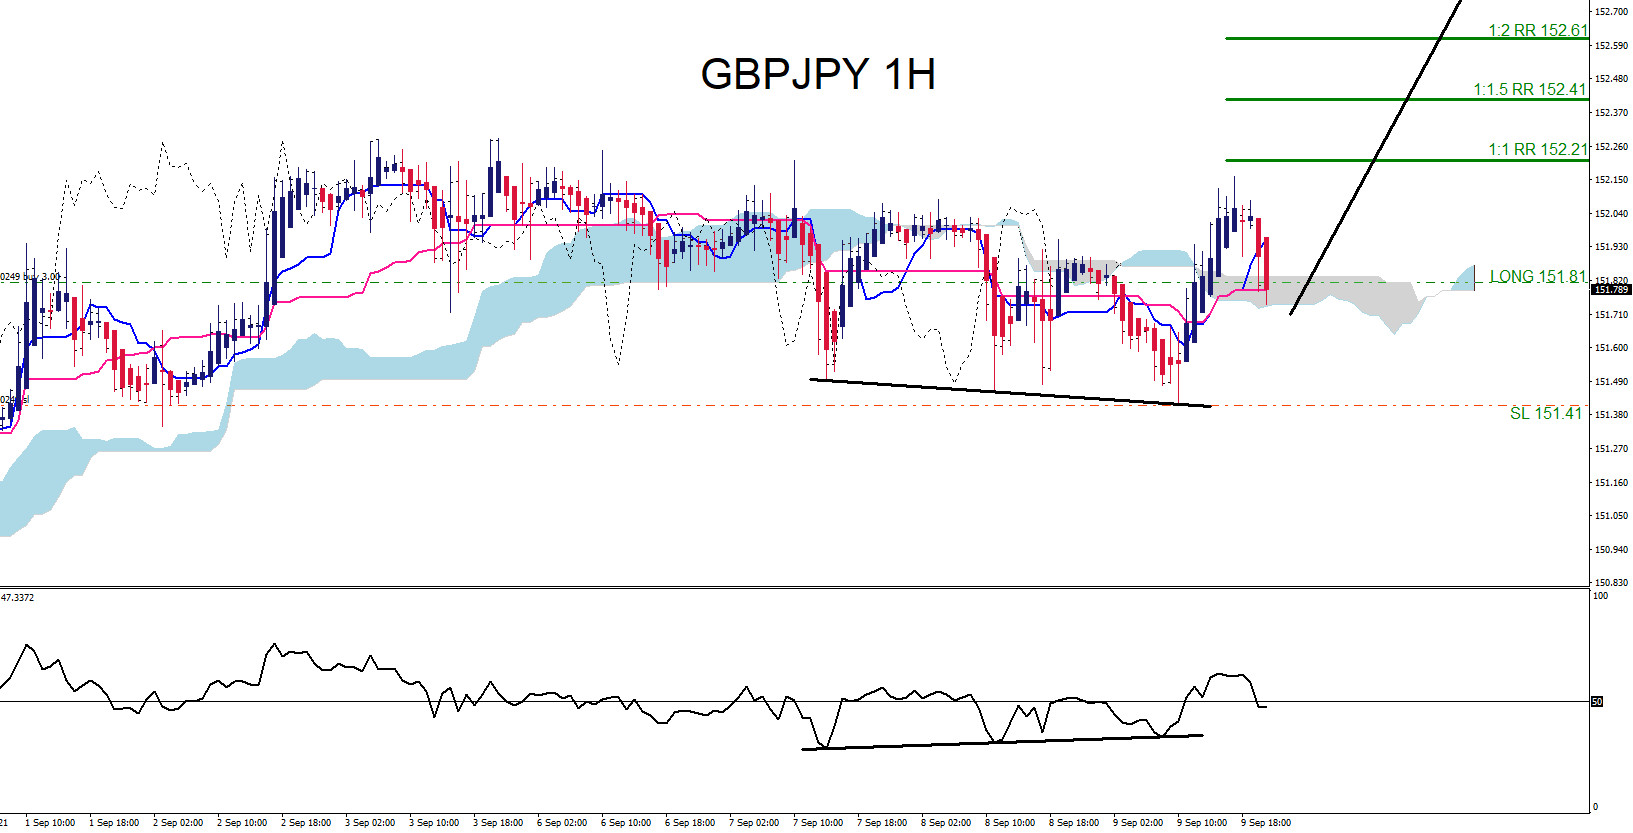
GBPJPY Moves Higher as Expected
Read MoreOn September 9 2021 I posted on social media @AidanFX “GBPJPY will be watching for buying opportunities for a move higher towards the 152.20 – 152.60 area.“ The chart below was also posted on social media @AidanFX September 9 2021 showing the possible GBPJPY bullish scenario. Price formed a bullish divergence pattern (black) on indicator and […]
-
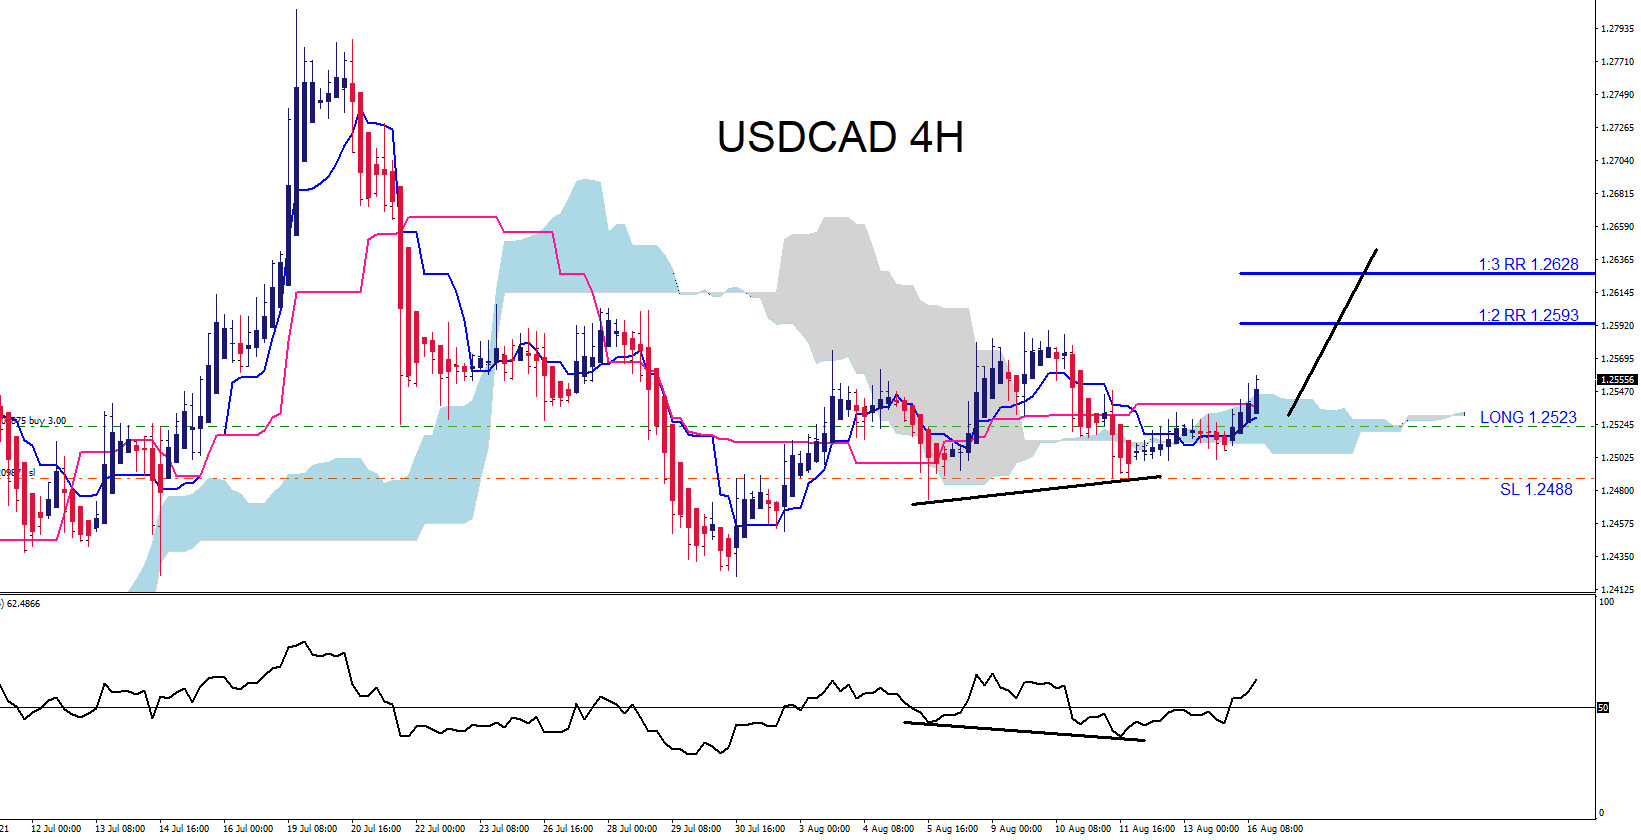
USDCAD Rallies Higher as Expected
Read MoreThe USDCAD 4 Hour chart below was posted on social media @AidanFX August 16 2021 showing the possible bullish scenario. Both price and indicator formed a bullish divergence pattern signalling a trend continuation. Since the July 30 2021 low the pair has moved higher in a higher high/higher low sequence confirming an upside trend was in […]
-
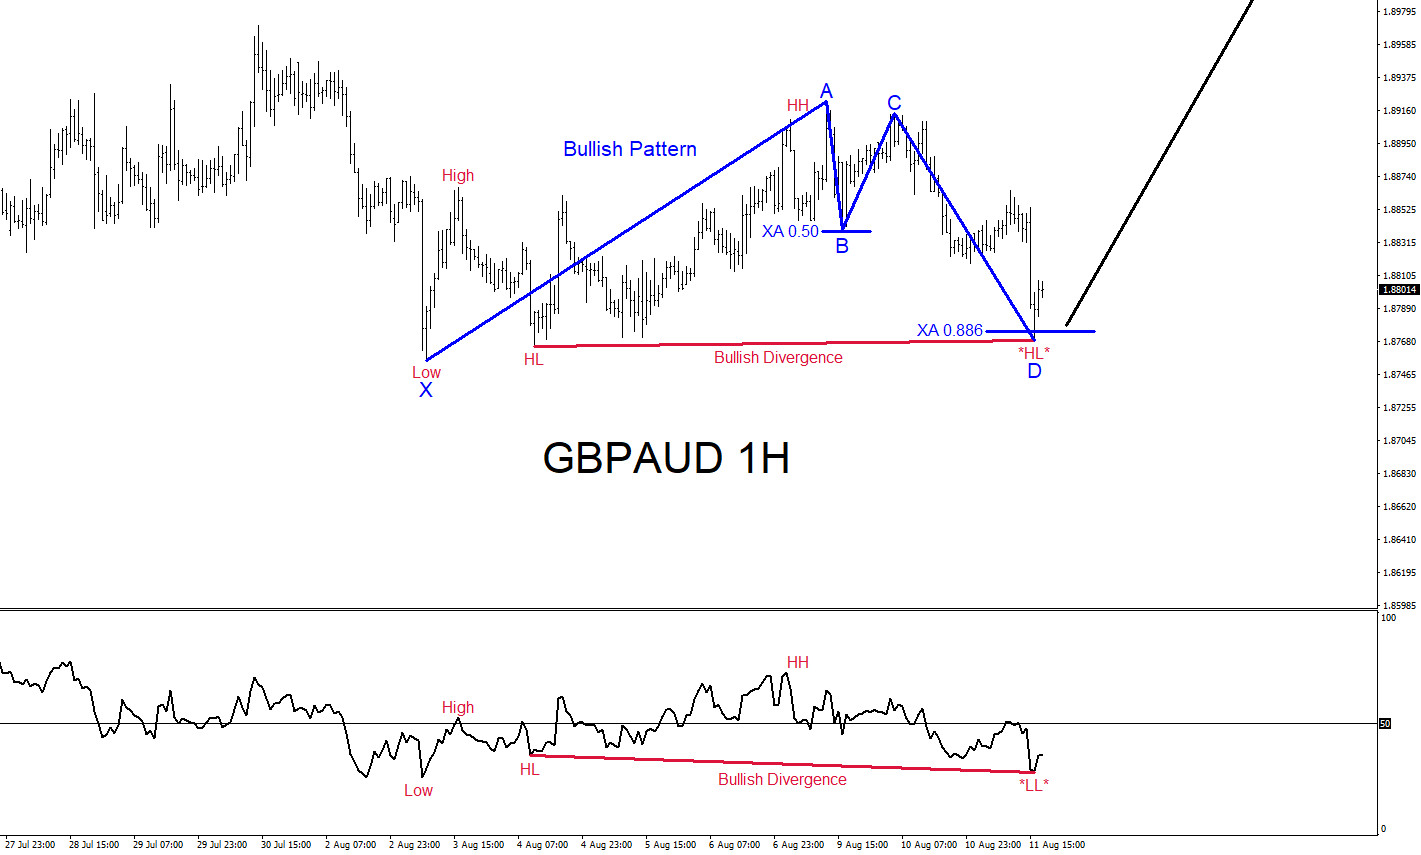
GBPAUD : Bullish Patterns Calling for Move Higher
Read MoreThe GBPAUD chart below was posted on social media @AidanFX August 11 2021 showing the possible bullish patterns. Blue bullish pattern triggered BUYS at the XA 0.886% Fib. retracement level. More evidence the pair could push higher was a bullish divergence pattern (red) also formed in the same area where the XA 0.886% level triggered […]
-
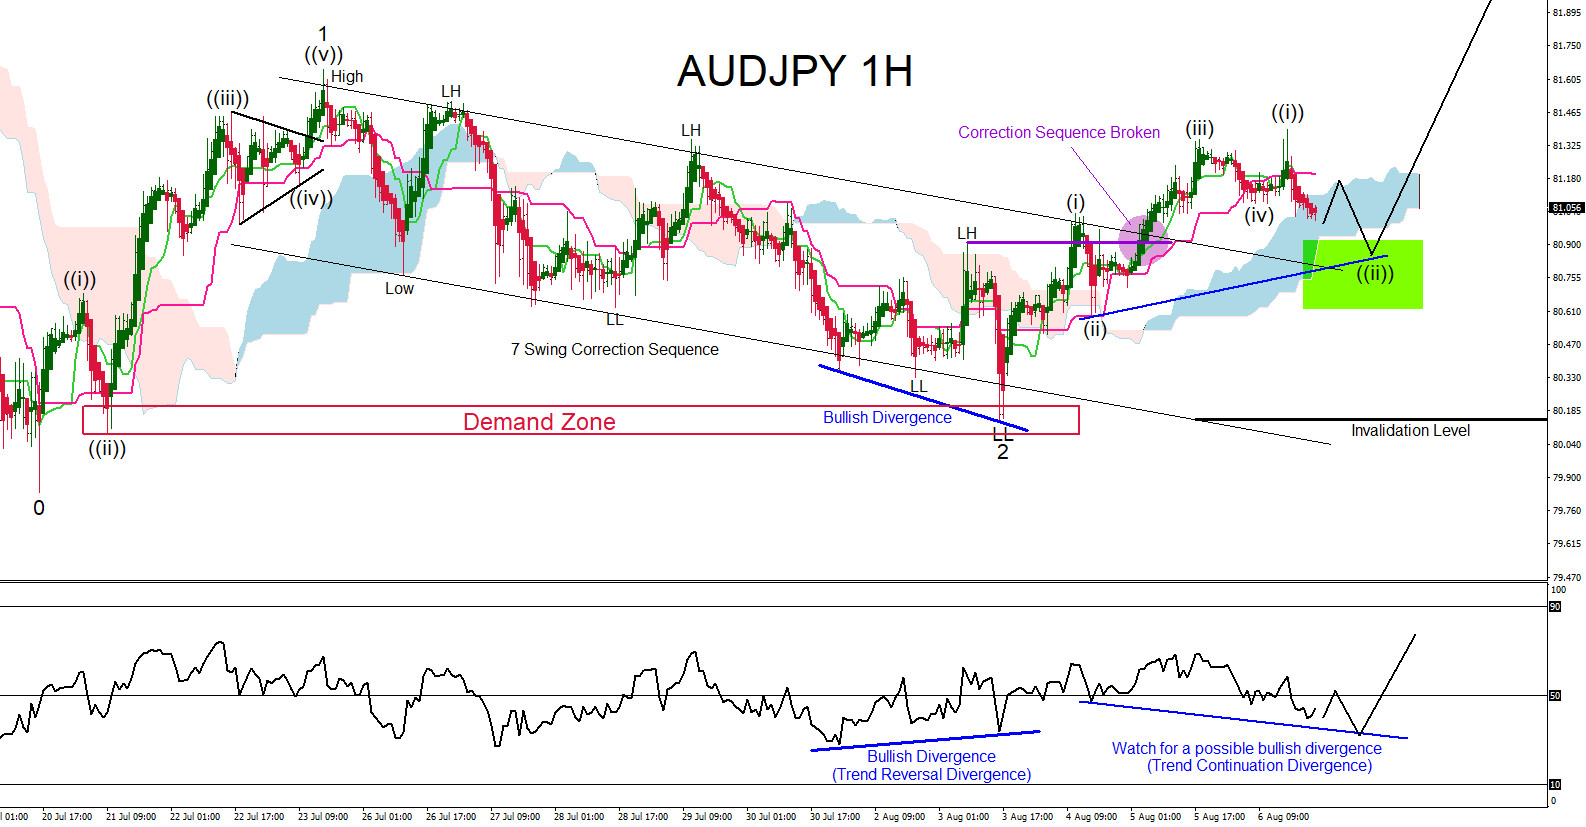
AUDJPY : Will the Pair Rally Higher?
Read MoreAUDJPY can be getting ready for a possible rally higher. In the 1 hour chart below, it is visible that the pair found a bottom/support at the Demand Zone signalling the proposed wave 2 has terminated. The pair was in correction lower from the July 23 2021 impulse wave 1. The correction lower was in […]