
-
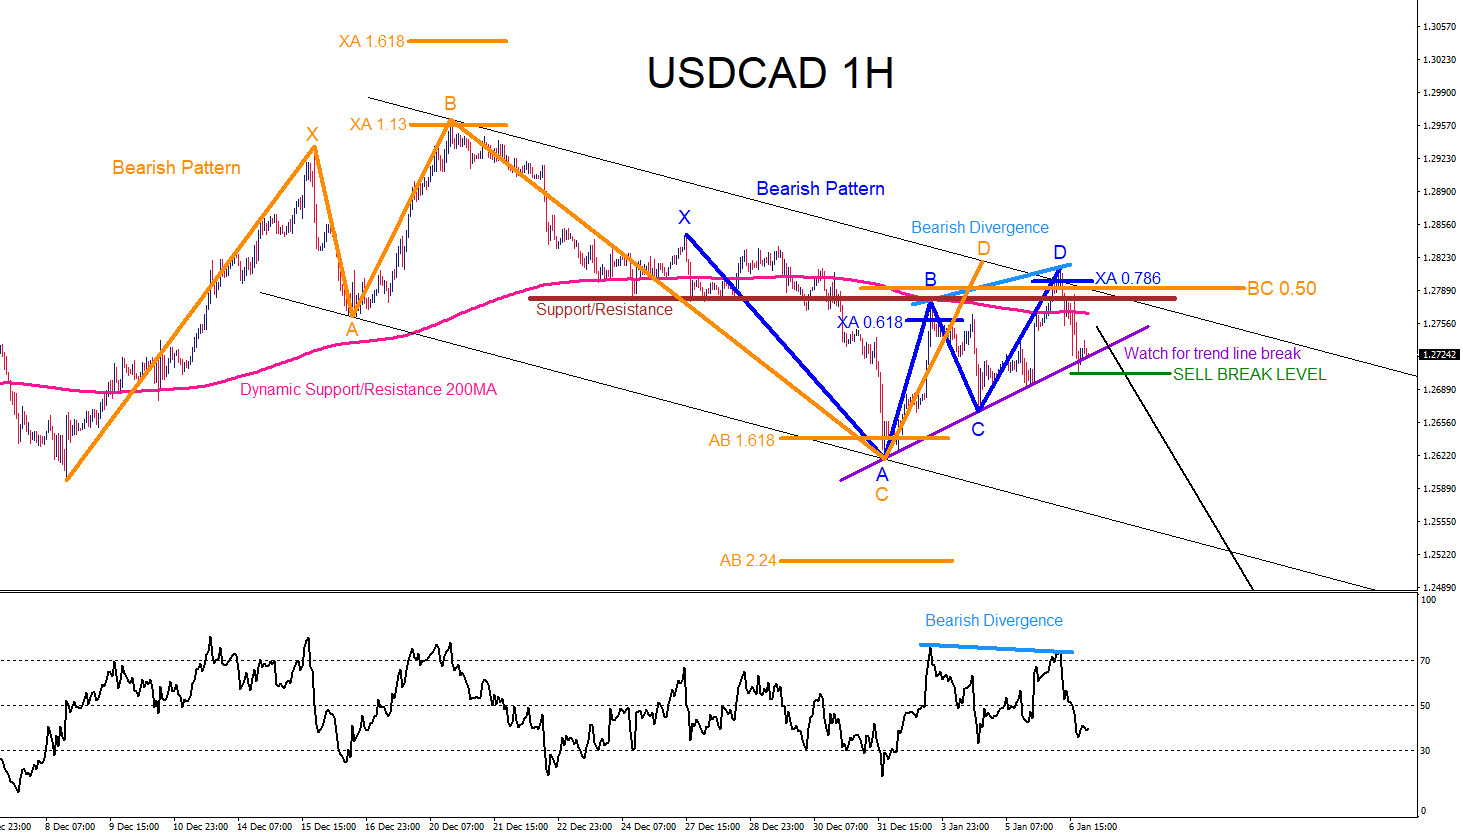
USDCAD : Market Patterns Signalled the Move Lower
Read MoreThe USDCAD 1 Hour chart below was posted on social media @AidanFX January 6 2022 showing the possible SELL scenario. Both price and RSI indicator formed a bearish divergence pattern (Light Blue) signalling a down trend continuation. Bearish market patterns, blue and orange, also terminated point D’s in the same area where the bearish divergence formed. […]
-
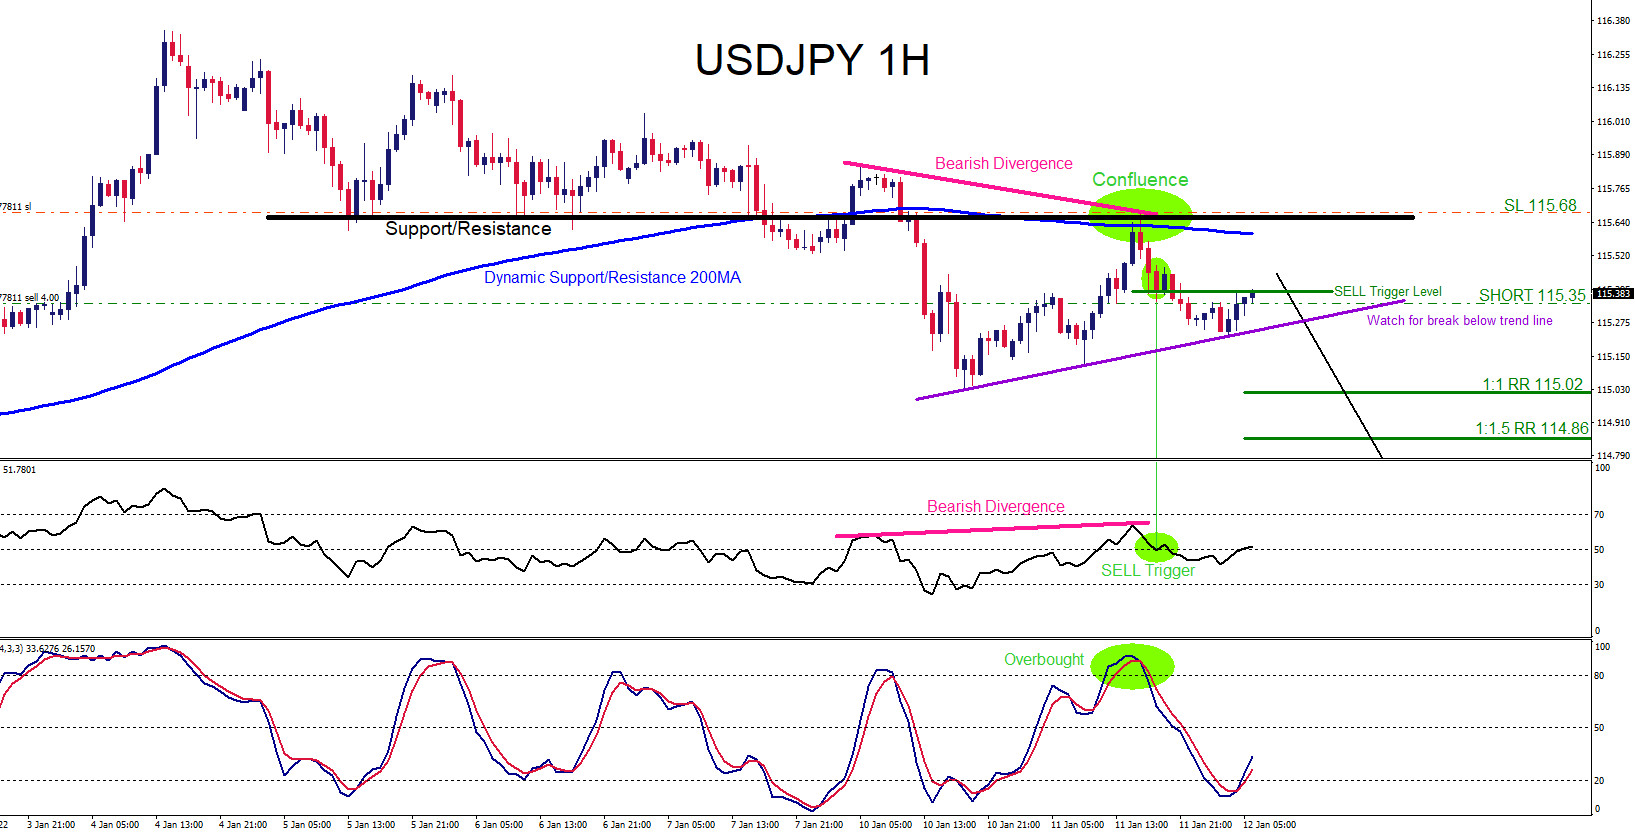
USDJPY : Trading the Move Lower
Read MoreOn January 11 2022 I posted on social media @AidanFX “ USDJPY SHORT/SELL at 115.35 SL/Stop Loss at 115.68 TP/Take Profit at the 115.02-114.85 area.“ Confluence trading is a combination of two or more trading strategies/techniques that come together and form a high probability buy/sell zone in a certain area in the market. Market patterns […]
-
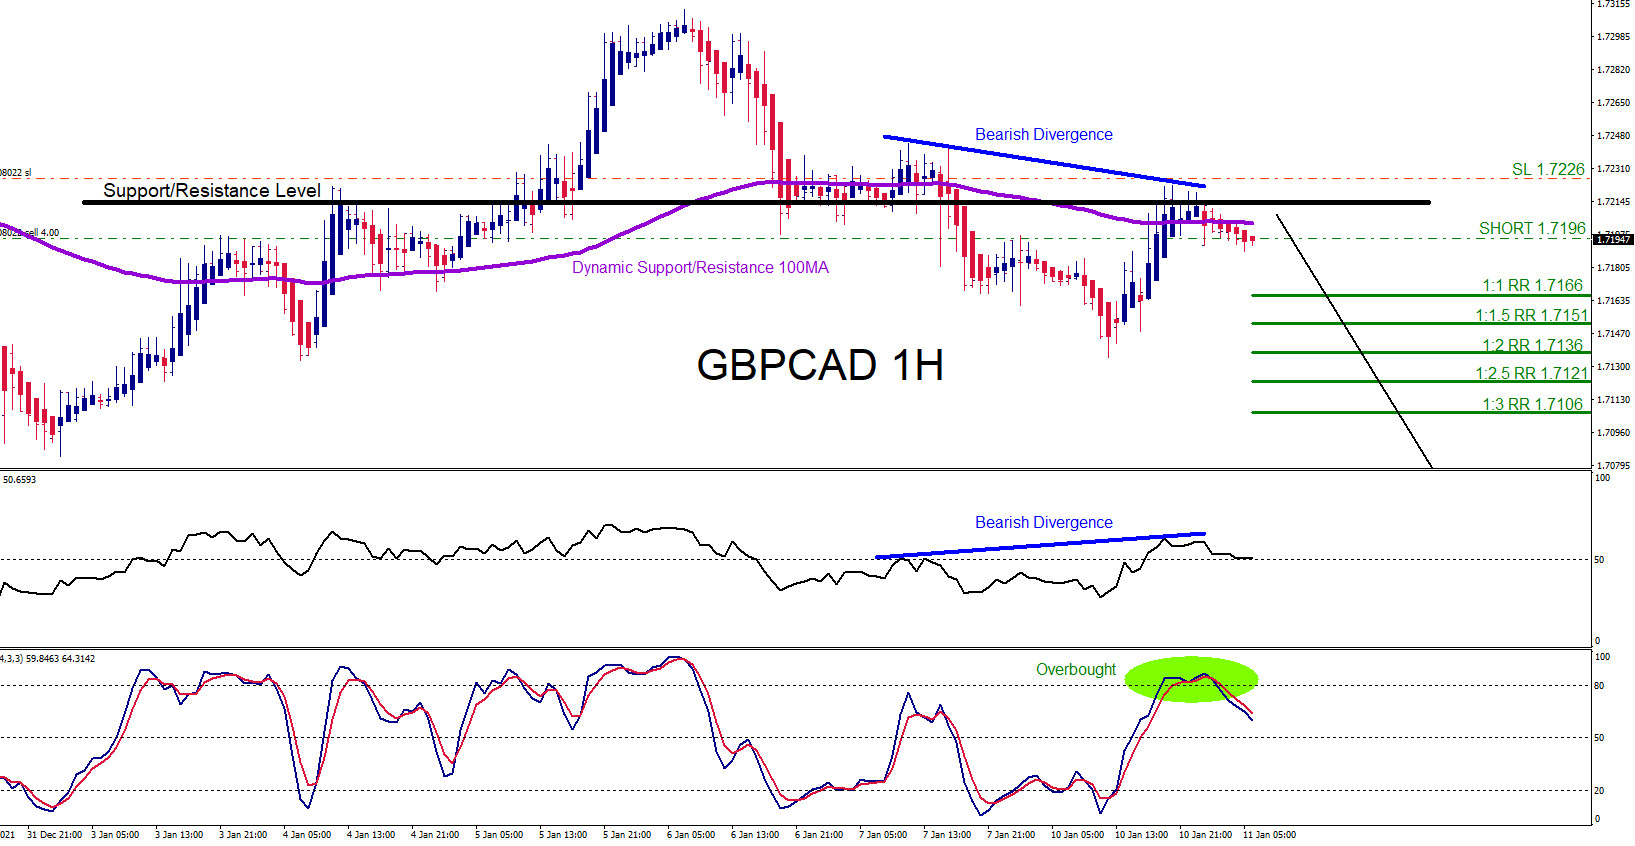
GBPCAD : Trading the Move Lower
Read MoreOn January 10 2022 I posted on social media @AidanFX “ GBPCAD SHORT/SELL at 1.7196 SL/Stop Loss at 1.7226 TP/Take Profit at the 1.7151-1.7136 area.“ Confluence trading is a combination of two or more trading strategies/techniques that come together and form a high probability buy/sell zone in a certain area in the market. Market patterns […]
-
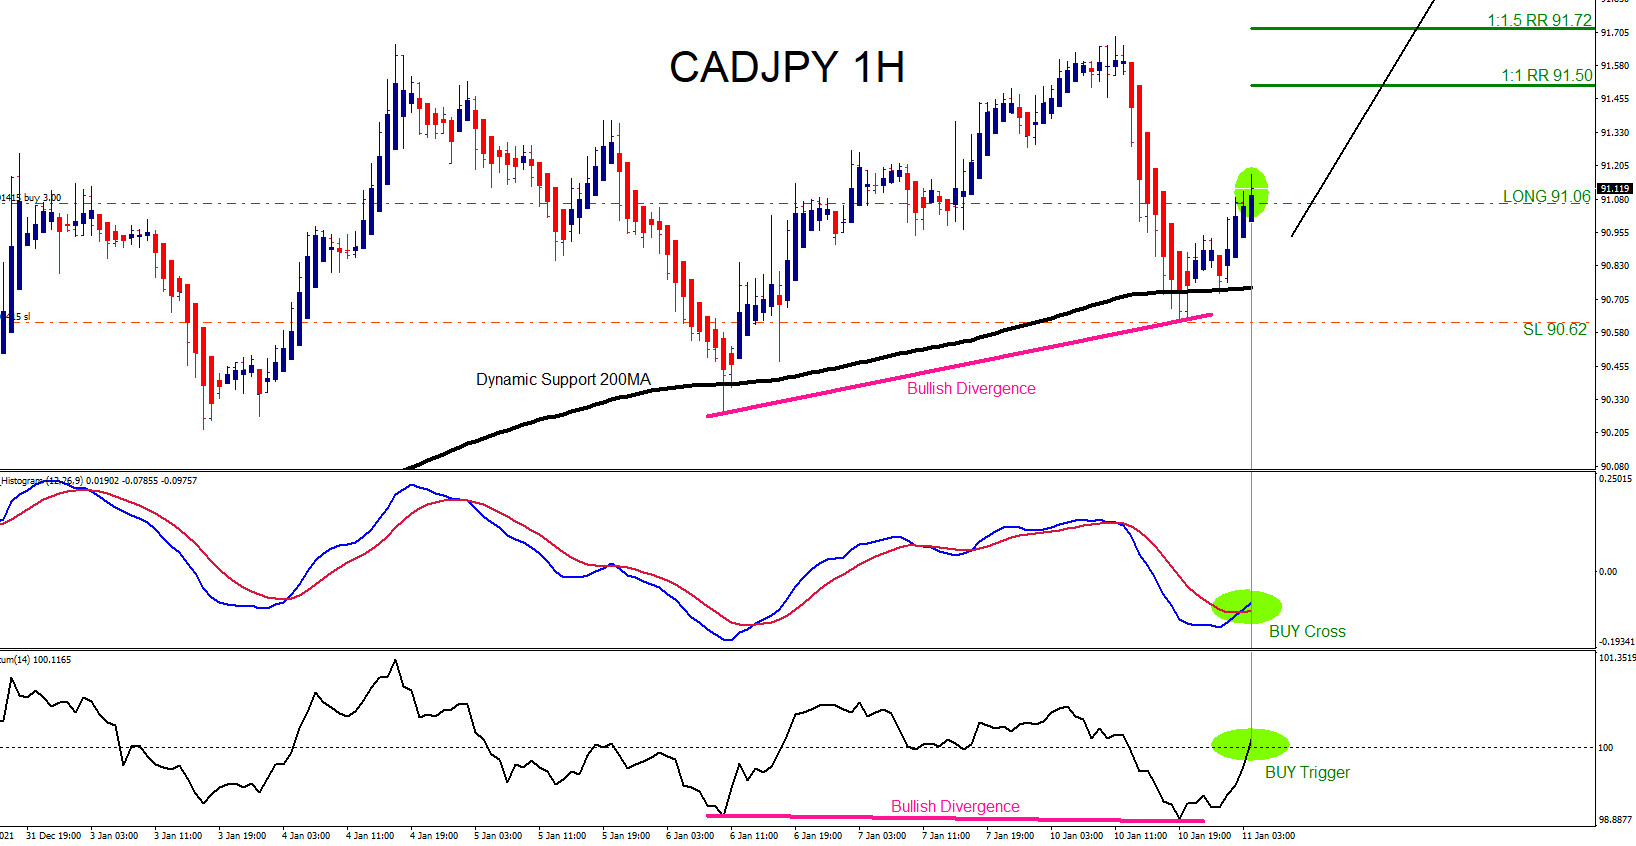
CADJPY : Trading the Move Higher
Read MoreOn January 10 2022 I posted on social media @AidanFX “ CADJPY LONG/BUY at 91.06 SL/Stop Loss at 90.62 TP/Take Profit at the 91.50-91.72 area.“ Confluence trading is a combination of two or more trading strategies/techniques that come together and form a high probability buy/sell zone in a certain area in the market. Market patterns […]
-
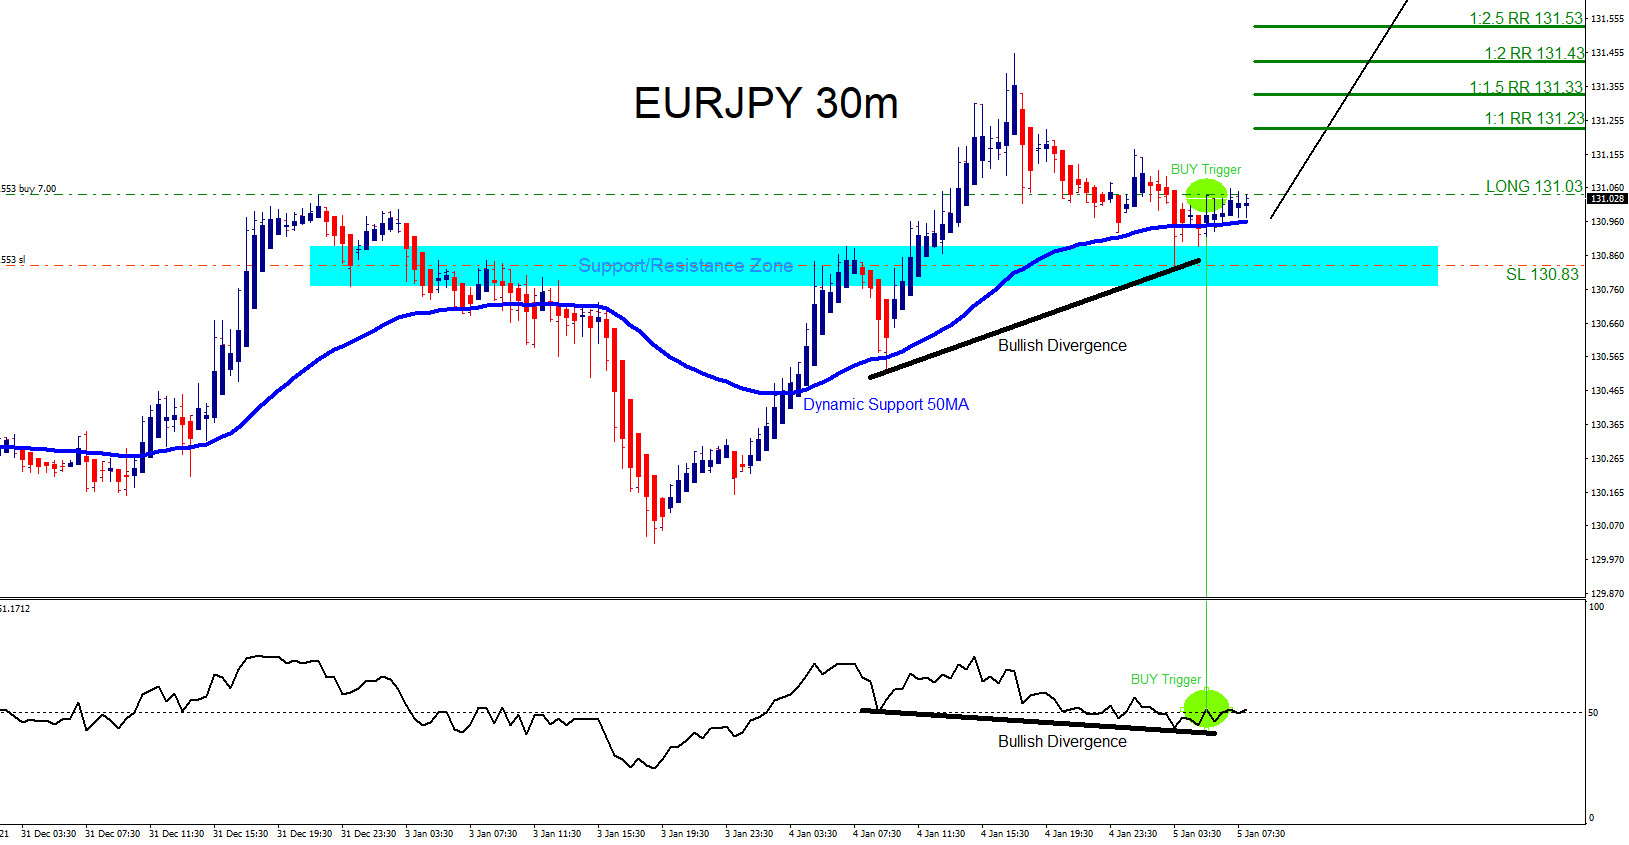
EURJPY : Trading the Move Higher
Read MoreOn January 5 2022 I posted on social media @AidanFX “ EURJPY watch for a move higher towards the 131.50 area. Watch for buying opportunities as long price stays above 130.83.“ Confluence trading is a combination of two or more trading strategies/techniques that come together and form a high probability buy/sell zone in a certain […]
-
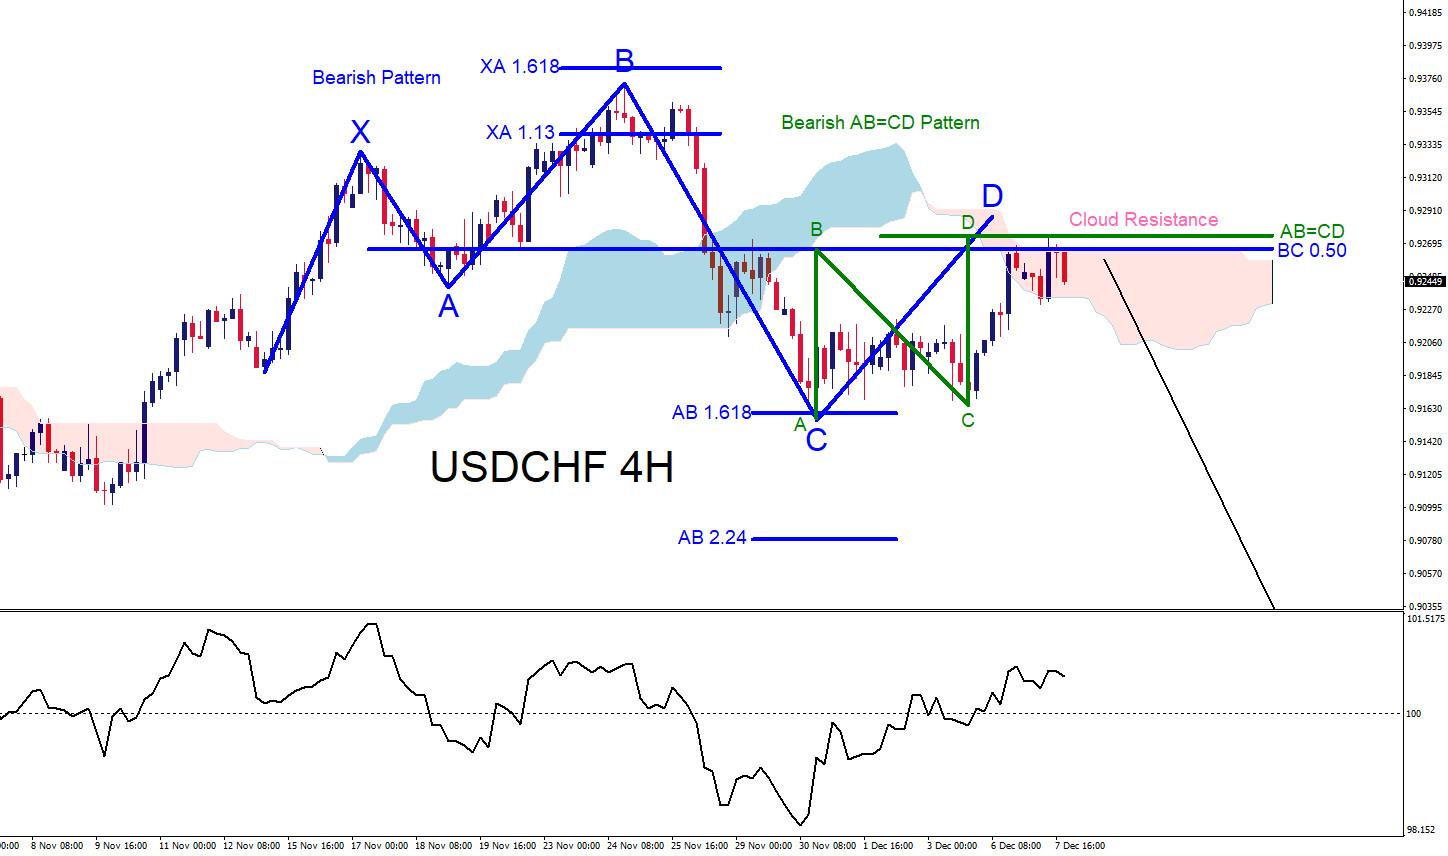
USDCHF : Market Patterns Signalled the Move Lower
Read MoreThere were several patterns that signalled the USDCHF pair would move lower on December the 7th and the 22nd of 2021. Confluence trading is a combination of two or more trading strategies/techniques that come together and form a high probability buy/sell zone in a certain area in the market. Market patterns (Elliott Waves, Harmonic, Head and […]